ASCTrendK
Download script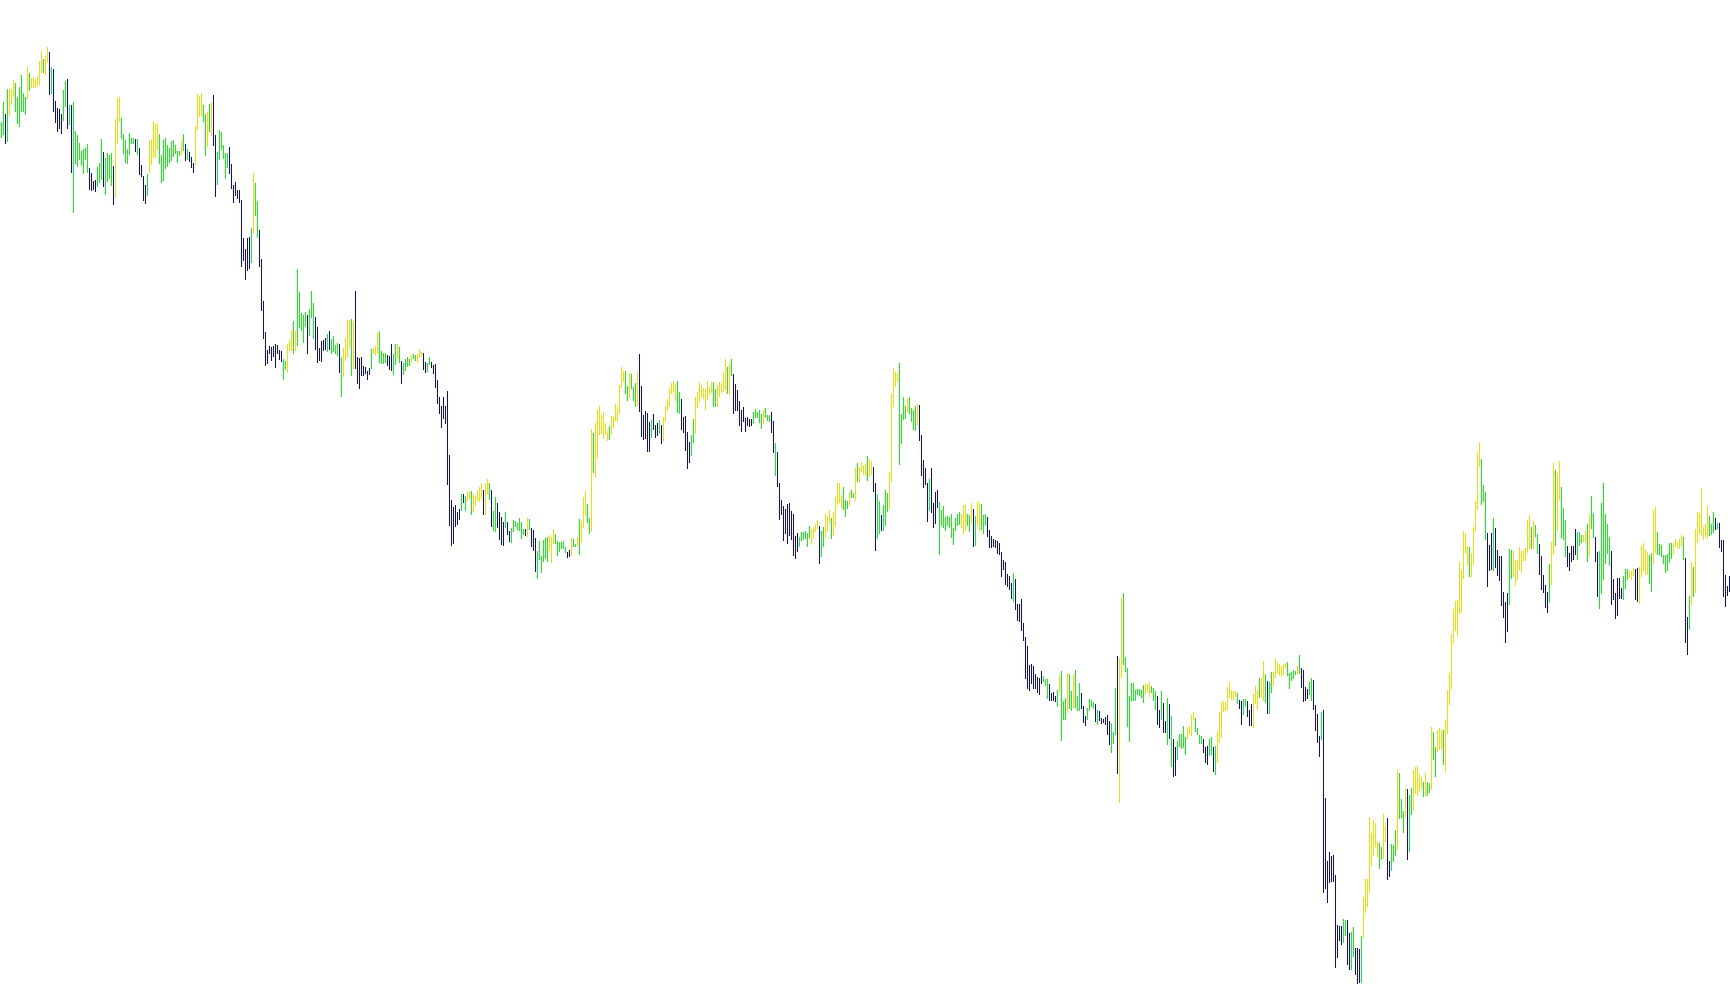
This tool is designed to provide a visual representation of market trends by identifying significant shifts in price momentum. It analyzes historical price action to distinguish between upward and downward movements, helping traders perceive the prevailing "flow" of the market more clearly.
Core Logic Overview
The script functions by calculating a specific type of momentum intensity based on the volatility of recent price candles. Instead of just looking at where the price is currently moving, it evaluates how much distance the price has covered over a specific window of time relative to its average behavior.
How it Works
- Volatility Awareness: The tool first measures the "Average Range" of the market over the last 10 candles. This acts as a baseline to help the script understand what constitutes a "normal" move versus a "significant" move in the current environment.
- Dynamic Sensitivity: To ensure accuracy, the logic adapts itself based on how fast the price is moving. If it detects a sudden, large jump in price (a spike), it adjusts its internal settings to be more sensitive. If it sees a steady, consistent trend, it smooths out its calculations to avoid "noise."
- Trend Identification: By comparing these momentum values against specific thresholds (determined by the user-defined Risk factor), the script categorizes the market state:
- Bullish State: When momentum falls below a certain threshold, it identifies an upward trend.
- Bearish State: When momentum rises above a specific high threshold, it identifies a downward trend.
Visual Representation
The results are displayed on your chart as colored histograms. The tool separates these into two distinct layers: one representing the "Up" trend (Lime) and one representing the "Down" trend (Red). By observing these bars, you can see where the momentum has shifted, allowing for a clearer perspective on whether the market is currently favoring buyers or sellers.
//+------------------------------------------------------------------+
//|                                                    ASCTrend1.mq4 |
//|                                              thanks to komposter |C0Rpus - big thanks CHANGE2002, STEPAN and SERSH
//|                                             komposterius@mail.ru |
//+------------------------------------------------------------------+
#property copyright "thanks to komposter"
#property link      "komposterius@mail.ru"

#property indicator_chart_window
#property indicator_buffers 2
#property indicator_color1 Lime
#property indicator_color2 Red

extern double RISK = 3;

double buf0[]; //ASC_Trend_Up
double buf1[]; //ASC_Trend_Down

int init()
{
	IndicatorShortName( "ASCTrend1" );
	IndicatorDigits ( MarketInfo( Symbol(), MODE_DIGITS ) );

	SetIndexBuffer( 0 , buf0 );
	SetIndexStyle ( 0 , DRAW_HISTOGRAM );
	SetIndexDrawBegin( 0 , 12 );
	SetIndexLabel( 0 , "ASC_Trend_Up");

	SetIndexBuffer( 1 , buf1 );
	SetIndexStyle ( 1 , DRAW_HISTOGRAM );
	SetIndexDrawBegin( 1 , 12 );
	SetIndexLabel( 1 , "ASC_Trend_Down");

return(0);
}

int start()
{
	int counted_bars=IndicatorCounted();
	if ( Bars <= 100 ) return(-1);
	if ( counted_bars < 0 ) return(-1);
	if ( counted_bars > 0 ) counted_bars -- ;

   int limit = Bars - 12;
   if ( counted_bars > 0 ) { limit = Bars - counted_bars - 12; }

	double x1 = 67 + RISK, x2 = 33 - RISK;
	for ( int i = limit; i >= 0; i -- )
	{
		double ASC_Trend_Up = 0, ASC_Trend_Down = 0, SummRange = 0, AvgRange = 0;

		for ( int u = i + 9; u >= i; u -- )
		{ SummRange += High[u] - Low[u]; }
		AvgRange = SummRange / 10;

		int WprPeriod = 3 + RISK * 2;

		for ( u = i + 9; u >= i; u -- )
		{
			if ( MathAbs( Open[u] - Close[u+1] ) >= AvgRange * 2 )
			{ WprPeriod = 3; break; }
		}

		for ( u = i + 6; u >= i; u -- )
		{
			if ( MathAbs( Close[u+3] - Close[u] ) >= AvgRange * 4.6 )
			{ WprPeriod = 4; break; }
		}

		double WprAbs = 100 + iWPR( Symbol(), 0, WprPeriod, i );

		if ( WprAbs < x2 )
		{
			ASC_Trend_Up=Low[i];
			ASC_Trend_Down=High[i];
		}
		if ( WprAbs > x1 )
		{
			ASC_Trend_Down=Low[i];
			ASC_Trend_Up=High[i];
		}

		buf0[i] = ASC_Trend_Up;
		buf1[i] = ASC_Trend_Down;
	}
return(0);
}

int deinit()
{
return(0);
}
Comments