hashi_sub
Download script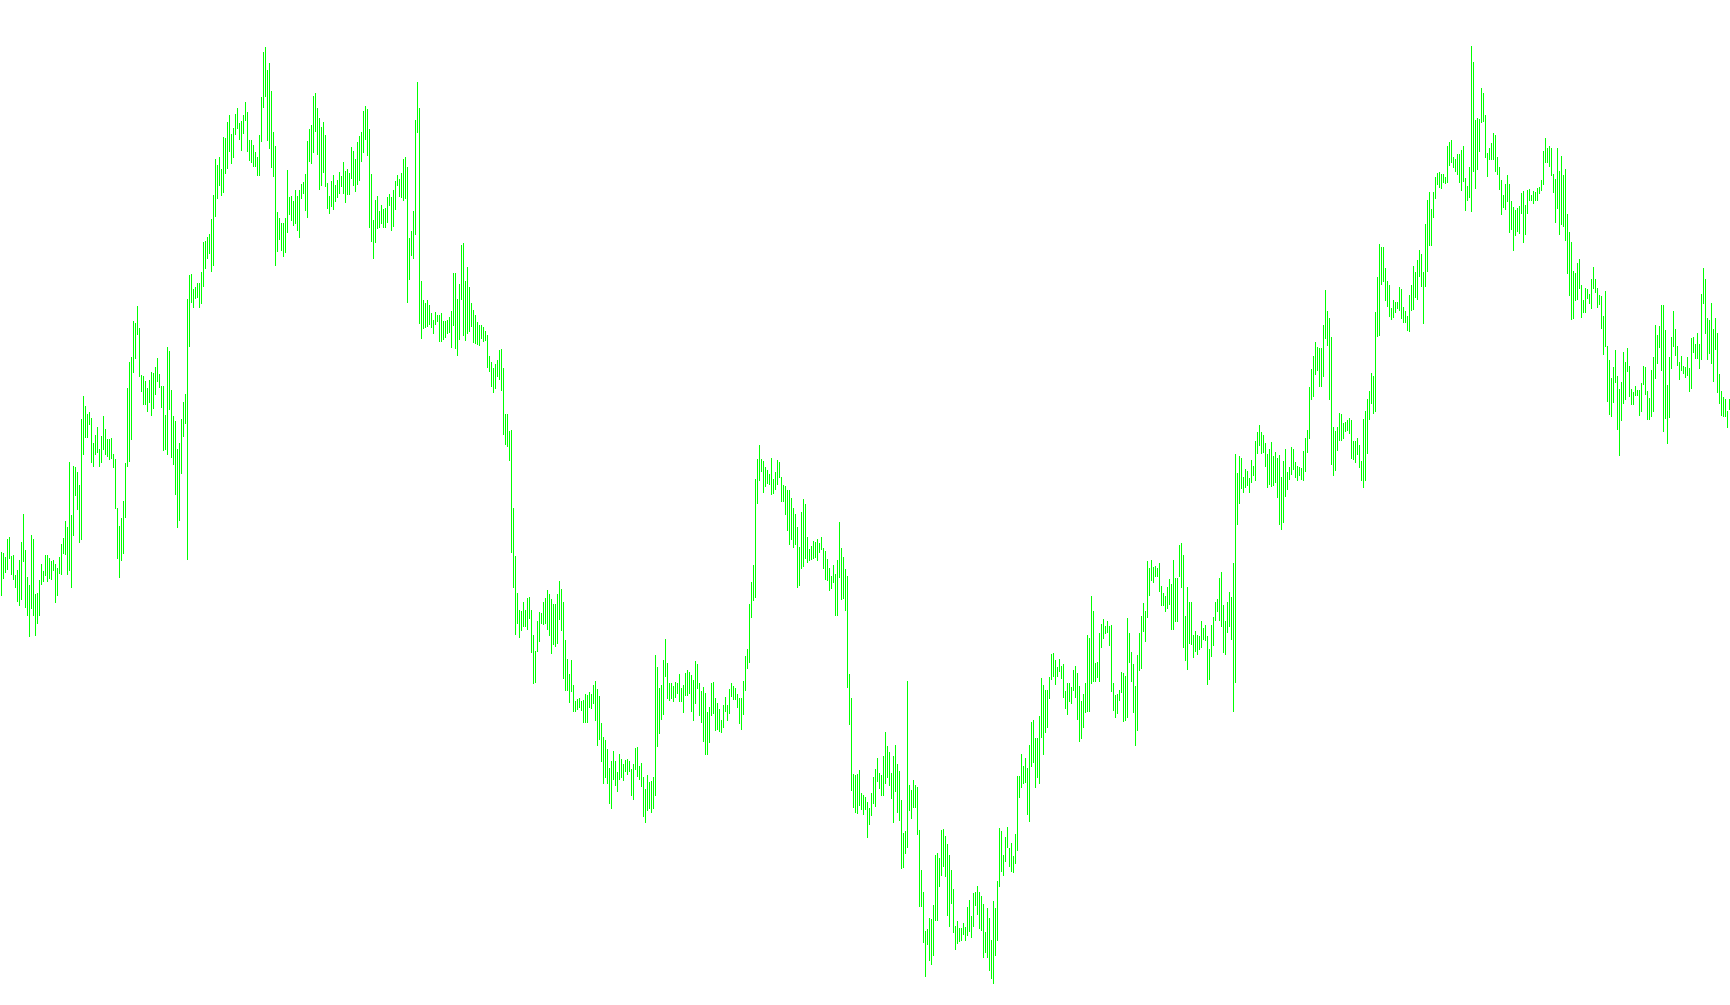
This script is designed to provide a specialized visual tool for traders using the MetaTrader platform. It specifically creates a secondary viewing area (a subwindow) that displays "Heiken Ashi" candles, which are a modified type of price chart used to filter out market noise and highlight trends more clearly than standard Japanese candlesticks.
Core Functionality
The primary purpose of this script is to translate standard price data into a smoother, trend-oriented visual format. Instead of cluttering the main price chart, it occupies its own separate space, allowing you to observe momentum without losing sight of your primary trading view.
How the Logic Works
To create these custom candles, the script follows a specific mathematical process for every price bar:
- Trend Smoothing: It calculates the "Open" and "Close" values of the Heiken Ashi candles by averaging the previous period's data with the current period's high and low prices. This smoothing effect helps to dampen out erratic, small price fluctuations.
- Dynamic Range Detection: For every new candle, the script determines the highest and lowest points reached during that time frame. It ensures that the visual "wick" of the candle accurately reflects the true extremes of the price movement while maintaining the smoothed body of the candle.
- Color Coding for Momentum: The script automatically detects the direction of the trend:
- If the price is moving downward (the calculated open is higher than the close), it renders the candles in Red.
- If the price is moving upward (the calculated open is lower than the close), it renders them in Green.
Visual Features & Customization
The script includes several user-friendly features to enhance the viewing experience:
- Customizable Thickness: Users can choose how wide the candles appear on the screen, ranging from thin to thick profiles, depending on their preference for visual clarity.
- Dynamic Bid/Ask Lines: The script can automatically draw horizontal lines representing the current "Bid" and "Ask" prices directly within the subwindow. These lines update in real-time as the market moves.
- Smart Color Adaptation: The tool is designed to be visually cohesive. It can detect your chart's background color and automatically adjust its own internal colors so that the candles remain easy to read regardless of your personal theme settings.
- Automatic Cleanup: When you remove the script from your chart, it is programmed to automatically delete the extra lines and objects it created, leaving your trading workspace clean.
//+------------------------------------------------------------------+
//|                                                    HAshi_sub.mq4 |
//|                                                Maxim A.Kuznetsov |
//|                                            nektomk.wordpress.com |
//+------------------------------------------------------------------+
#property copyright "Maxim A.Kuznetsov"
#property link      "nektomk.wordpress.com"
#property version   "1.00"
#property description "Heiken Ashi Candles in subwindow"
#property strict
#property indicator_separate_window
#property indicator_buffers 8
#property indicator_plots   8

//--- plot GREEN_CLOSE
#property indicator_label1  "GREEN_CLOSE"
#property indicator_type1   DRAW_HISTOGRAM
#property indicator_color1  clrGreen
#property indicator_style1  STYLE_SOLID
#property indicator_width1  5
//--- plot GREEN_OPEN
#property indicator_label2  "GREEN_OPEN"
#property indicator_type2   DRAW_HISTOGRAM
#property indicator_color2  clrWhite
#property indicator_style2  STYLE_SOLID
#property indicator_width2  5
//--- plot GREEN_HIGH
#property indicator_label3  "GREEN_HIGH"
#property indicator_type3   DRAW_HISTOGRAM
#property indicator_color3  clrGreen
#property indicator_style3  STYLE_SOLID
#property indicator_width3  1
//--- plot GREEN_LOW
#property indicator_label4  "GREEN_LOW"
#property indicator_type4   DRAW_HISTOGRAM
#property indicator_color4  clrWhite
#property indicator_style4  STYLE_SOLID
#property indicator_width4  1

//--- plot RED_OPEN
#property indicator_label5  "RED_OPEN"
#property indicator_type5   DRAW_HISTOGRAM
#property indicator_color5  clrRed
#property indicator_style5  STYLE_SOLID
#property indicator_width5  5
//--- plot RED_CLOSE
#property indicator_label6  "RED_CLOSE"
#property indicator_type6   DRAW_HISTOGRAM
#property indicator_style6  STYLE_SOLID
#property indicator_color6  clrWhite
#property indicator_width6  5
//--- plot RED_HIGH
#property indicator_label7  "RED_HIGH"
#property indicator_type7   DRAW_HISTOGRAM
#property indicator_color7  clrRed
#property indicator_style7  STYLE_SOLID
#property indicator_width7  1
//--- plot RED_LOW
#property indicator_label8  "RED_LOW"
#property indicator_type8   DRAW_HISTOGRAM
#property indicator_style8  STYLE_SOLID
#property indicator_color8  clrWhite
#property indicator_width8  1
//+------------------------------------------------------------------+
//|                                                                  |
//+------------------------------------------------------------------+
enum ENUM_CANDLE_WIDTH
  {
   CANDLE_2=2,    // 2
   CANDLE_THIN=3, // 3
   CANDLE_MID=4,  // 4
   CANDLE_THIK=5  // 5
  };
sinput color GREEN_CANDLE=clrGreen; // color for "green" candle:
sinput color RED_CANDLE=clrRed;     // color for "red" candle:
sinput ENUM_CANDLE_WIDTH CANDLE_WIDTH=CANDLE_THIK; // width for candles:
sinput bool SHOW_BID=true; // show "Bid" line
sinput bool SHOW_ASK=true; // show "Ask" line
color bg;
//--- indicator buffers
double         GREEN_HIGH[];
double         GREEN_OPEN[];
double         GREEN_CLOSE[];
double         GREEN_LOW[];
double         RED_HIGH[];
double         RED_OPEN[];
double         RED_CLOSE[];
double         RED_LOW[];
// Bid && Ask lines
string shortName; // shortname
long chart;     // chart
int subwin;    // subwindow
int indId;     // indicator id in subwin
string prefix; // common object prefix

string hlineBid;
color colorBid;

string hlineAsk;
color colorAsk;
//+------------------------------------------------------------------+
//| Custom indicator initialization function                         |
//+------------------------------------------------------------------+
int OnInit()
  {
   string obj;
   IndicatorDigits(_Digits);
   chart=ChartID();
   MathSrand((int)GetMicrosecondCount());
// determine main subwin
   shortName=StringFormat("HAshi_sub %d",MathRand());
   IndicatorShortName(shortName);
   int total,totalWin;
   totalWin=(int)ChartGetInteger(chart,CHART_WINDOWS_TOTAL);
   for(subwin=1;subwin<totalWin;subwin++)
     {
      total=ChartIndicatorsTotal(chart,subwin);
      for(indId=0;indId<total;indId++)
        {
         printf("check %s vs %s",ChartIndicatorName(chart,subwin,indId),shortName);
         if(ChartIndicatorName(chart,subwin,indId)==shortName) break;
        }
      if(indId!=total) break;
     }
   if(subwin==totalWin)
     {
      return INIT_FAILED;
     }
   shortName=StringFormat("Heiken Ashi %s",_Symbol);
   IndicatorShortName(shortName);
// create indicator objects (hlineAsk & hlineBid)
   prefix=StringFormat("%dHashi_sub%s",MathRand(),_Symbol);
   if(SHOW_BID)
     {
      obj=hlineBid=prefix+"hlineBid";
      if(!ObjectCreate(chart,obj,OBJ_HLINE,subwin,0,Bid) || ObjectType(obj)!=OBJ_HLINE)
        {
         return INIT_FAILED;
        }
      colorBid=(color)ChartGetInteger(chart,CHART_COLOR_GRID);
      ObjectSetInteger(chart,obj,OBJPROP_COLOR,colorBid);
      ObjectSetInteger(chart,obj,OBJPROP_WIDTH,1);
      ObjectSetInteger(chart,obj,OBJPROP_STYLE,STYLE_SOLID);
      ObjectSetDouble(chart,obj,OBJPROP_PRICE,Bid);
     }
   if(SHOW_ASK)
     {
      obj=hlineAsk=prefix+"hlineAsk";
      if(!ObjectCreate(chart,obj,OBJ_HLINE,subwin,0,Bid) || ObjectType(obj)!=OBJ_HLINE)
        {
         return INIT_FAILED;
        }
      colorAsk=(color)ChartGetInteger(chart,CHART_COLOR_ASK);
      ObjectSetInteger(chart,obj,OBJPROP_COLOR,colorAsk);
      ObjectSetInteger(chart,obj,OBJPROP_WIDTH,1);
      ObjectSetInteger(chart,obj,OBJPROP_STYLE,STYLE_SOLID);
      ObjectSetDouble(chart,obj,OBJPROP_PRICE,Ask);
     }
   bg=(color)ChartGetInteger(ChartID(),CHART_COLOR_BACKGROUND);
//--- indicator buffers mapping
   SetIndexBuffer(0,GREEN_CLOSE);SetIndexStyle(0,DRAW_HISTOGRAM,STYLE_SOLID,(int)CANDLE_WIDTH,GREEN_CANDLE);
   SetIndexBuffer(1,GREEN_OPEN);SetIndexStyle(1,DRAW_HISTOGRAM,STYLE_SOLID,(int)CANDLE_WIDTH,bg);
   SetIndexBuffer(2,GREEN_HIGH);SetIndexStyle(2,DRAW_HISTOGRAM,STYLE_SOLID,1,GREEN_CANDLE);
   SetIndexBuffer(3,GREEN_LOW);SetIndexStyle(3,DRAW_HISTOGRAM,STYLE_SOLID,1,bg);
   SetIndexBuffer(4,RED_OPEN);SetIndexStyle(4,DRAW_HISTOGRAM,STYLE_SOLID,(int)CANDLE_WIDTH,RED_CANDLE);
   SetIndexBuffer(5,RED_CLOSE);SetIndexStyle(5,DRAW_HISTOGRAM,STYLE_SOLID,(int)CANDLE_WIDTH,bg);
   SetIndexBuffer(6,RED_HIGH);SetIndexStyle(6,DRAW_HISTOGRAM,STYLE_SOLID,1,RED_CANDLE);
   SetIndexBuffer(7,RED_LOW);SetIndexStyle(7,DRAW_HISTOGRAM,STYLE_SOLID,1,bg);
//---
   return(INIT_SUCCEEDED);
  }
//+------------------------------------------------------------------+
//|                                                                  |
//+------------------------------------------------------------------+
void OnDeinit(const int reason)
  {
   if(hlineBid!="") ObjectDelete(chart,hlineBid);
   if(hlineAsk!="") ObjectDelete(chart,hlineAsk);
  }
//+------------------------------------------------------------------+
//|                                                                  |
//+------------------------------------------------------------------+
void OnChartEvent(const int id,
                  const long &lparam,
                  const double &dparam,
                  const string &sparam
                  )
  {
   if(id==CHARTEVENT_CHART_CHANGE)
     {
      color b;
      b=(color)ChartGetInteger(ChartID(),CHART_COLOR_BACKGROUND);
      if(b!=bg)
        {
         bg=b;
         SetIndexStyle(1,DRAW_HISTOGRAM,STYLE_SOLID,5,b);
         SetIndexStyle(3,DRAW_HISTOGRAM,STYLE_SOLID,1,b);
         SetIndexStyle(5,DRAW_HISTOGRAM,STYLE_SOLID,5,b);
         SetIndexStyle(7,DRAW_HISTOGRAM,STYLE_SOLID,1,b);
        }
      if(hlineBid!="")
        {
         b=(color)ChartGetInteger(ChartID(),CHART_COLOR_GRID);
         if(b!=colorBid)
           {
            colorBid=b;
            ObjectSetInteger(chart,hlineBid,OBJPROP_COLOR,colorBid);
           }
        }
      if(hlineAsk!="")
        {
         b=(color)ChartGetInteger(ChartID(),CHART_COLOR_ASK);
         if(b!=colorAsk)
           {
            colorBid=b;
            ObjectSetInteger(chart,hlineAsk,OBJPROP_COLOR,colorAsk);
           }
        }
     }
  }
//+------------------------------------------------------------------+
//| Custom indicator iteration function                              |
//+------------------------------------------------------------------+
int OnCalculate(const int rates_total,
                const int prev_calculated,
                const datetime &time[],
                const double &open[],
                const double &high[],
                const double &low[],
                const double &close[],
                const long &tick_volume[],
                const long &volume[],
                const int &spread[])
  {
   int bar;
   double hashi_open,hashi_high,hashi_low,hashi_close;

   AllArraysAsNormal(open,high,low,close);

   for(bar=prev_calculated;bar<rates_total;bar++)
     {
      GREEN_OPEN[bar]=GREEN_HIGH[bar]=GREEN_LOW[bar]=GREEN_CLOSE[bar]=EMPTY_VALUE;
      RED_OPEN[bar]=RED_HIGH[bar]=RED_LOW[bar]=RED_CLOSE[bar]=EMPTY_VALUE;

      if(bar<1) continue;
      hashi_open=(open[bar-1]+close[bar-1])/2;
      hashi_close=(open[bar]+close[bar]+high[bar]+low[bar])/4;
      hashi_high=MathMax(high[bar],MathMax(hashi_open,hashi_close));
      hashi_low=MathMin(low[bar],MathMin(hashi_open,hashi_close));

      if(hashi_open>=hashi_close)
        {
         RED_OPEN[bar]=hashi_open;
         RED_HIGH[bar]=hashi_high-_Point;
         RED_LOW[bar]=hashi_low;
         RED_CLOSE[bar]=hashi_close-_Point;
           } else {
         GREEN_OPEN[bar]=hashi_open;
         GREEN_HIGH[bar]=hashi_high-_Point;
         GREEN_LOW[bar]=hashi_low;
         GREEN_CLOSE[bar]=hashi_close-_Point;
        }
     }
   if(hlineBid!="") ObjectSetDouble(chart,hlineBid,OBJPROP_PRICE,Bid);
   if(hlineAsk!="") ObjectSetDouble(chart,hlineAsk,OBJPROP_PRICE,Ask);
   return(rates_total-2);
  }
//+------------------------------------------------------------------+
//|                                                                  |
//+------------------------------------------------------------------+
void AllArraysAsNormal(const double &open[],const double &high[],const double &low[],const double &close[])
  {
   ArraySetAsSeries(GREEN_HIGH,false);
   ArraySetAsSeries(GREEN_OPEN,false);
   ArraySetAsSeries(GREEN_CLOSE,false);
   ArraySetAsSeries(GREEN_LOW,false);
   ArraySetAsSeries(RED_HIGH,false);
   ArraySetAsSeries(RED_OPEN,false);
   ArraySetAsSeries(RED_CLOSE,false);
   ArraySetAsSeries(RED_LOW,false);

   ArraySetAsSeries(open,false);
   ArraySetAsSeries(high,false);
   ArraySetAsSeries(low,false);
   ArraySetAsSeries(close,false);
  }
//+------------------------------------------------------------------+
Comments