flag_and_pennant
Download script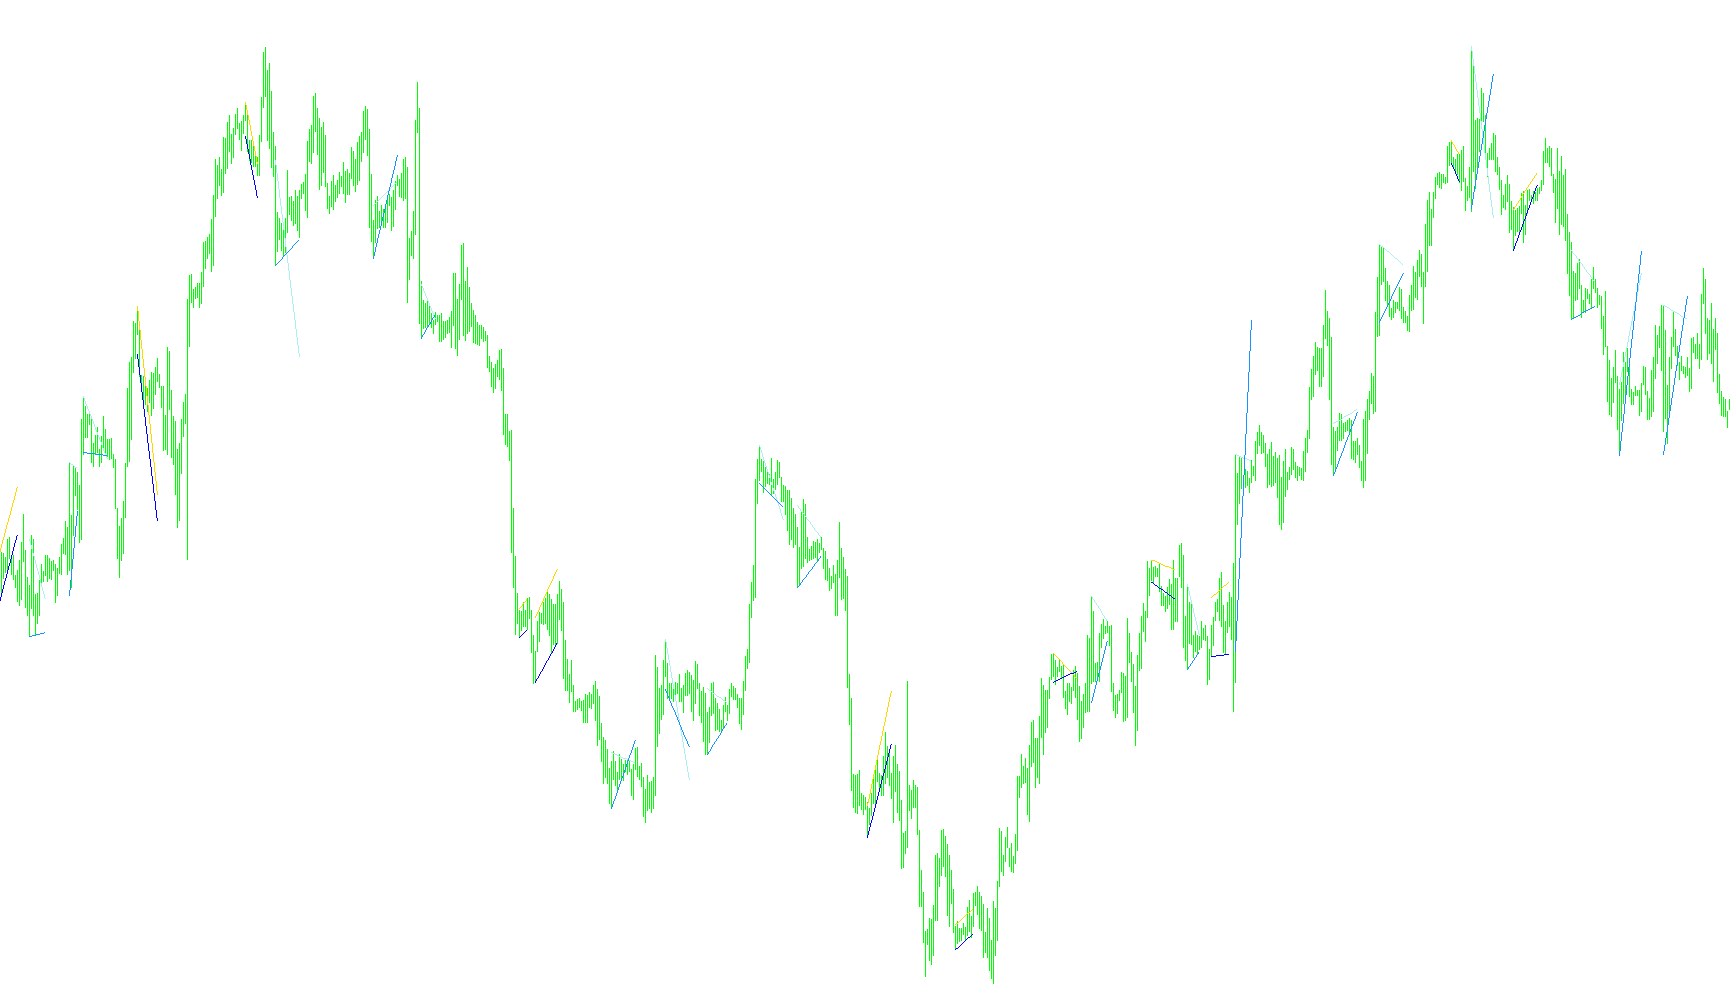
This script is a specialized technical analysis tool designed to identify specific geometric price patterns—specifically Flags and Pennants—on a trading chart. It automates the process of detecting these formations by analyzing price trends, slopes, and historical price ranges.
Core Operational Logic
The logic functions by breaking down market movement into three primary layers:
1. Trend and Slope Analysis The tool first calculates the "health" and direction of the current market trend. It uses a mathematical technique called linear regression to determine the slope of the price over a specific period. By doing this, it can distinguish between a steady trend, a sideways consolidation, and an accelerating movement. It establishes a "Median Buffer," which acts as a baseline for these calculations.
2. Structural Pattern Detection Once the general trend is understood, the script looks for two specific structural behaviors:
- The Flag: This is identified by looking for a period of consolidation (a small range of movement) that occurs immediately following a strong directional move. The logic checks if the price has "rested" within a tight enough boundary to qualify as a flag.
- The Pennant: This is identified by a symmetrical contraction in price. The script looks for a specific "narrowing" effect where the high and low points of the price movement are converging toward a center point, creating the triangular shape characteristic of a pennant.
3. Pattern Projection (Drawing Logic) When the script successfully identifies either a Flag or a Pennant, it doesn't just mark the point of origin; it projects the expected future path of that pattern based on the calculated angles:
- Extension Lines: It draws lines representing the "upper" and "lower" boundaries of the pattern.
- Proportional Scaling: The tool calculates how far the price moved during the initial breakout and applies those same proportions to the projected "extension" area. This helps visual learners see where the price might realistically head if the current pattern completes.
Summary of Visual Output
For the user, this script transforms raw price data into a structured visual map:
- Blue Lines: Typically represent the boundaries of a Flag formation.
- Green Lines: Typically represent the boundaries of a Pennant formation.
- Regression Line: A gray line (or similar) that provides the underlying mathematical trend of the current price action.
In essence, the script acts as an automated "chart pattern hunter," filtering out the noise of the market to highlight specific zones where traders often look for breakout opportunities.
ÿþ//+------------------------------------------------------------------+
//| Flag_and_Pennant.mq4 |
//| Flag_and_Pennant Copyright 2015, fxborg |
//| http://fxborg-labo.hateblo.jp/ |
//+------------------------------------------------------------------+
#property copyright "Copyright 2015, fxborg"
#property link "http://fxborg-labo.hateblo.jp/"
#property version "1.0"
#property strict
#property indicator_chart_window
#property indicator_buffers 5
//--- plot Label1
#property indicator_type1 DRAW_LINE
#property indicator_type2 DRAW_LINE
#property indicator_type3 DRAW_LINE
#property indicator_type4 DRAW_LINE
#property indicator_type5 DRAW_NONE
//---
#property indicator_color1 Blue
#property indicator_color2 Blue
#property indicator_color3 Green
#property indicator_color4 Green
#property indicator_color5 Gray
#property indicator_label1 "Flag"
#property indicator_label2 "Flag"
#property indicator_label3 "Pennant"
#property indicator_label4 "Pennant"
#property indicator_label5 "Regression Line"
//---
#property indicator_width1 2
#property indicator_width2 2
#property indicator_width3 2
#property indicator_width4 2
#property indicator_width5 1
#property indicator_style1 STYLE_SOLID
#property indicator_style2 STYLE_SOLID
#property indicator_style3 STYLE_SOLID
#property indicator_style4 STYLE_SOLID
#property indicator_style5 STYLE_SOLID
//--- input parameters
input int InpChannelPeriod = 14; // Channel Period
input int InpSlopePeriod = 50; // Slope Period
input double InpPennantPatternFacter=-10; // Pennant Pattern Facter
input double InpFlagPatternFacter=5; // Flag Pattern Facter
int FlagPeriod=10;
int FlagMinPeriod=5;
double PennantPatternFacter=InpPennantPatternFacter;
double FlagPatternFacter=InpFlagPatternFacter;
//---
int min_rates_total;
//--- indicator buffers
double FlagH_Buffer[];
double FlagL_Buffer[];
double PennantH_Buffer[];
double PennantL_Buffer[];
//---- for calc
double HighesBuffer[];
double LowesBuffer[];
double MedianBuffer[];
double SlopeBuffer[];
double SigH_Buffer[];
double SigL_Buffer[];
//+------------------------------------------------------------------+
//| Custom indicator initialization function |
//+------------------------------------------------------------------+
int OnInit()
{
//---- Initialization of variables of data calculation starting point
min_rates_total=1+InpSlopePeriod+1;
if(InpSlopePeriod<InpChannelPeriod)
{
Alert("InpSlopePeriod is too small.");
return(INIT_FAILED);
}
//--- indicator buffers mapping
IndicatorBuffers(10);
//--- indicator buffers
SetIndexBuffer(0,FlagH_Buffer);
SetIndexBuffer(1,FlagL_Buffer);
SetIndexBuffer(2,PennantH_Buffer);
SetIndexBuffer(3,PennantL_Buffer);
SetIndexBuffer(4,MedianBuffer);
//--- calc buffers
SetIndexBuffer(5,SigH_Buffer);
SetIndexBuffer(6,SigL_Buffer);
SetIndexBuffer(7,HighesBuffer);
SetIndexBuffer(8,LowesBuffer);
SetIndexBuffer(9,SlopeBuffer);
SetIndexEmptyValue(0,0);
SetIndexEmptyValue(1,0);
SetIndexEmptyValue(2,0);
SetIndexEmptyValue(3,0);
SetIndexEmptyValue(4,0);
SetIndexEmptyValue(5,0);
SetIndexEmptyValue(6,0);
SetIndexEmptyValue(7,0);
SetIndexEmptyValue(8,0);
SetIndexEmptyValue(9,0);
//---
string short_name="Flag and Pennant("+IntegerToString(InpChannelPeriod)+","+IntegerToString(InpSlopePeriod)+")";
IndicatorShortName(short_name);
//---
return(INIT_SUCCEEDED);
}
//+------------------------------------------------------------------+
//| De-initialization |
//+------------------------------------------------------------------+
int deinit()
{
string short_name="Flag and Pennant("+IntegerToString(InpChannelPeriod)+","+IntegerToString(InpSlopePeriod)+")";
IndicatorShortName(short_name);
return(0);
}
//+------------------------------------------------------------------+
//| Custom indicator iteration function |
//+------------------------------------------------------------------+
int OnCalculate(const int rates_total,
const int prev_calculated,
const datetime &time[],
const double &open[],
const double &high[],
const double &low[],
const double &close[],
const long &tick_volume[],
const long &volume[],
const int &spread[])
{
//---
int i,j,k,first;
//--- check for bars count
if(rates_total<=min_rates_total)
return(0);
//--- indicator buffers
ArraySetAsSeries(FlagH_Buffer,false);
ArraySetAsSeries(FlagL_Buffer,false);
ArraySetAsSeries(PennantH_Buffer,false);
ArraySetAsSeries(PennantL_Buffer,false);
//--- calc buffers
ArraySetAsSeries(HighesBuffer,false);
ArraySetAsSeries(LowesBuffer,false);
ArraySetAsSeries(MedianBuffer,false);
ArraySetAsSeries(SlopeBuffer,false);
ArraySetAsSeries(SigH_Buffer,false);
ArraySetAsSeries(SigL_Buffer,false);
//--- rate data
ArraySetAsSeries(high,false);
ArraySetAsSeries(low,false);
ArraySetAsSeries(close,false);
ArraySetAsSeries(time,false);
//+----------------------------------------------------+
//|Set High Low Buffeer |
//+----------------------------------------------------+
first=InpChannelPeriod-1;
if(first+1<prev_calculated)
first=prev_calculated-2;
else
{
for(i=0; i<first; i++)
{
LowesBuffer[i]=0.0;
HighesBuffer[i]=0.0;
}
}
for(i=first; i<rates_total && !IsStopped(); i++)
{
//--- calculate range spread
double dmin=1000000.0;
double dmax=-1000000.0;
//---
for(k=i-InpChannelPeriod+1; k<=i; k++)
{
if(dmin>low[k]) dmin=low[k];
if(dmax<high[k]) dmax=high[k];
}
//---
LowesBuffer[i]=dmin;
HighesBuffer[i]=dmax;
}
//+----------------------------------------------------+
//|Set Slope Buffeer |
//+----------------------------------------------------+
first=InpSlopePeriod-1;
if(first+1<prev_calculated)
first=prev_calculated-2;
else
{
for(i=0; i<first; i++)
{
MedianBuffer[i]=0.0;
SlopeBuffer[i]=0.0;
}
}
for(i=first; i<rates_total && !IsStopped(); i++)
{
//+----------------------------------------------------+
//| Trend Line |
//+----------------------------------------------------+
double a,b;
double price[],upper[],lower[];
ArraySetAsSeries(price,true);
//--- Get Rate info
int chk_c=CopyClose(Symbol(),PERIOD_CURRENT,rates_total-i,InpSlopePeriod,price);
if(chk_c<InpSlopePeriod)continue;
//--- Calc regression
if(calc_regression(a,b,InpSlopePeriod,price))
{
MedianBuffer[i]=a;
SlopeBuffer[i]=b;
}
else
{
SlopeBuffer[i]=SlopeBuffer[i-1];
MedianBuffer[i]=MedianBuffer[i-1]+SlopeBuffer[i-1];
}
}
//+----------------------------------------------------+
//|Set Flag and Pennant |
//+----------------------------------------------------+
first=InpSlopePeriod-1;
if(first+1<prev_calculated)
first=prev_calculated-2;
else
{
for(i=0; i<first; i++)
{
FlagH_Buffer[i]=0.0;
FlagL_Buffer[i]=0.0;
PennantH_Buffer[i]=0.0;
PennantL_Buffer[i]=0.0;
}
}
//+----------------------------------------------------+
//|Main loop |
//+----------------------------------------------------+
for(i=first; i<rates_total && !IsStopped(); i++)
{
//+----------------------------------------------------+
//|trend rest ? |
//+----------------------------------------------------+
bool is_up_rest=true;
for(j=0;j<FlagMinPeriod;j++)
{
if(MedianBuffer[i-j-1]>=MedianBuffer[i-j] ||
HighesBuffer[i]!=HighesBuffer[i-j])
{
is_up_rest=false;
}
}
bool is_down_rest=true;
for(j=0;j<FlagMinPeriod;j++)
{
if(MedianBuffer[i-j-1]<=MedianBuffer[i-j] ||
LowesBuffer[i]!=LowesBuffer[i-j])
{
is_down_rest=false;
}
}
//+----------------------------------------------------+
//|up trend |
//+----------------------------------------------------+
if(is_up_rest)
{
if(SigH_Buffer[i-1]!=0)
{
//+----------------------------------------------------+
//|exists |
//+----------------------------------------------------+
SigH_Buffer[i]=SigH_Buffer[i-1];
if(PennantH_Buffer[i-2]!=0)
{
PennantH_Buffer[i-1]=PennantH_Buffer[i-2]*2-PennantH_Buffer[i-3];
PennantL_Buffer[i-1]=PennantL_Buffer[i-2]*2-PennantL_Buffer[i-3];
}
if(FlagH_Buffer[i-2]!=0)
{
FlagH_Buffer[i-1]=FlagH_Buffer[i-2]*2-FlagH_Buffer[i-3];
FlagL_Buffer[i-1]=FlagL_Buffer[i-2]*2-FlagL_Buffer[i-3];
}
}
else
{
//+----------------------------------------------------+
//|detect pattern |
//+----------------------------------------------------+
double arr_hi[];
ArraySetAsSeries(arr_hi,true);
//--- Get Rate info
int chk_h=CopyHigh(Symbol(),PERIOD_CURRENT,rates_total-i,FlagPeriod,arr_hi);
if(chk_h<FlagPeriod)continue;
int from_pos=ArrayMaximum(arr_hi);
//---
if(from_pos>=FlagMinPeriod-1)
{
//---
double angle=-1000000.0;
int lower=1000000.0;
for(j=from_pos-1;j>=0;j--)
{
int pos=i-j-1;
double b=(high[i-from_pos-1]-high[pos])/((i-from_pos-1)-pos);
if(angle<b)angle=b;
// for find low bar
if(j>0 && lower>low[pos])lower=pos;
}
//---
double arr_lo[];
ArraySetAsSeries(arr_lo,true);
int chk_l=CopyLow(Symbol(),PERIOD_CURRENT,rates_total-i,(from_pos+1),arr_lo);
//---
if(chk_l<from_pos+1)continue;
double a,b;
calc_regression(a,b,from_pos+1,arr_lo);
double diff=0;
//---
for(j=0;j<=from_pos;j++)
{
if(diff<(a+b*j)-low[i-j-1]) diff=(a+b*j)-low[i-j-1];
}
//+----------------------------------------------------+
//| flag pattern or pennant pattern or ?? |
//+----------------------------------------------------+
int ptn=0; //1:flag 2:pennant
double up_angle=angle/_Point;
double dn_angle=b/-_Point;
if(up_angle-dn_angle<PennantPatternFacter) ptn=2;
else if(up_angle-dn_angle>=PennantPatternFacter &&
up_angle-dn_angle<FlagPatternFacter) ptn=1;
//+----------------------------------------------------+
//|Plot Lines |
//+----------------------------------------------------+
if(ptn>0)
{
SigH_Buffer[i]=high[i];
if(ptn==1)
{
FlagH_Buffer[i-from_pos-2]=0;
FlagL_Buffer[i-from_pos-2]=0;
}
else if(ptn==2)
{
PennantH_Buffer[i-from_pos-2]=0;
PennantL_Buffer[i-from_pos-2]=0;
}
//---
for(j=from_pos;j>=0;j--)
{
int pos=i-j-1;
if(ptn==1)
FlagH_Buffer[pos]=high[i-from_pos-1]+(angle*(pos -(i-from_pos-1)));
else if(ptn==2)
PennantH_Buffer[pos]=high[i-from_pos-1]+(angle*(pos -(i-from_pos-1)));
}
//---
for(j=0;j<=from_pos;j++)
{
if(ptn==1)
FlagL_Buffer[i-j-1]=a+b*j-diff/2;
else if(ptn==2)
PennantL_Buffer[i-j-1]=a+b*j-diff/2;
}
}
}
}
}
//+----------------------------------------------------+
//|down trend |
//+----------------------------------------------------+
if(is_down_rest)
{
//+----------------------------------------------------+
//|exists |
//+----------------------------------------------------+
if(SigL_Buffer[i-1]!=0)
{
SigL_Buffer[i]=SigL_Buffer[i-1];
if(PennantL_Buffer[i-2]!=0)
{
PennantH_Buffer[i-1]=PennantH_Buffer[i-2]*2-PennantH_Buffer[i-3];
PennantL_Buffer[i-1]=PennantL_Buffer[i-2]*2-PennantL_Buffer[i-3];
}
if(FlagL_Buffer[i-2]!=0)
{
FlagH_Buffer[i-1]=FlagH_Buffer[i-2]*2-FlagH_Buffer[i-3];
FlagL_Buffer[i-1]=FlagL_Buffer[i-2]*2-FlagL_Buffer[i-3];
}
}
else
{
//+----------------------------------------------------+
//| detect |
//+----------------------------------------------------+
double arr_lo[];
ArraySetAsSeries(arr_lo,true);
//--- Get Rate info
int chk_l=CopyLow(Symbol(),PERIOD_CURRENT,rates_total-i,FlagPeriod,arr_lo);
if(chk_l<FlagPeriod)continue;
int from_pos=ArrayMinimum(arr_lo);
//---
if(from_pos>=FlagMinPeriod-1)
{
int lower[];
int sz=0;
//---
for(j=from_pos-1;j>=0;j--)
{
if(low[i-j-2]>=low[i-j-1])
{
sz++;
ArrayResize(lower,sz);
lower[sz-1]=i-j-1;
}
}
//---
double angle=1000000.0;
for(j=from_pos-1;j>=0;j--)
{
int pos=i-j-1;
double b=(low[i-from_pos-1]-low[pos])/((i-from_pos-1)-pos);
if(angle>b)angle=b;
}
//---
double arr_hi[];
ArraySetAsSeries(arr_hi,true);
int chk_h=CopyHigh(Symbol(),PERIOD_CURRENT,rates_total-i,(from_pos+1),arr_hi);
if(chk_h<from_pos+1)continue;
//---
double a,b;
calc_regression(a,b,from_pos+1,arr_hi);
double diff=0;
//---
for(j=0;j<=from_pos;j++)
{
if(diff<(a+b*j)-high[i-j-1]) diff=(a+b*j)-high[i-j-1];
}
//+----------------------------------------------------+
//| flag pattern or pennant pattern or ?? |
//+----------------------------------------------------+
int ptn=0;
double up_angle=b/-_Point;
double dn_angle=angle/_Point;
if(up_angle-dn_angle<PennantPatternFacter) ptn=2;
else if(up_angle-dn_angle>=PennantPatternFacter &&
up_angle-dn_angle<FlagPatternFacter) ptn=1;
//+----------------------------------------------------+
//|Plot Lines |
//+----------------------------------------------------+
if(ptn>0)
{
SigL_Buffer[i]=low[i];
if(ptn==1)
{
FlagH_Buffer[i-from_pos-2]=0;
FlagL_Buffer[i-from_pos-2]=0;
}
else if(ptn==2)
{
PennantH_Buffer[i-from_pos-2]=0;
PennantL_Buffer[i-from_pos-2]=0;
}
//---
for(j=from_pos;j>=0;j--)
{
int pos=i-j-1;
if(ptn==1)
FlagL_Buffer[pos]=low[i-from_pos-1]+(angle*(pos -(i-from_pos-1)));
else if(ptn==2)
PennantL_Buffer[pos]=low[i-from_pos-1]+(angle*(pos -(i-from_pos-1)));
}
//---
for(j=0;j<=from_pos;j++)
{
if(ptn==1)
FlagH_Buffer[i-j-1]=a+b*j+diff/2;
else if(ptn==2)
PennantH_Buffer[i-j-1]=a+b*j+diff/2;
}
}
}
}
}
}
//--- return value of prev_calculated for next call
return(rates_total);
}
//+----------------------------------------------------+
//| Regression |
//+----------------------------------------------------+
bool calc_regression(double &a,double &b,int span,double &price[])
{
//---
double sumy=0.0; double sumx=0.0; double sumxy=0.0; double sumx2=0.0;
//---
int x;
int cnt=0;
for(x=0; x<span; x++)
{
//---
if(price[x]==0)continue;
sumx+=x;
sumx2+= x*x;
sumy += price[x];
sumxy+= price[x]*x;
cnt++;
}
//---
double c=sumx2*cnt-sumx*sumx;
if(c==0.0)return false;
b=(sumxy*cnt-sumx*sumy)/c;
a=(sumy-sumx*b)/cnt;
return true;
}
//+------------------------------------------------------------------+
Comments