HamyarTrend_Candles
Download script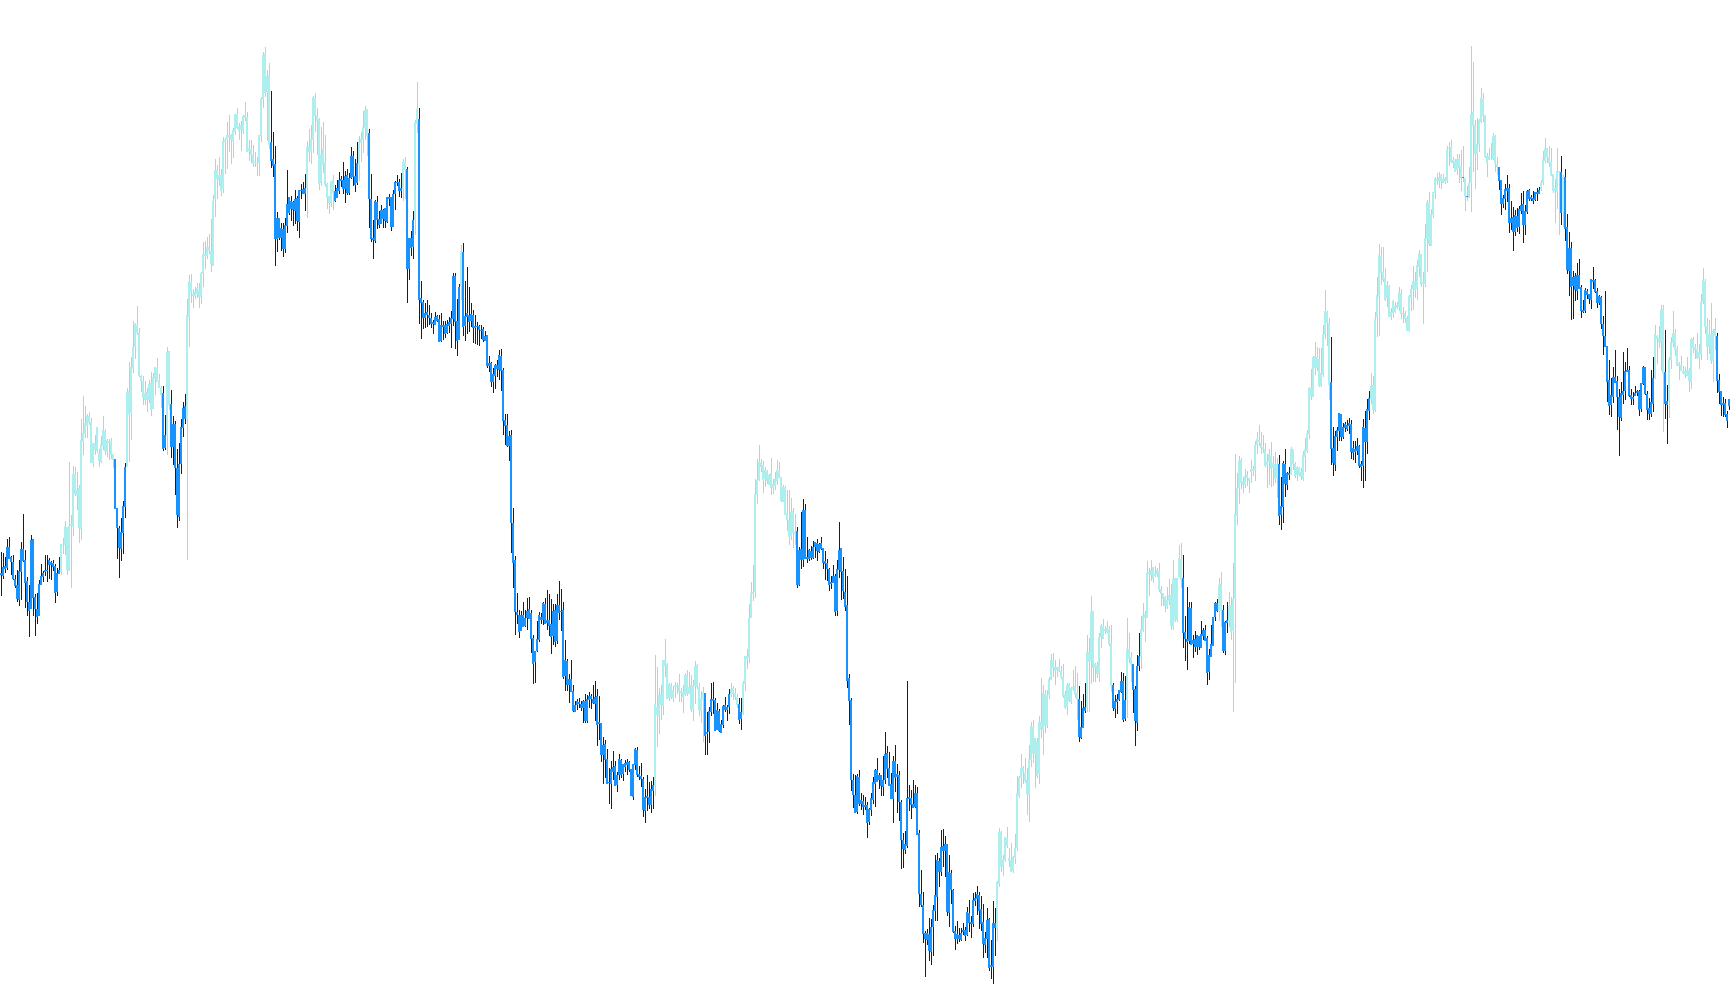
The HamyarTrend Candles script is a specialized visual tool designed to enhance the readability of price action on a trading chart. Rather than replacing standard price bars, it serves as an overlay that highlights specific trend signals by dynamically adjusting the appearance of candle "wicks" and "bodies."
Core Logic Overview
The primary function of this script is to identify specific conditions from an underlying trend analysis and translate those findings into a clear visual language. It looks for specific numerical triggers (signals) generated by a secondary logic layer to determine how each candle should be colored and displayed on your screen.
How It Works
- Trend Signal Detection: The script constantly monitors the market data over a defined historical period (defined by the "LoopBack" parameter). It communicates with a specialized trend calculation to see if specific conditions are met for each individual price bar.
- Dynamic Visual Mapping: When the underlying logic detects a significant signal, the script automatically modifies the visual properties of the candles. Specifically, it differentiates between the "wick" (the thin line showing the high/low range) and the "body" (the thick part showing the open/close price).
- Color-Coded Feedback: The tool uses two distinct colors—Royal Blue and Red—to differentiate between market movements. By changing the color of these components based on the trend signals, it provides a high-contrast visual map that helps traders quickly identify shifts in momentum or direction without needing to manually interpret complex data points.
- Customizable Display: The script allows for different thicknesses for wicks and bodies, ensuring that the most important visual information stands out clearly while maintaining a clean and professional aesthetic on the trading platform.
Summary for the User
In short, this script acts as a "visual translator." It takes complex trend data from the background and applies it directly onto your candles. When the market conditions match specific criteria, the candles change color to alert you to the current trend, making it easier to distinguish between different market phases at a glance.
//|                                            Hamyar.mq4            |
//|                                        Copyright © 2010, Farshad |
//|                                           http://www.vizhish.com |
//+------------------------------------------------------------------+
#property copyright "Copyright © 2010, Farshad Saremifar"
#property link      "farshad.saremifar@gmail.com"


//---- indicator settings
#property  indicator_chart_window

#property indicator_buffers 4
#property indicator_color1 RoyalBlue//wicks
#property indicator_color2 Red//wicks
#property indicator_color3 RoyalBlue
#property indicator_color4 Red

#property indicator_width1 1
#property indicator_width2 1
#property indicator_width3 3
#property indicator_width4 3
//MODE_SMA 0 Simple moving average,
//MODE_EMA 1 Exponential moving average,
//MODE_SMMA 2 Smoothed moving average,
//MODE_LWMA 3 Linear weighted moving average.

//PRICE_CLOSE 0 Close price.
//PRICE_OPEN 1 Open price.
//PRICE_HIGH 2 High price.
//PRICE_LOW 3 Low price.
//PRICE_MEDIAN 4 Median price, (high+low)/2.
//PRICE_TYPICAL 5 Typical price, (high+low+close)/3.
//PRICE_WEIGHTED 6 Weighted close price, (high+low+close+close)/4.


//---- indicator parameters
extern int LoopBack = 25;

extern string Setting="Candle Display Settings ";
int		BarWidth			= 1;
extern int					CandleWidth		= 3;


//---- indicator buffers
double Bar1[],
		 Bar2[],
		 Candle1[],
		 Candle2[],
		 Candle3[],
		 Candle4[],
		 Candle5[],
		 Candle6[];

//+------------------------------------------------------------------+
//| Custom indicator initialization function                         |
//+------------------------------------------------------------------+
int init()
  {


   IndicatorShortName("HamyarTrend Candles");
	IndicatorBuffers(4);

	SetIndexBuffer(0,Bar1);
	SetIndexBuffer(1,Bar2);
	SetIndexBuffer(2,Candle1);
	SetIndexBuffer(3,Candle2);

	SetIndexStyle(0,DRAW_HISTOGRAM,0,BarWidth);
	SetIndexStyle(1,DRAW_HISTOGRAM,0,BarWidth);
	SetIndexStyle(2,DRAW_HISTOGRAM,0,CandleWidth);
	SetIndexStyle(3,DRAW_HISTOGRAM,0,CandleWidth);


   return(0);
  }

  int deinit()
  {

//----
   return(0);
  }


     void SetCandleColor(int col, int i)
{
	double high,low,bodyHigh,bodyLow;


		bodyHigh = MathMax(Open[i],Close[i]);
		bodyLow  = MathMin(Open[i],Close[i]);
		high		= High[i];
		low		= Low[i];


	Bar1[i] = low;	Candle1[i] = bodyLow;
	Bar2[i] = low;	Candle2[i] = bodyLow;
	Bar1[i] = low;	Candle3[i] = bodyLow;
	Bar2[i] = low;	Candle4[i] = bodyLow;
	Bar1[i] = low;	Candle5[i] = bodyLow;
	Bar2[i] = low;	Candle6[i] = bodyLow;

	switch(col)
	{
		case 1: 	Bar1[i] = high;	Candle1[i] = bodyHigh;	break;
		case 2: 	Bar2[i] = high;	Candle2[i] = bodyHigh;	break;
		case 3: 	Bar1[i] = high;	Candle3[i] = bodyHigh;	break;
		case 4: 	Bar2[i] = high;	Candle4[i] = bodyHigh;	break;
		case 5: 	Bar1[i] = high;	Candle5[i] = bodyHigh;	break;
		case 6: 	Bar2[i] = high;	Candle6[i] = bodyHigh;	break;
	}
}


   int start()
{
	for(int i = MathMax(Bars-1-IndicatorCounted(),1); i>=0; i--)
	{


		if(iCustom(NULL,0,"HamyarTrend",LoopBack,0,i)==10)	SetCandleColor(1,i);
	   else	if(iCustom(NULL,0,"HamyarTrend",LoopBack,1,i)==10) SetCandleColor(2,i);


  }

   return(0);
  }
Comments