Candle_Direction
Indicator

Candle_Direction

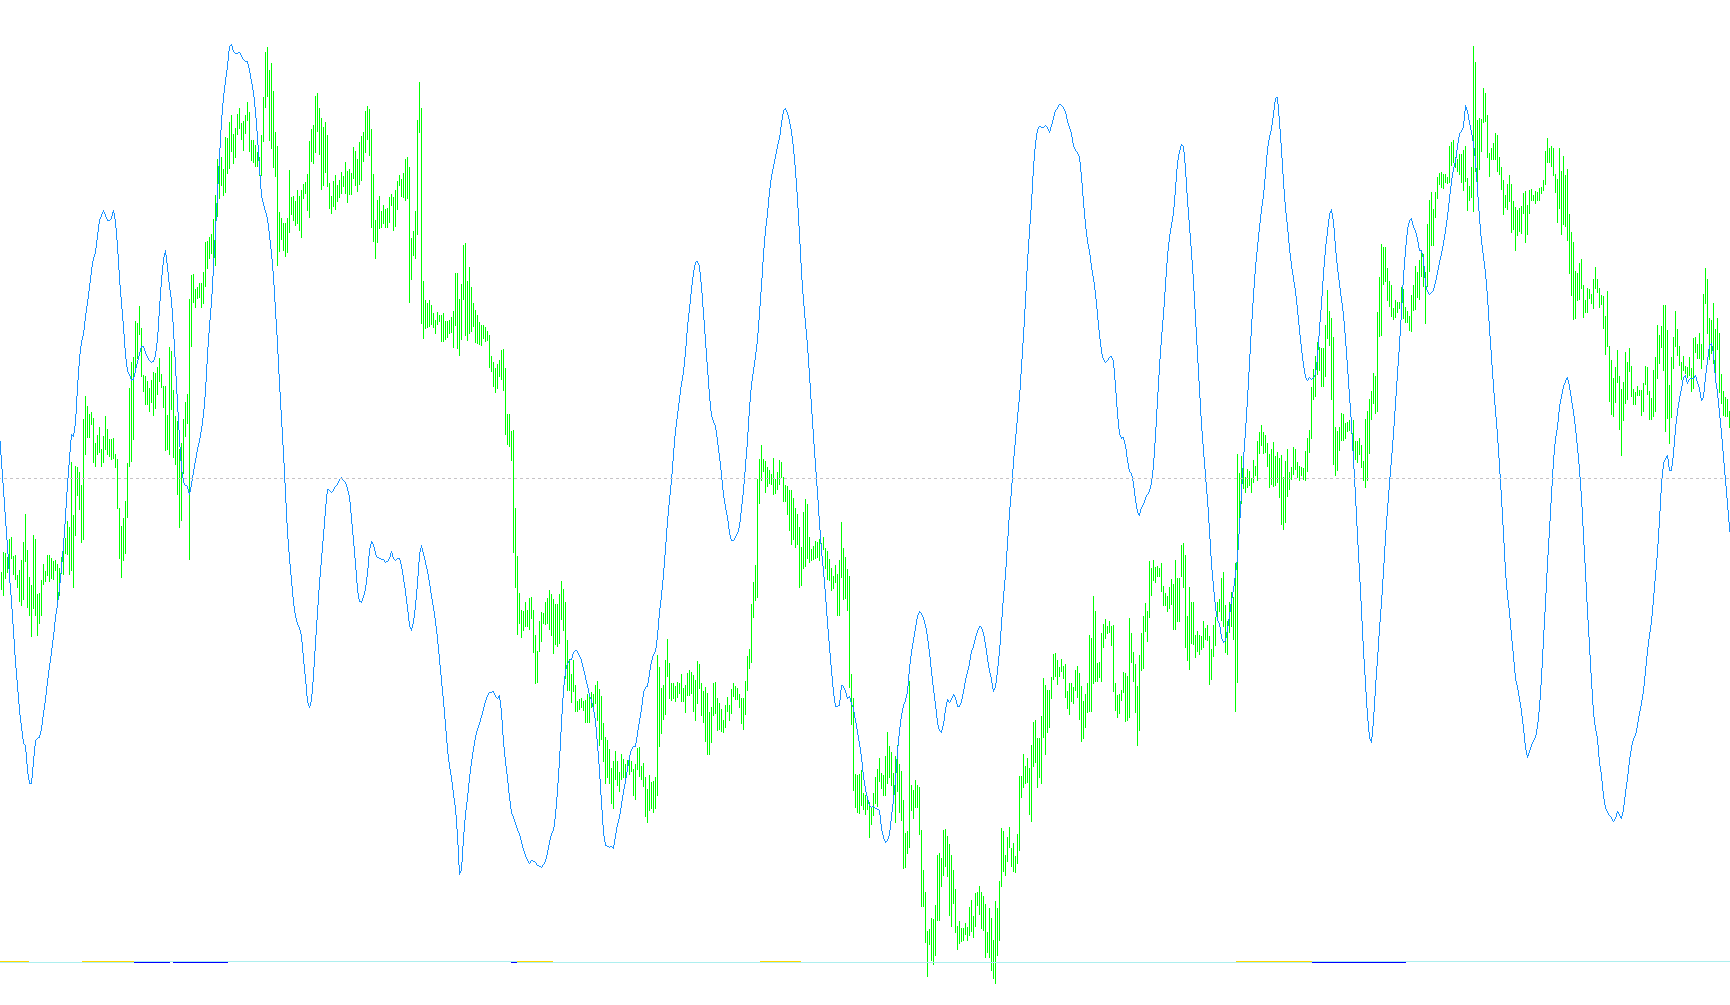
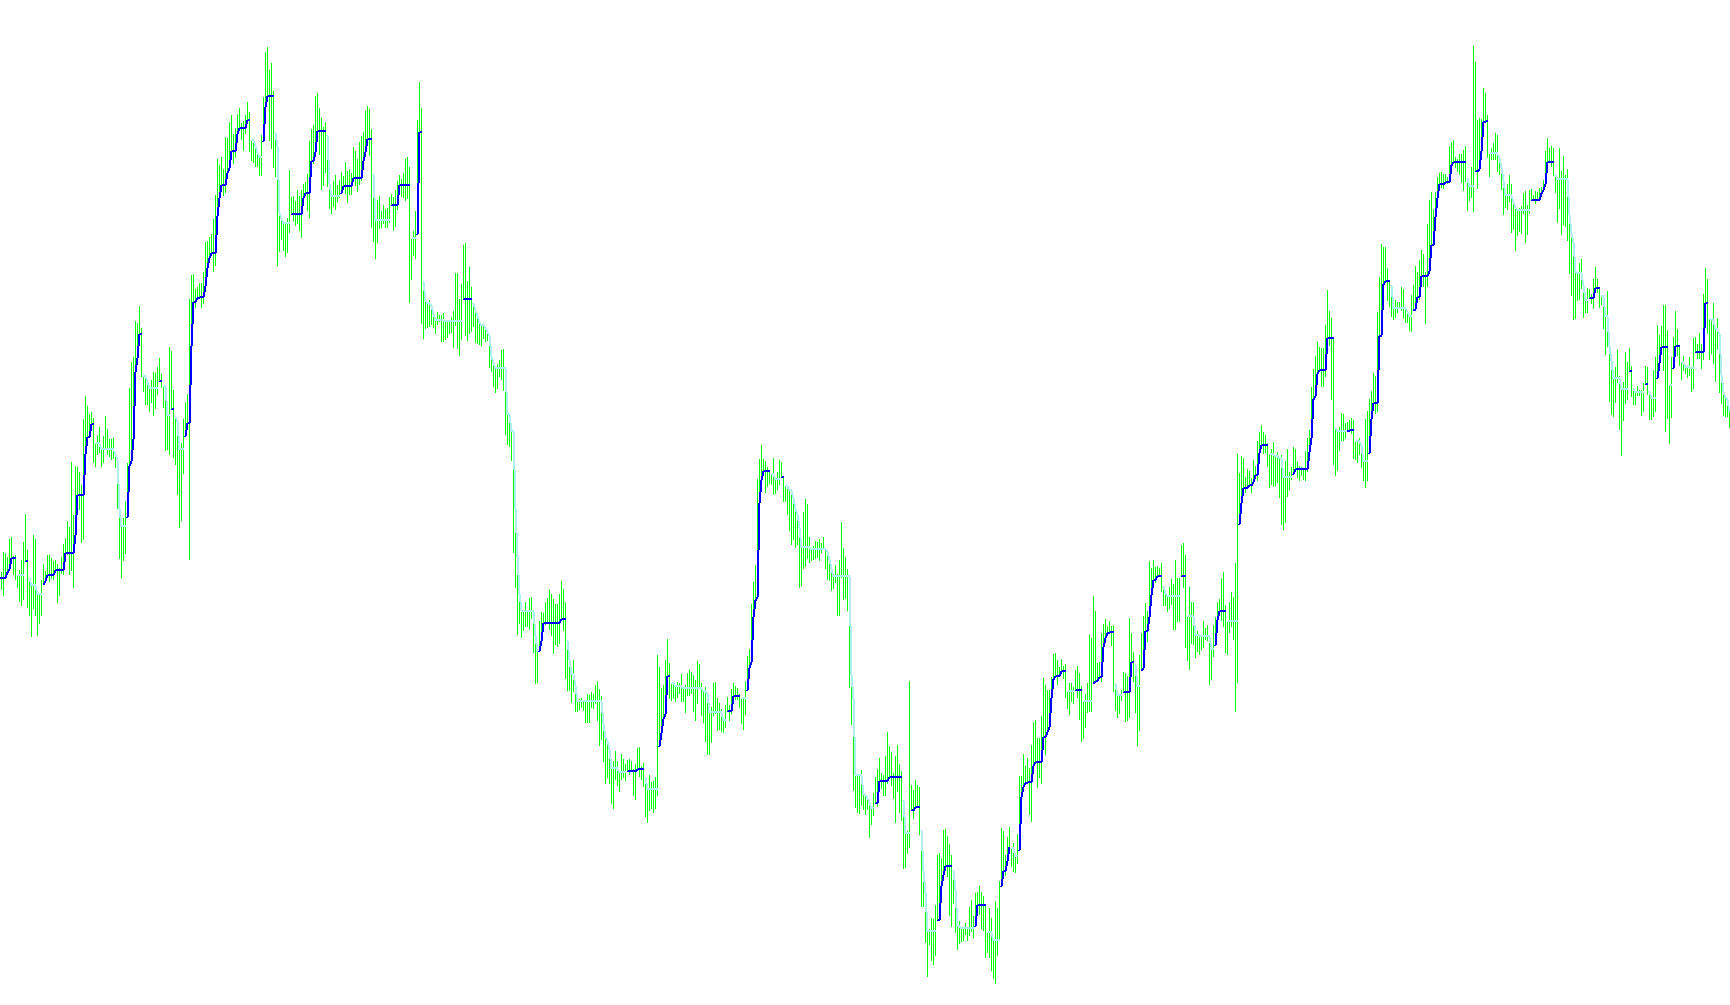
This indicator visualizes real-time price action polarity across nine distinct timeframes by comparing current candle closing prices against their respective opening values.

candle_snr
Indicator

candle_snr

This indicator maps historical price extremes and session boundaries across high-period timeframes to visualize structural supply and demand zones.

candle_time_end_and_spread
Indicator

candle_time_end_and_spread

This indicator dynamically calculates and displays the remaining countdown until the next candle transition alongside real-time market liquidity spread variance.

CatBarColor
Indicator

CatBarColor

iMA

This indicator visually distinguishes price action by highlighting bars that trade entirely above or below a 50-period Exponential Moving Average.

caterpillar
Indicator

caterpillar

This indicator utilizes an external DLL to perform SVD matrix decomposition on price midpoints, projecting two distinct smoothing curves derived from singular value analysis.

cauchy_derivative
Indicator

cauchy_derivative

This indicator calculates the first-order derivative of the difference between the arithmetic mean and geometric mean of price values to detect momentum shifts.

cauchy_difference
Indicator

cauchy_difference

This indicator quantifies the variance between the arithmetic mean and the geometric mean of price action to identify subtle structural shifts in market equilibrium.

cci_filter
Indicator

cci_filter

iCCIiMAOnArray

This indicator applies a Smoothed Moving Average to the Commodity Channel Index to isolate long-term momentum trends and filter out market noise.

cci_on_stepchannel
Indicator

cci_on_stepchannel

iStdDev

This indicator calculates a customized Commodity Channel Index by mapping price action against a dynamic volatility-adjusted step channel that filters noise using smoothed standard deviations.

cci_with_arrow
Indicator

cci_with_arrow

iCCI

This indicator identifies directional trend shifts by detecting local extrema within the Commodity Channel Index (CCI) bounds of 100 and -100.

cctimex
Indicator

cctimex

This indicator displays the current server time alongside real-time countdowns for multiple user-defined trading periods simultaneously.

cdrvolatility
Indicator

cdrvolatility

iMAOnArray

This indicator quantifies market momentum by calculating the SMA of price deviations from a specific opening reference point, distinguishing between expansionary and contractionary movement relative to a user-defined delta threshold.

cek_op
Indicator

cek_op

This indicator projects active trade entries, exit targets, and historical price action trajectories onto the chart using dynamic visual markers and trendlines.

Indicator

CentreOfGravityV2

iStdDev
chainpricersi
Indicator

chainpricersi

iMAiRSI

This indicator identifies directional entry points by correlating RSI smoothed moving averages with weighted price momentum shifts.

chanel_scalper
Indicator

chanel_scalper

iATRiMA

The logic identifies structural shifts by monitoring price breaches of mid-point ranges expanded by Average True Range volatility factors.

Change
Indicator

Change

Visualizes the relative price variance expressed as a percentage shift between consecutive closing ticks.

Channel ZZ_v2_en
Indicator

Channel ZZ_v2_en

This indicator identifies market structure by tracking price extremes and projecting a fixed-width linear corridor that shifts direction based on breakout threshold violations.

ChannelBalance
Indicator

ChannelBalance

This indicator quantifies the relative position of price action within a dynamic volatility range to measure directional momentum towards extreme boundaries.

channelsfibo_ad
Indicator

channelsfibo_ad

iMA

This indicator projects Fibonacci-based price boundaries derived from the maximum historical volatility between price action and a moving average.

channelsfibo_mtf_ad
Indicator

channelsfibo_mtf_ad

iMA

This indicator dynamically constructs a multi-timeframe price corridor by projecting Fibonacci retracement levels from the maximum historical deviation between price and a moving average.

channelsfibo_v2_ad
Indicator

channelsfibo_v2_ad

iMA

This indicator generates a multi-layered price channel by calculating the statistical deviation or distance between current price action and a moving average to project Fibonacci-based expansion zones.

channelsfibo_v2_mtf_ad
Indicator

channelsfibo_v2_mtf_ad

iMA

This indicator generates a dynamic trading channel by calculating the maximum price deviation from a moving average and projecting customized Fibonacci levels across multiple timeframes.

Indicator

Chart_on_other_chart

CheckMarkPattern_AD
Indicator

CheckMarkPattern_AD

iMACDiMomentumiRVIiRSI

This indicator identifies bullish and bearish patterns by detecting inverse price-to-oscillator extremums across multiple technical metrics.

CheckPower
Indicator

CheckPower

iBearsPoweriBullsPower

The indicator identifies reversal opportunities by scanning historical price action to detect when cumulative bullish or bearish forces exceed their opposing momentum thresholds.

ClearMethod
Indicator

ClearMethod

This indicator identifies trend persistence by tracking consecutive price swings and mapping the relative highs and lows to define directional momentum.

ClearMethodCandles1
Indicator

ClearMethodCandles1

This indicator renders dynamic candle shapes that isolate price swings by mapping high-low volatility and directionality onto a line chart.

ClearMethodCandles2
Indicator

ClearMethodCandles2

This indicator identifies and highlights directional price swings by rendering distinct color-coded histograms that represent bullish and bearish momentum flows.

ClearMethodHistogram
Indicator

ClearMethodHistogram

The indicator quantifies the price variance from dynamic switching boundaries to visualize market momentum relative to structural transition points.

ClearMethodSignals
Indicator

ClearMethodSignals

This indicator identifies significant directional shifts by detecting breaches of the Clear Line and subsequent trend re-accelerations following period stabilization.

Indicator

clockanalog

Close-Low
Indicator

Close-Low

iMA

This indicator calculates a relative distance metric by dividing the current candle's high by the low price from a fixed historical offset.

Indicator

CloseAllAdvanced

closeallbuttons
Indicator

closeallbuttons

A GUI-based dashboard providing one-click execution to selectively purge pending buy stops, sell stops, or flush all active market positions and limit orders.

CloseAllPendingAdvanced
Indicator

CloseAllPendingAdvanced

This script systematically identifies and removes specific pending buy and sell orders based on user-defined magic numbers, symbols, and order types.

closed_loss
Indicator

closed_loss

This script systematically liquidates specific open positions based on predefined profit thresholds, magic numbers, and currency pairs to execute rapid portfolio filtering.

closed_total
Indicator

closed_total

Executes targeted position termination based on specific magic numbers, asset symbols, and profit/loss thresholds.

closed_win
Indicator

closed_win

An automated script designed to filter and systematically liquidate active market positions based on specific profit status, magic numbers, and asset identifiers.

CloseOrders_v1-0
Indicator

CloseOrders_v1-0

This utility performs automated position liquidation based on granular filters such as profitability, specific magic numbers, asset symbols, and custom textual comments.

close_-_ema_20
Indicator

close_-_ema_20

iMA

This indicator projects exponential moving averages from multiple timeframes onto the current chart, dynamically changing colors based on price position relative to each level.

clusterbox_ad
Indicator

clusterbox_ad

This indicator quantifies and visualizes price-action density by aggregating tick data into discrete volume clusters across historical and real-time candlesticks.

clusterbox_dayhistogramm_ad
Indicator

clusterbox_dayhistogramm_ad

This indicator aggregates tick-by-tick data into price clusters and visualizes the daily volume distribution using a multi-colored histogram that also maps bullish and bearish price deltas.

clusterbox_histogramm_ad
Indicator

clusterbox_histogramm_ad

This indicator aggregates tick data into price clusters to visualize historical volume concentration and bidirectional delta distribution via a dynamic histogram.

cm_ind_level_cndl
Indicator

cm_ind_level_cndl

The algorithm identifies consecutive price consolidation points by scanning for sequential candles where the high or low remains strictly contained within a specific range to project trend lines.

cm_orders_profit_info
Indicator

cm_orders_profit_info

This indicator scans active trade positions for the current symbol and renders dynamic text labels on the chart displaying real-time profit figures and magic numbers.

cm_trend_info
Indicator

cm_trend_info

Automatically detects trendline objects on the chart and renders real-time text labels displaying the precise point difference between their endpoints.

Indicator

COGMACD

iMACDiStdDevOnArray
Indicator

COGSTOCH

iStdDevOnArrayiStochastic
Coloured Woodies CCI
Indicator

Coloured Woodies CCI

iCCI

This indicator identifies momentum shifts by calculating the differential between fast and slow Commodity Channel Index values, employing a neutral zone buffer to filter out minor price fluctuations.