Grucha_percentage_Index_V2
Download script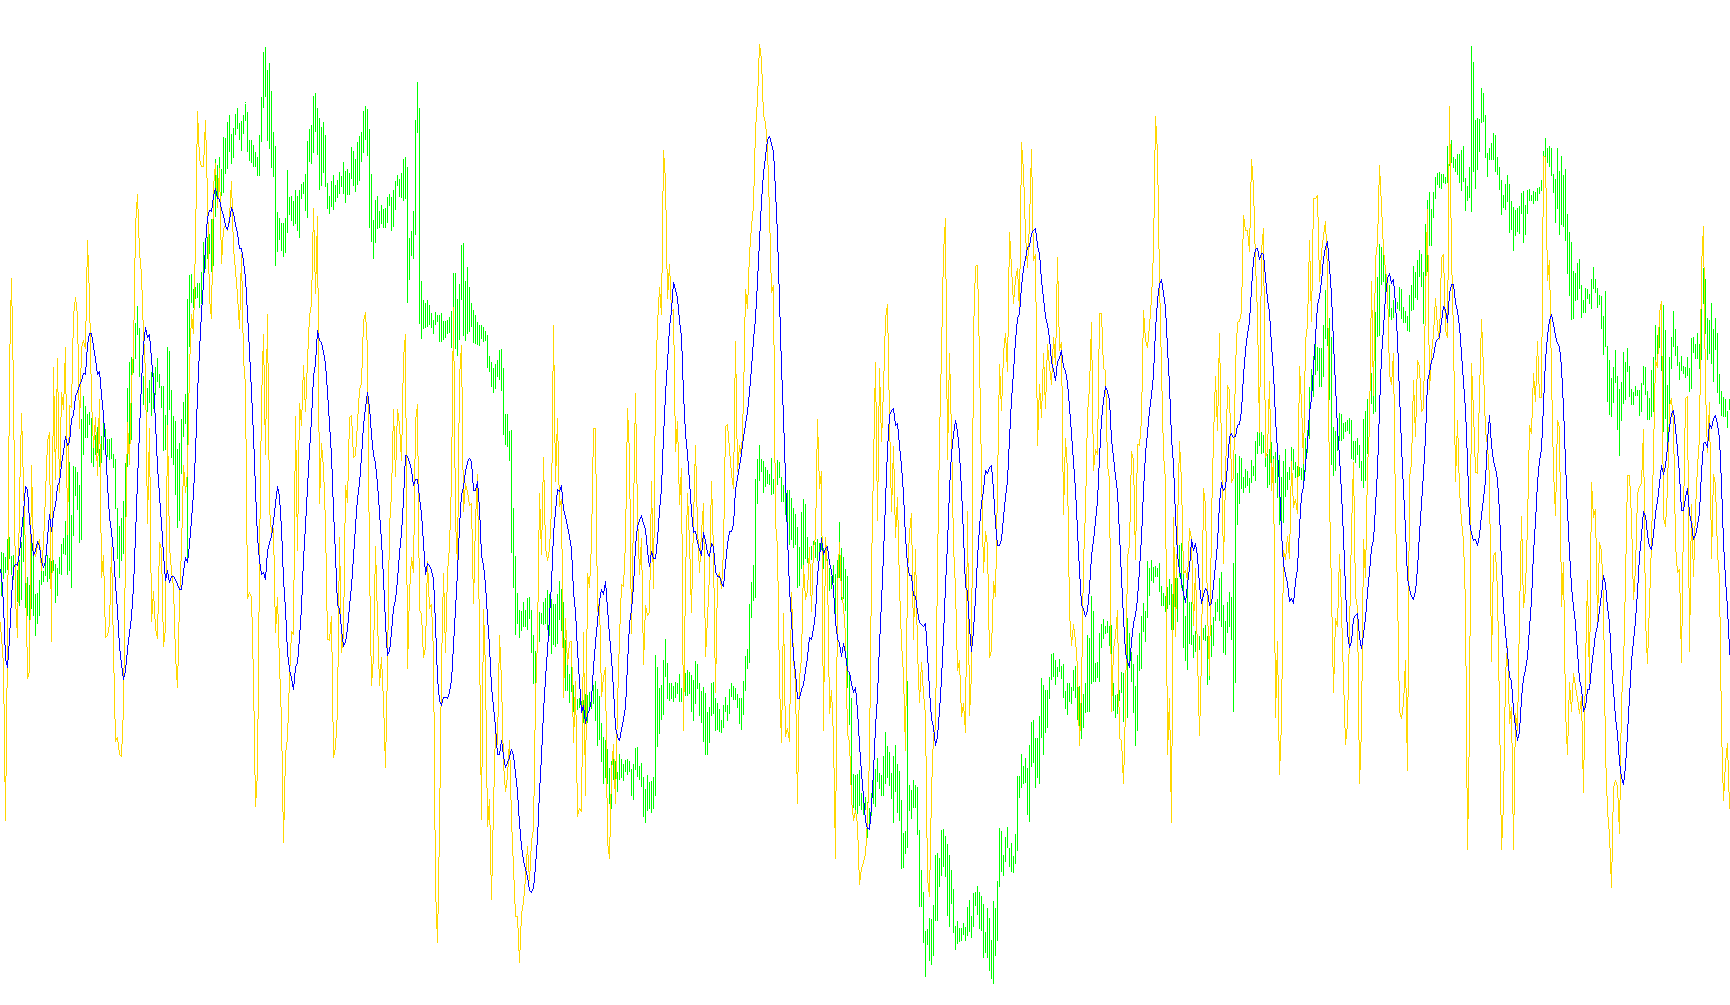
The Grucha Index is a custom technical analysis tool designed to measure the relative momentum and direction of price movements over a specific period. Rather than simply looking at whether the price went up or down, this indicator quantifies the "intensity" of those movements to provide a clearer picture of market sentiment.
Core Logic and Methodology
The script operates by analyzing price candles one by one and categorizing them based on their directional movement:
1. Price Movement Calculation The tool first calculates the difference between the opening and closing prices of every candle. It distinguishes between "upward" movements (where the price closed higher than it opened) and "downward" movements (where the price closed lower).
2. Grouping and Summation Instead of just counting how many candles were green or red, the logic groups these movements into two categories over a user-defined timeframe:
- Upward Strength: It captures the magnitude of all upward movements during the period.
- Downward Strength: It captures the magnitude of all downward movements during the same period.
3. The Index Calculation The indicator then performs a mathematical comparison between these two strengths. It calculates what percentage of the total price movement was driven by upward momentum relative to the total combined movement (up and down).
- If the market is dominated by strong upward moves, the index reflects this dominance as a higher percentage.
- If the downward moves are more aggressive, the index value adjusts accordingly.
- The result is displayed as a percentage on a separate window, allowing you to see the "balance of power" at any given moment.
4. Smoothing (Moving Average) To make the data easier to read and filter out "noise" or erratic price spikes, the script includes a secondary calculation. It applies a Moving Average to the Grucha Index itself. This produces a smoother line that helps traders identify overarching trends more clearly without getting distracted by minor, short-term fluctuations.
Summary for the User
In simple terms, the Grucha Index tells you "How much of the recent price action was actually driven by buyers versus sellers?" By looking at the relationship between the main index line and its smoothed average, users can better visualize whether the current market momentum is strengthening, weakening, or shifting direction.
//+------------------------------------------------------------------+
//|                                                 Grucha Index.mq4 |
//|                                                   gaa1@poczta.fm |
//|                                                                  |
//+------------------------------------------------------------------+
#property copyright "Grzegorz Antosiewicz"
#property link      "gaa1@poczta.fm "

#property indicator_separate_window
#property indicator_buffers 2
#property indicator_color1 Red
#property indicator_color2 Blue

#property indicator_minimum 0
#property indicator_maximum 100
//---- buffers
double ExtMapBuffer1[];
double tab[];
double srednia[];
double dResult, gora,dol, suma,close,open,wynik;


extern int Okresy= 10 ;
extern int MA_Okresy= 10 ;

int init()
  {
  IndicatorBuffers(3);
//---- indicators
   SetIndexStyle(0,DRAW_LINE);
   SetIndexBuffer(0,ExtMapBuffer1);
   SetIndexStyle(1,DRAW_LINE);
   SetIndexLabel(0,"Grucha % Index");
   SetIndexLabel(1,"Ma of Grucha % Index");
   SetIndexBuffer(1,srednia);
   SetIndexBuffer(2,tab);
   SetIndexDrawBegin(0, Okresy);


//----
   return(1);
  }

int start()
  {
 Comment("\nIf you need MQL CODER quote to AUTOR."
  +"\n\n- polish student of computer since with big experience in mql"+" \n"+
 "\n                                     mail to:\n\n>>>>>>>>>>>>   gaa1@poczta.fm    <<<<<<<<<<< "
 +"\n\nLOW PRICE and HIGH QUAILTY"
 );


   int    counted_bars=IndicatorCounted();

//---- check for possible errors
   if (counted_bars<0) return(-1);
//---- last counted bar will be recounted
   if (counted_bars>0) counted_bars--;

   int   pos=Bars-counted_bars;


//---- g³ówna pêtla
   while(pos>=0)
{
      close= Close[pos];
      open = Open[pos];

      dResult = open - close ;                          //wartos swiecy do zmiennej
      tab[pos]= dResult; //przypisuje wartosc do tablicy


      if(Bars-pos > (Okresy-1) )             //sprawdzam czy istnieje n elemntowa tablica
  {
      gora = 0;
      dol  = 0;
      for(int l = pos + (Okresy-1); l>=pos; l--)      //odliczam n okresow
     {
      if(tab[l]<0)
      {
      gora += tab[l];
      }                    //sumuje wartosci ze wzrostowych slupkow  do gora
      else if(tab[l]>=0)
      {
      dol -= tab[l]
      ;
      }

     }
      if(dol<=0)
      {dol = dol*(-1);}
      if(gora<=0)
      {gora = gora*(-1);}
      suma = dol + gora ; // sumuje wartosci wszytkich slupkow

      if(suma == 0)
      {wynik = 0;
      //Print("Suma = 0");
      }
  }


        if(suma >0)
      {
         wynik =
         ( (gora / suma) *100
         );
      }
         else
        {
        wynik = 0 ;
        }


         ExtMapBuffer1[pos]= wynik ;
         pos--;

    //Comment(dol,"dol",gora,"gora" );
     }

   int   index=Bars-MA_Okresy;

    while(index>=0)
 {
    srednia[index]=iMAOnArray(ExtMapBuffer1,0,MA_Okresy,0,0,index);

   //Comment(tab2[index],"srednia->",srednia[index]);
   index--;

 }

   return(0);
  }
//+------------------------------------------------------------------+
Comments