FractalSupportResistance
Download script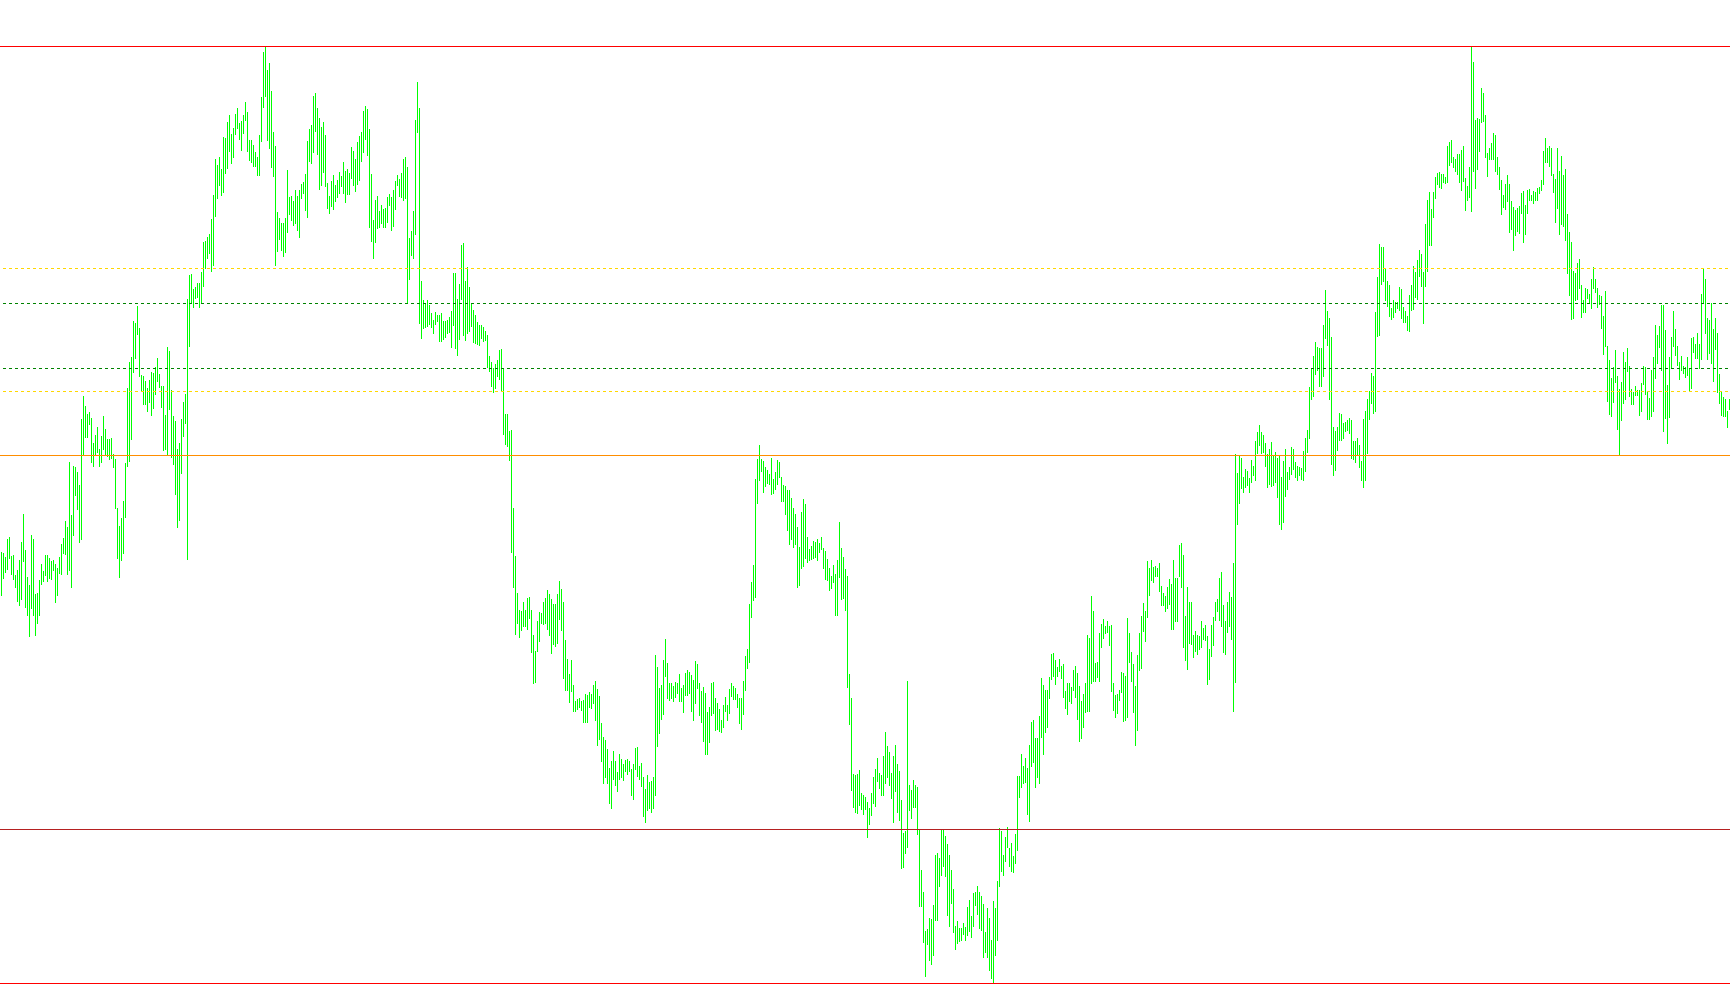
This tool is designed to automatically identify and display key price levels on your trading chart, specifically focusing on "Fractal" support and resistance. By analyzing historical price action across multiple timeframes simultaneously, it helps traders visualize where the market has historically struggled to break through (resistance) or fell below (support).
How the Logic Works
Multi-Timeframe Analysis The script doesn't just look at your current chart; it scans five specific timeframes: 1-hour, 4-hour, Daily, Weekly, and Monthly. This allows you to see "big picture" price levels while trading on smaller intervals, providing a clearer sense of the market's overall structure.
Fractal Identification The core logic relies on identifying "Fractals." A fractal is a specific price point where the high or low of a candle is higher (for resistance) or lower (for support) than the two candles immediately before it and the two candles immediately after it. Essentially, the tool looks for "peaks" and "valleys" in the market history.
Dynamic Mapping Once the script identifies these peaks and valleys across different timeframes, it performs the following actions:
- Resistance Drawing: It places a horizontal line at the highest point of a confirmed peak. These lines represent areas where selling pressure has historically been strongest.
- Support Drawing: It places a horizontal line at the lowest point of a confirmed valley. These lines represent areas where buying interest has historically been highest.
Visual Organization To keep your chart clean and easy to read, the tool assigns unique colors and line styles to each timeframe. For example, different timeframes will have distinct visual identities (such as solid lines vs. dotted lines), allowing you to instantly distinguish between a short-term daily resistance level and a major long-term monthly one.
Automated Management The script is designed to be "hands-off." It automatically refreshes these levels as new data comes in and ensures that the chart remains organized by naming each line according to its specific timeframe (e.g., "resistanceH1" or "supportD1"). When you remove the tool, it also includes a cleanup routine to clear these lines from your chart automatically.
#property copyright "Alexander Elgin"
#property link      "alexmost113@mail.ru"
#property indicator_chart_window

#property indicator_color1 Green
#property indicator_color2 Gold
#property indicator_color3 DarkOrange
#property indicator_color4 Red
#property indicator_color5 FireBrick

#property indicator_style1 STYLE_DOT
#property indicator_style2 STYLE_DOT
#property indicator_style3 STYLE_SOLID
#property indicator_style4 STYLE_SOLID
#property indicator_style5 STYLE_SOLID

#define PERIODS_NUMBER 5
#define INDICATOR_NAME "Fractal Support Resistance"
#define SUPPORT "support"
#define RESISTANCE "resistance"
#define BAR_TO_START_SCAN_FROM 2

int timeframes[PERIODS_NUMBER] = {PERIOD_H1, PERIOD_H4, PERIOD_D1, PERIOD_W1, PERIOD_MN1};
int styles[PERIODS_NUMBER] = {indicator_style1, indicator_style2, indicator_style3, indicator_style4, indicator_style5};
color colors[PERIODS_NUMBER] = {indicator_color1, indicator_color2, indicator_color3, indicator_color4, indicator_color5};

int init() {
	IndicatorShortName(INDICATOR_NAME);
	return(0);
}

int deinit() {
	string object_types[2] = {SUPPORT, RESISTANCE};

	for(int timeframe_index = 0; timeframe_index < ArraySize(timeframes); timeframe_index++)
		for(int object_type_index = 0; object_type_index < ArraySize(object_types); object_type_index++)
			ObjectDelete(getTrendLineName(object_types[object_type_index], timeframes[timeframe_index]));

	return(0);
}

int start() {
	for(int timeframe_index = 0; timeframe_index < ArraySize(timeframes); timeframe_index++) {
		if(Period() <= timeframes[timeframe_index]) {
			drawResistance(getUpperFractalBar(timeframes[timeframe_index], BAR_TO_START_SCAN_FROM), timeframe_index);
			drawSupport(getLowerFractalBar(timeframes[timeframe_index], BAR_TO_START_SCAN_FROM), timeframe_index);
		}
	}
	return(0);
}

int getUpperFractalBar(int timeframe, int starting_bar) {
	for(int bar = starting_bar; bar < Bars; bar++)
		if(isUpperFractal(timeframe, bar)) return(bar);
	return (-1);
}

bool isUpperFractal(int timeframe, int bar) {
	for(int offset = -2; offset <= 2; offset++)
		if( (offset != 0) && (iHigh(Symbol(), timeframe, bar + offset) > iHigh(Symbol(), timeframe, bar)) ) return(false);
	return (true);
}

int getLowerFractalBar(int timeframe, int starting_bar) {
	for(int bar = starting_bar; bar < Bars; bar++)
		if(isLowerFractal(timeframe, bar)) return(bar);
	return (-1);
}

bool isLowerFractal(int timeframe, int bar) {
	for(int offset = -2; offset <= 2; offset++)
		if( (offset != 0) && (iLow(Symbol(), timeframe, bar + offset) < iLow(Symbol(), timeframe, bar)) ) return(false);
	return (true);
}

void drawResistance(int bar_index, int timeframe_index) {
	if(bar_index > 0) drawTrendLine(getTrendLineName(RESISTANCE, timeframes[timeframe_index]), iHigh(Symbol(), timeframes[timeframe_index], bar_index), colors[timeframe_index], styles[timeframe_index]);
}

void drawSupport(int bar_index, int timeframe_index) {
	if(bar_index > 0) drawTrendLine(getTrendLineName(SUPPORT, timeframes[timeframe_index]), iLow(Symbol(), timeframes[timeframe_index], bar_index), colors[timeframe_index], styles[timeframe_index]);
}

void drawTrendLine(string object_name, double price, color line_color, int line_style) {
	ObjectDelete(object_name);
	ObjectCreate(object_name, OBJ_HLINE, 0, Time[0], price, Time[Bars - 1], price);
	ObjectSet(object_name, OBJPROP_COLOR, line_color);
	ObjectSet(object_name, OBJPROP_STYLE, line_style);
}

string getTrendLineName(string object_type, int timeframe) {
	return(object_type + getTimeframeName(timeframe));
}

string getTimeframeName(int timeframe) {
	static int timeframe_periods[] = {PERIOD_M1, PERIOD_M5, PERIOD_M15, PERIOD_M30, PERIOD_H1, PERIOD_H4, PERIOD_D1, PERIOD_W1, PERIOD_MN1};
	static string timeframe_names[] = {"M1", "M5", "M15", "M30", "H1", "H4", "D1", "W1", "MN1"};

	for(int i = 0; i < ArraySize(timeframe_periods); i++)
		if(timeframe == timeframe_periods[i]) return (timeframe_names[i]);

	return("Unknown");
}
Comments