VolatilityIndicator
Download script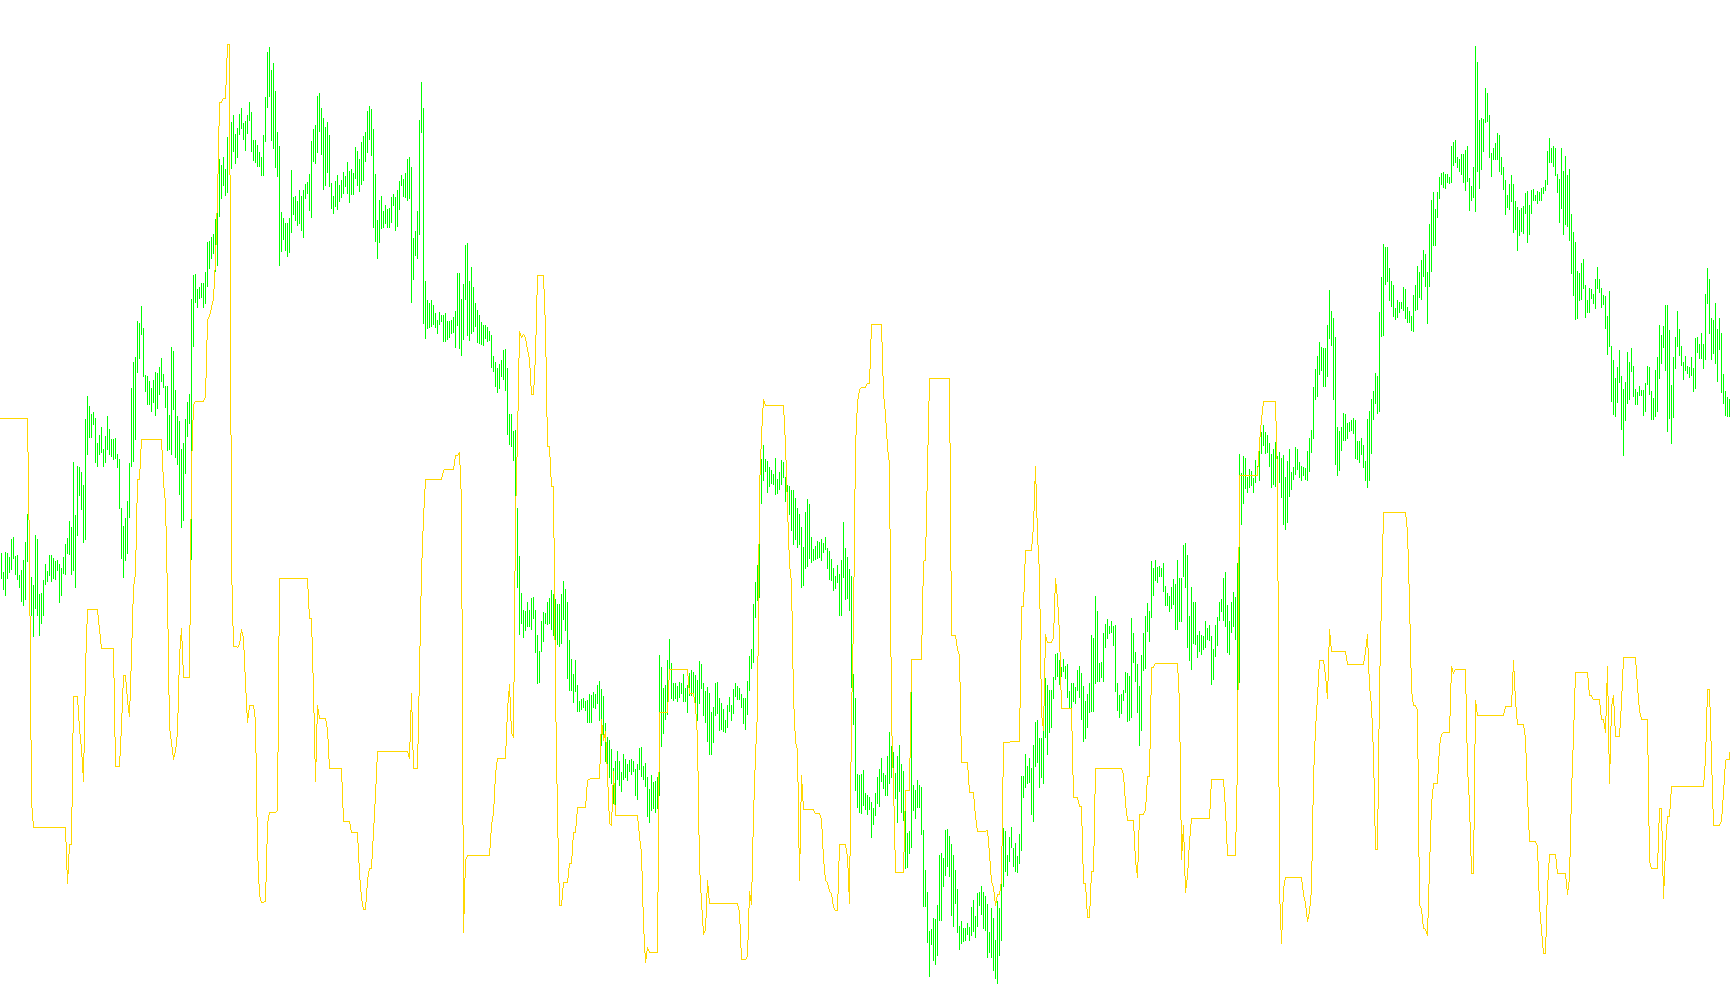
This tool is designed to provide a visual representation of market volatility by measuring the price range over a specific period. Instead of looking at standard price movements, it focuses on the distance between the highest and lowest points reached during a defined timeframe.
How the Logic Works
The script functions by scanning the history of the market to identify two key extremes:
- The Peak: It identifies the highest price reached within a user-defined number of bars (the "lookback" period).
- The Valley: It identifies the lowest price reached within that same timeframe.
By calculating the difference between these two points, the script determines the total "swing" of the market. It then converts this distance into a numerical value based on the smallest price movements possible for the specific asset being traded.
Visual Representation
The result is displayed in a separate window beneath your main trading chart as a continuous line.
- When the line is high: It indicates that the market experienced significant volatility or a wide price swing during that period.
- When the line is low: It suggests that the market was relatively stable, with prices staying within a tight range.
Key Customization
The tool features a primary setting that allows you to adjust the "lookback" period. By changing this number, you can decide whether you want the indicator to reflect short-term price swings (a smaller number of bars) or broader, long-term market trends (a larger number of bars).
//+------------------------------------------------------------------+
//|                                                           Vo.mq4 |
//|                                                           Krokus |
//|                                                                  |
//+------------------------------------------------------------------+
#property copyright "Krokus"
#property link      ""
//----
#property indicator_separate_window
#property indicator_buffers 1
#property indicator_color1 Red
//----
extern int       N=20; // ïåðèîä êàíàëà
//---- buffers
double ExtMapBuffer1[];
//+------------------------------------------------------------------+
//| Custom indicator initialization function                         |
//+------------------------------------------------------------------+
int init()
  {
//---- indicators
   SetIndexStyle(0,DRAW_LINE);
   SetIndexBuffer(0,ExtMapBuffer1);
//----
   return(0);
  }
//+------------------------------------------------------------------+
//| Custom indicator deinitialization function                       |
//+------------------------------------------------------------------+
int deinit()
  {
//----
//----
   return(0);
  }
//+------------------------------------------------------------------+
//| Custom indicator iteration function                              |
//+------------------------------------------------------------------+
int start()
  {
   int    counted_bars=IndicatorCounted();
   int limit;
   double upPrice,downPrice;
//----
   if (counted_bars==0) limit=Bars-N;
   if (counted_bars>=0) limit=Bars-counted_bars;
   limit--;
   for(int i=limit;i>=0;i--)
     {
      upPrice=High[iHighest(Symbol(),0,MODE_HIGH,N,i)];//ìàêñèìóì çà N áàðîâ
      downPrice=Low[iLowest(Symbol(),0,MODE_LOW,N,i)]; //ìèíèìóì çà N áàðîâ
      ExtMapBuffer1[i]=(upPrice-downPrice)/Point;

     }
//----
   return(0);
  }
//+------------------------------------------------------------------+
Comments