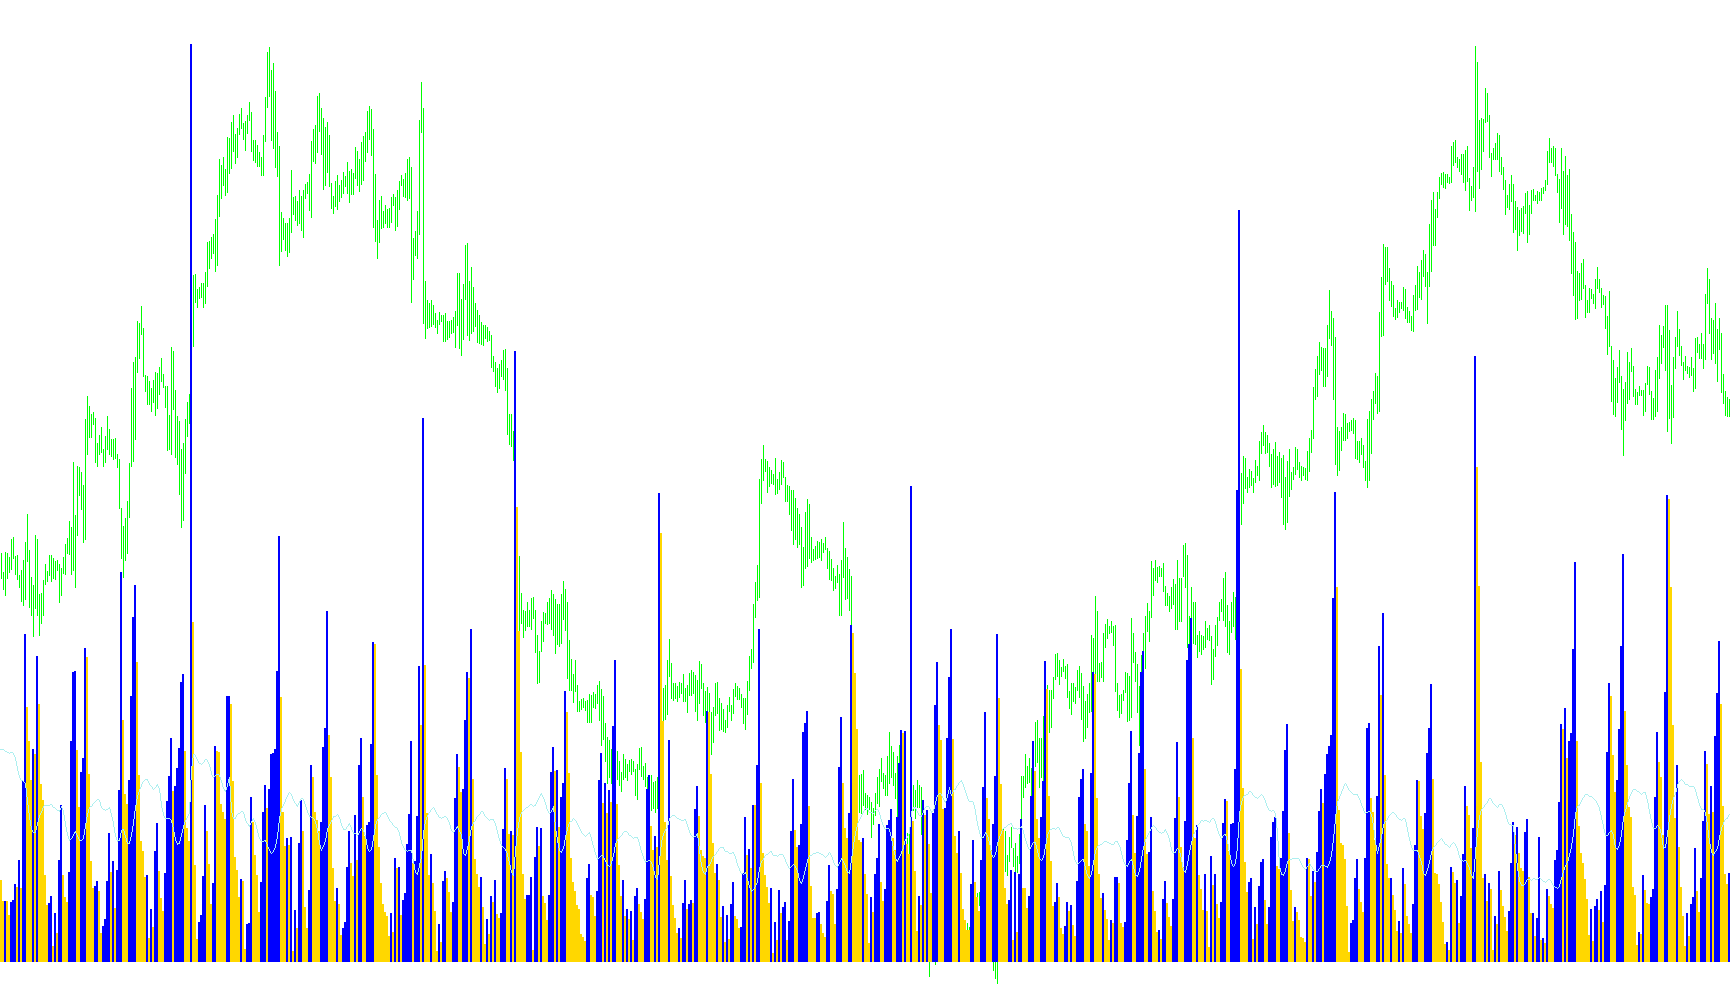
This tool is designed to help traders visualize and interpret trading volume through a combination of dynamic color-coding and customizable mathematical averages. By analyzing how volume fluctuates over time, it provides a clearer picture of market activity than standard volume bars alone.
Visual Layout
The script creates a dedicated window beneath your main price chart featuring three distinct visual elements:
- Red Histogram Bars: Represent instances where trading volume is decreasing compared to the previous period.
- Green Histogram Bars: Represent instances where trading volume is increasing compared to the previous period.
- Continuous Line: A smoothing line that tracks the overall trend of the volume across a set timeframe.
Core Logic and Features
1. Volume Trend Analysis (Color Coding)
The primary logic of the script revolves around comparing the current volume to the immediate past.
- If the volume of the current bar is higher than the previous one, the script highlights it in Green, signaling an expansion in activity.
- If the volume drops compared to the previous bar, it highlights it in Red, signaling a contraction.
- In cases where the volume remains unchanged, the script intelligently retains the color of the previous state to ensure a smooth visual flow without "flickering."
2. Customizable Moving Averages
To help filter out "noise" and identify the broader trend of trading activity, the script includes a Moving Average (MA) line. You can choose from four different mathematical methods to calculate this line, depending on how much weight you want to give to recent data:
- Simple Moving Average (SMA): Provides a straightforward average of volume over a set number of periods.
- Exponential Moving Average (EMA): Places more significance on the most recent volume data, making it more responsive to sudden market shifts.
- Smoothed Moving Average (SMMA): Offers a "flatter," more stabilized view of the trend by distributing weight evenly over time.
- Linear Weighted Moving Average (LWMA): Similar to the SMA but applies a linear weight to the data, emphasizing the most recent price action.
Summary for the User
Essentially, this script acts as a "momentum heat map" for trading volume. While the colored bars tell you the immediate "pulse" of the market (is activity speeding up or slowing down right now?), the moving average line tells you what the general trend of that activity looks like over a longer period. By using these together, traders can better identify whether a move in price is being backed by significant volume growth or if the market energy is beginning to wane.
//+------------------------------------------------------------------+
//|                            Volume with Custom Moving Average.mq4 |
//|                      Copyright © 2004, MetaQuotes Software Corp. |
//|                                       http://www.metaquotes.net/ |
//+------------------------------------------------------------------+
#property copyright "Copyright © 2004, MetaQuotes Software Corp. Modified RonT"
#property link      "http://www.metaquotes.net/"

#property indicator_separate_window
#property indicator_buffers 3
#property indicator_color1 Red
#property indicator_color2 Green
#property indicator_color3 Black

// User input
extern int MA_Period=20;
extern int MA_Shift=0;
extern int MA_Method=0;

// Buffers
double VolBuffer1[];  // value down
double VolBuffer2[];  // value up
double VolBuffer3[];  // moving average

//----
int ExtCountedBars=0;
int lastcolor=0;


//+------------------------------------------------------------------+
//| Custom indicator initialization function                         |
//+------------------------------------------------------------------+
int init()
  {
   int    draw_begin;
   string short_name;

   // indicator buffers mapping, drawing settings and Shift

   // Histogram downArrow Red
   SetIndexBuffer(0,VolBuffer1);
   SetIndexStyle(0,DRAW_HISTOGRAM, 0, 4);
   SetIndexShift(0,MA_Shift);

   // Histogram upArrow Green
   SetIndexBuffer(1,VolBuffer2);
   SetIndexStyle(1,DRAW_HISTOGRAM, 0, 4);
   SetIndexShift(1,MA_Shift);

   // Moving average line Black
   SetIndexBuffer(2,VolBuffer3);
   SetIndexStyle(2,DRAW_LINE);
   SetIndexShift(2,MA_Shift);


   IndicatorDigits(MarketInfo(Symbol(),MODE_DIGITS));

   if(MA_Period<2) MA_Period=2;
   draw_begin=MA_Period-1;

   switch(MA_Method)
     {
      case 1  : short_name="EMA(" ;  draw_begin=0; break;
      case 2  : short_name="SMMA(";                break;
      case 3  : short_name="LWMA(";                break;
      default : short_name="SMA(" ;  MA_Method=0;
     }
   IndicatorShortName(short_name+MA_Period+")");

   SetIndexDrawBegin(0,draw_begin);

   return(0);
  }


//+------------------------------------------------------------------+
//| Main                                                             |
//+------------------------------------------------------------------+
int start()
  {

   if(Bars<=MA_Period) return(0);
   ExtCountedBars=IndicatorCounted();

// check for possible errors
   if (ExtCountedBars<0) return(-1);

// last counted bar will be recounted
   if (ExtCountedBars>0) ExtCountedBars--;

   switch(MA_Method)
     {
      case 0 : sma();  break;
      case 1 : ema();  break;
      case 2 : smma(); break;
      case 3 : lwma();
     }
   return(0);
  }

//+------------------------------------------------------------------+
//| Simple Moving Average                                            |
//+------------------------------------------------------------------+
void sma()
  {
   double sum=0;
   int    i,pos=Bars-ExtCountedBars-1;

   // initial accumulation
   if(pos<MA_Period) pos=MA_Period;
   for(i=1;i<MA_Period;i++,pos--)
      sum+=Volume[pos];

   while(pos>=0)
     {
      sum+=Volume[pos];
      VolBuffer3[pos]=sum/MA_Period;
   sum-=Volume[pos+MA_Period-1];
   Vcolor(pos);
    pos--;
     }

   // zero initial bars
   if(ExtCountedBars<1)
      for(i=1;i<MA_Period;i++) VolBuffer1[Bars-i]=0;
  }


//+------------------------------------------------------------------+
//| Exponential Moving Average                                       |
//+------------------------------------------------------------------+
void ema()
  {
   double pr=2.0/(MA_Period+1);
   int    pos=Bars-2;

   if(ExtCountedBars>2) pos=Bars-ExtCountedBars-1;

   while(pos>=0)
     {
      if(pos==Bars-2) VolBuffer3[pos+1]=Volume[pos+1];
      VolBuffer3[pos]=Volume[pos]*pr+VolBuffer3[pos+1]*(1-pr);
      Vcolor(pos);
    pos--;
     }
  }


//+------------------------------------------------------------------+
//| Smoothed Moving Average                                          |
//+------------------------------------------------------------------+
void smma()
  {
   double sum=0;
   int    i,k,pos=Bars-ExtCountedBars+1;

   pos=Bars-MA_Period;
   if(pos>Bars-ExtCountedBars) pos=Bars-ExtCountedBars;
   while(pos>=0)
     {
      if(pos==Bars-MA_Period)
        {
         // initial accumulation
         for(i=0,k=pos;i<MA_Period;i++,k++)
           {
            sum+=Volume[k];
            // zero initial bars
            VolBuffer3[k]=0;
           }
        }
      else sum=VolBuffer3[pos+1]*(MA_Period-1)+Volume[pos];
      VolBuffer3[pos]=sum/MA_Period;
    pos--;
     }
  }


//+------------------------------------------------------------------+
//| Linear Weighted Moving Average                                   |
//+------------------------------------------------------------------+
void lwma()
  {
   double sum=0.0,lsum=0.0;
   double price;
   int    i,weight=0,pos=Bars-ExtCountedBars-1;
//---- initial accumulation
   if(pos<MA_Period) pos=MA_Period;
   for(i=1;i<=MA_Period;i++,pos--)
     {
      price=Volume[pos];
      sum+=price*i;
      lsum+=price;
      weight+=i;
     }
//---- main calculation loop
   pos++;
   i=pos+MA_Period;
   while(pos>=0)
     {
      VolBuffer3[pos]=sum/weight;
      if(pos==0) break;
      pos--;
      i--;
      price=Volume[pos];
      sum=sum-lsum+price*MA_Period;
      lsum-=Volume[i];
      lsum+=price;
     }
//---- zero initial bars
   if(ExtCountedBars<1)
      for(i=1;i<MA_Period;i++) VolBuffer3[Bars-i]=0;
  }


//+------------------------------------------------------------------+
//| Color depends on gain or loss and previous volume                |
//+------------------------------------------------------------------+
// 1 - histo down red
// 2 - histo up green
// 3 - line white

void Vcolor(int p)
  {

   if (Volume[p+1]>Volume[p])
     {
      VolBuffer1[p]=Volume[p];
      VolBuffer2[p]=0;
      lastcolor=Red;
     }

   if (Volume[p+1]<Volume[p])
     {
      VolBuffer1[p]=0;
      VolBuffer2[p]=Volume[p];
      lastcolor=Green;
     }

   if (Volume[p+1]==Volume[p])
     {
      if ( lastcolor==Red )
        {
         VolBuffer1[p]=Volume[p];
         VolBuffer2[p]=0;
        }
      if ( lastcolor==Green )
        {
         VolBuffer1[p]=0;
         VolBuffer2[p]=Volume[p];
        }
     }
  }

//+------------------------------------------------------------------+
Comments