Volatility.Pivot_v3
Download script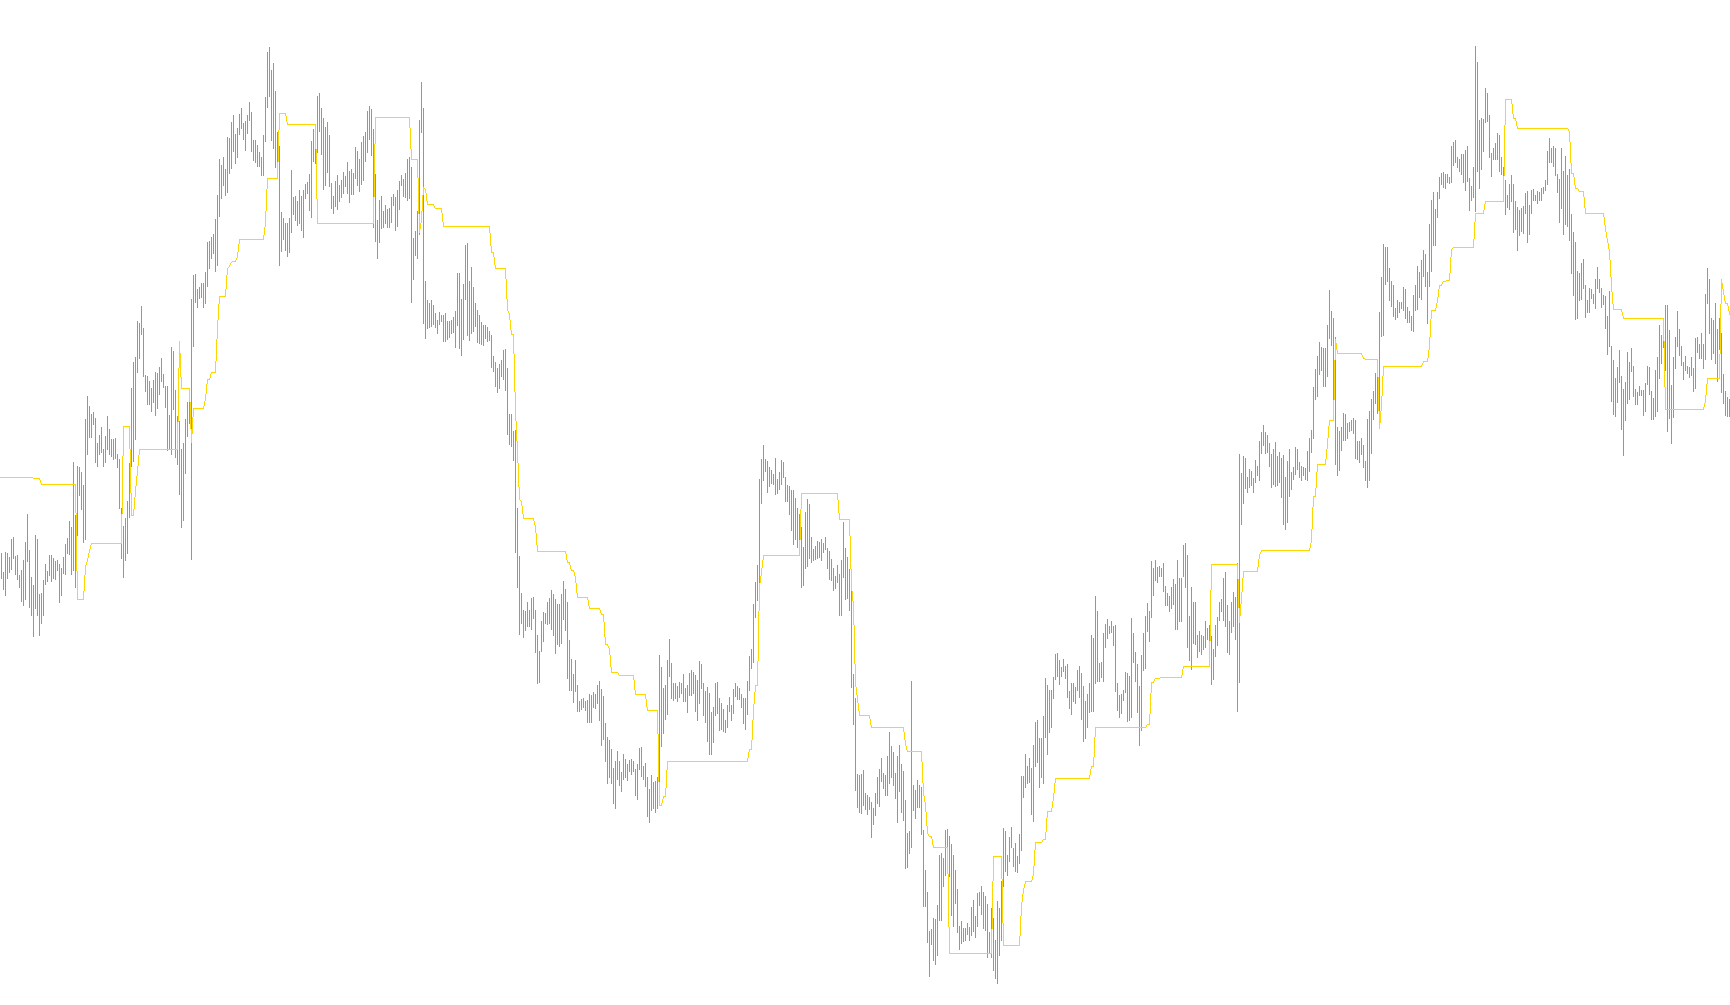
This script is designed as a technical analysis tool for the MetaTrader platform, specifically engineered to identify and track price "stops" or pivot points based on market volatility. Instead of relying on static price levels, it dynamically adjusts its logic to account for how much the market actually moves during a given period.
Core Logic Overview
The primary objective of this indicator is to calculate a trailing support/resistance level (referred to as a "Stop" line). The script determines where these levels should sit by analyzing two main factors: the current price action and the historical volatility of the asset.
How it Works
The tool operates through three distinct logical layers:
1. Volatility Measurement The script first calculates the market's "breath" using a volatility measurement. It looks at how much the price has fluctuated over a specific timeframe. This ensures that in high-volatility markets (where prices move wildly), the indicator provides wider buffers, and in low-volatility markets, it remains more sensitive.
2. Dynamic Distance Calculation Depending on the user's settings, the script determines the "gap" between the current price and the pivot point in one of two ways:
- Adaptive Mode: It takes the average volatility and multiplies it by a specific factor. This means the gap automatically widens or narrows based on market conditions.
- Fixed Mode: It uses a predetermined, constant price distance regardless of how volatile the market is.
3. Pivot Point Tracking (The "Stop" Line) The indicator then draws a line on your chart that follows the price. Its movement logic follows these rules:
- Price Consistency: If the current price stays above or below the previous level, the line remains stable.
- Trailing Movement: If the price moves in favor of the trend (moving further away from the pivot), the line "trails" the price at a set distance derived from the volatility calculation mentioned above.
- Reversal Detection: If the price crosses the current pivot level, the script instantly recalculates and reposition the line to the new side of the price, effectively resetting the anchor point for the next movement.
Summary for Traders
Essentially, this tool acts as a dynamic "floor" or "ceiling." It attempts to filter out market noise by ensuring that the levels it identifies are significant enough to be meaningful based on recent price swings. It helps traders visualize where the market's momentum is shifting and provides a visual reference for where a trend might lose its strength or where a new price boundary has been established.
//+------------------------------------------------------------------+
//|                                             Volatility.Pivot.mq4 |
//+------------------------------------------------------------------+
#property copyright "thanks to S.B.T. (Japan)"
#property link      "http://sufx.core.t3-ism.net/" //<<< convert this from VT, thanks mate !!!
//----
#property indicator_chart_window
#property indicator_buffers 2
#property indicator_color1 Red
//---- input parameters
extern double     atr_range=100;
extern double     ima_range=10;
extern double     atr_factor=3;
extern int        Mode=0;
extern double     DeltaPrice=30;
//---- buffers
double TrStop[];
double ATR[];
//+------------------------------------------------------------------+
//| Custom indicator initialization function                         |
//+------------------------------------------------------------------+
int init()
  {
//---- indicators
   SetIndexStyle(0, DRAW_LINE,STYLE_SOLID,1);
   SetIndexBuffer(0, TrStop);
   SetIndexStyle(1, DRAW_NONE);
   SetIndexBuffer(1, ATR);
//----
   string short_name="!! RisenbergVolatilityCapture";
   IndicatorShortName(short_name);
   SetIndexLabel(1,"range base");
//----
   return(0);
  }
//+------------------------------------------------------------------+
//| Custor indicator deinitialization function                       |
//+------------------------------------------------------------------+
int deinit()
  {
//----
//----
   return(0);
  }
//+------------------------------------------------------------------+
//| Custom indicator iteration function                              |
//+------------------------------------------------------------------+
int start()
  {
   int counted_bars=IndicatorCounted();
   int limit;
   int i;
//----
   double DeltaStop;
//----
   limit=Bars;
     for(i=0; i < limit; i ++)
     {
      ATR[i]=iATR(NULL,0,atr_range,i);
     }
     for(i=limit - 1; i>=0; i --)
     {
        if (Mode==0)
        {
         DeltaStop=iMAOnArray(ATR,0,ima_range,0,MODE_EMA,i) * atr_factor;
         //DeltaStop = iATR(NULL,0,atr_range,i) * atr_factor;
         }
          else
         {
         DeltaStop=DeltaPrice*Point;
        }
        if (Close[i]==TrStop[i + 1])
        {
         TrStop[i]=TrStop[i + 1];
         }
          else
         {
           if (Close[i+1]<TrStop[i+1] && Close[i]<TrStop[i+1])
           {
            TrStop[i]=MathMin(TrStop[i + 1], Close[i] + DeltaStop);
            }
             else
            {
              if (Close[i+1]>TrStop[i+1] && Close[i]>TrStop[i+1])
              {
               TrStop[i]=MathMax(TrStop[i+1], Close[i] - DeltaStop);
               }
                else
               {
               if (Close[i] > TrStop[i+1]) TrStop[i]=Close[i] - DeltaStop; else TrStop[i]=Close[i] + DeltaStop;
              }
           }
        }
     }
//----
   return(0);
  }
//+------------------------------------------------------------------+
Comments