Volatility2
Download script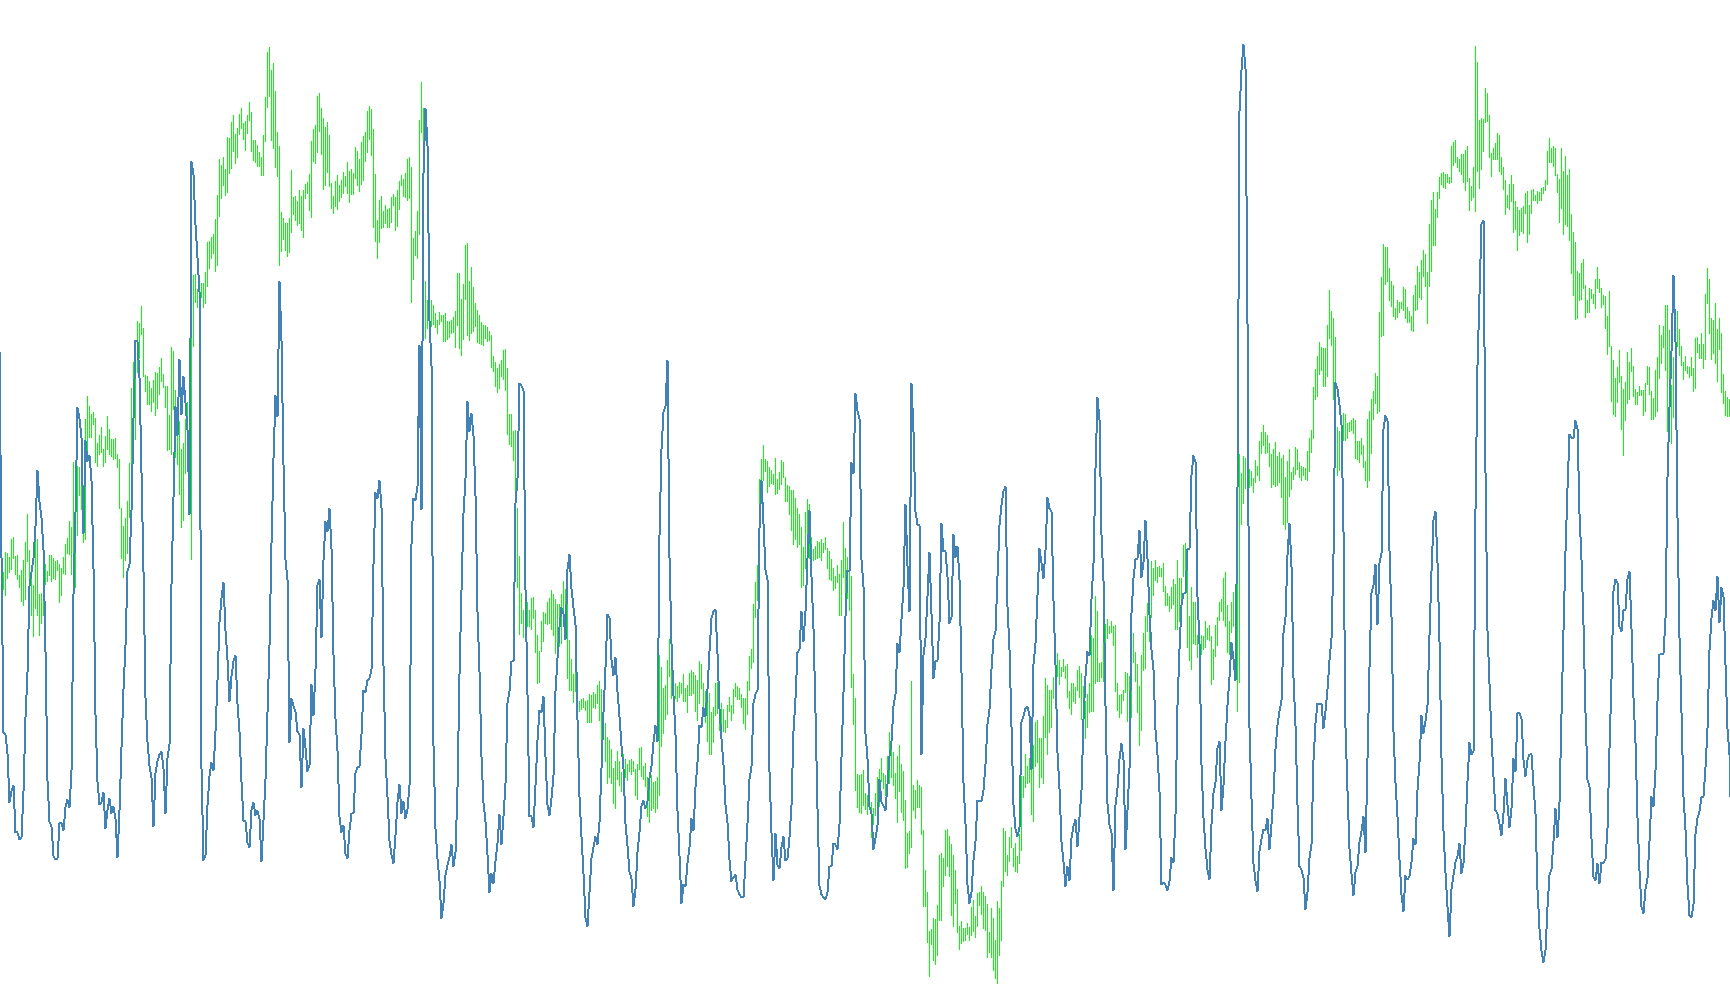
This custom trading indicator is designed to provide a visual representation of market "volatility"—essentially measuring how much the price of an asset is swinging or expanding over a specific period. By isolating this movement into its own separate window on your chart, it allows you to see the intensity of price action without it being cluttered by the main price candles.
How it Works
The tool operates based on a user-defined timeframe (the "Volatility Period"). Instead of looking at the total distance between the highest and lowest prices, which can be influenced by outliers, this script uses a more smoothed approach:
- Identifying Price Extremes: The logic looks at two specific data points for every bar: the highest price reached (High) and the lowest price reached (Low).
- Smoothing the Data: Rather than taking raw numbers, it calculates a Simple Moving Average for both the Highs and the Lows over your chosen period. This helps filter out "noise" and shows you the average trend of the price boundaries.
- Measuring the Gap: The script then calculates the difference between that "Average High" and the "Average Low."
- Scaling for Visibility: To make this data easy to read on a standard chart, the result is multiplied by 100. This converts the raw price difference into a readable numerical value that moves up or down on the indicator scale.
Visual Representation
When you view this indicator on your platform, it appears as a continuous line in a separate sub-window.
- High Line: When the line trends upward, it indicates that the gap between the high and low prices is widening, suggesting increased market activity or "stretch."
- Low Line: When the line trends downward, it suggests the price range is compressing, which often indicates a period of consolidation or lower trading interest.
- Reference Levels: The indicator includes built-in horizontal benchmarks (at intervals of 100 units) to help you quickly identify when volatility reaches significant milestones compared to previous market behavior.
In short, this tool acts as a "heart rate monitor" for the market, helping you gauge whether the current environment is calm and steady or becoming increasingly active and wide-ranging.
//+------------------------------------------------------------------+
//|                                                   Volatility.mq4 |
//|                                       Copyright © 2007, Eva Ruft |
//|                                                briz18@rambler.ru |
//+------------------------------------------------------------------+
#property copyright "Copyright © 2007, Eva Ruft"
#property link      "briz18@rambler.ru"

#property indicator_separate_window
#property indicator_buffers 1
//---- input parameters
extern int VolatilityPeriod=5;
//---- indicator buffers
double MainBuffer[];
//+------------------------------------------------------------------+
//| Custom indicator initialization function                         |
//+------------------------------------------------------------------+
int init()
  {
//---- drawing settings
   SetLevelValue(0,50);
   SetLevelStyle(0,1,Black);
   SetLevelValue(1,100);
   SetLevelStyle(0,0,Black);
   SetLevelValue(2,200);
   SetLevelStyle(0,0,Black);
   SetLevelValue(3,300);
   SetLevelStyle(0,0,Black);
   SetLevelValue(4,400);
   SetLevelStyle(0,0,Black);
   SetIndexStyle(0,DRAW_LINE,0,2,SteelBlue);
   SetIndexBuffer(0, MainBuffer);
   SetIndexDrawBegin(0,VolatilityPeriod);
   IndicatorDigits(Digits+2);
//---- name for DataWindow and indicator subwindow label
   IndicatorShortName("Volatility("+VolatilityPeriod+")");
   SetIndexLabel(0,"Volatility");
//---- initialization done
   return(0);
  }

//+------------------------------------------------------------------+
//|Volatility                                                        |
//+------------------------------------------------------------------+
int start()
  {
   int limit;
   int counted_bars=IndicatorCounted();
//---- last counted bar will be recounted
   if(counted_bars>0) counted_bars--;
   limit=Bars-counted_bars;
//---- Volatility counted
   for(int i=0; i<limit; i++)
      MainBuffer[i]=(iMA(NULL,0,VolatilityPeriod,0,MODE_SMA,PRICE_HIGH,i)-iMA(NULL,0,VolatilityPeriod,0,MODE_SMA,PRICE_LOW,i))*100;
//----
   return(0);
  }
//+------------------------------------------------------------------+
Comments