VQ bars
Download script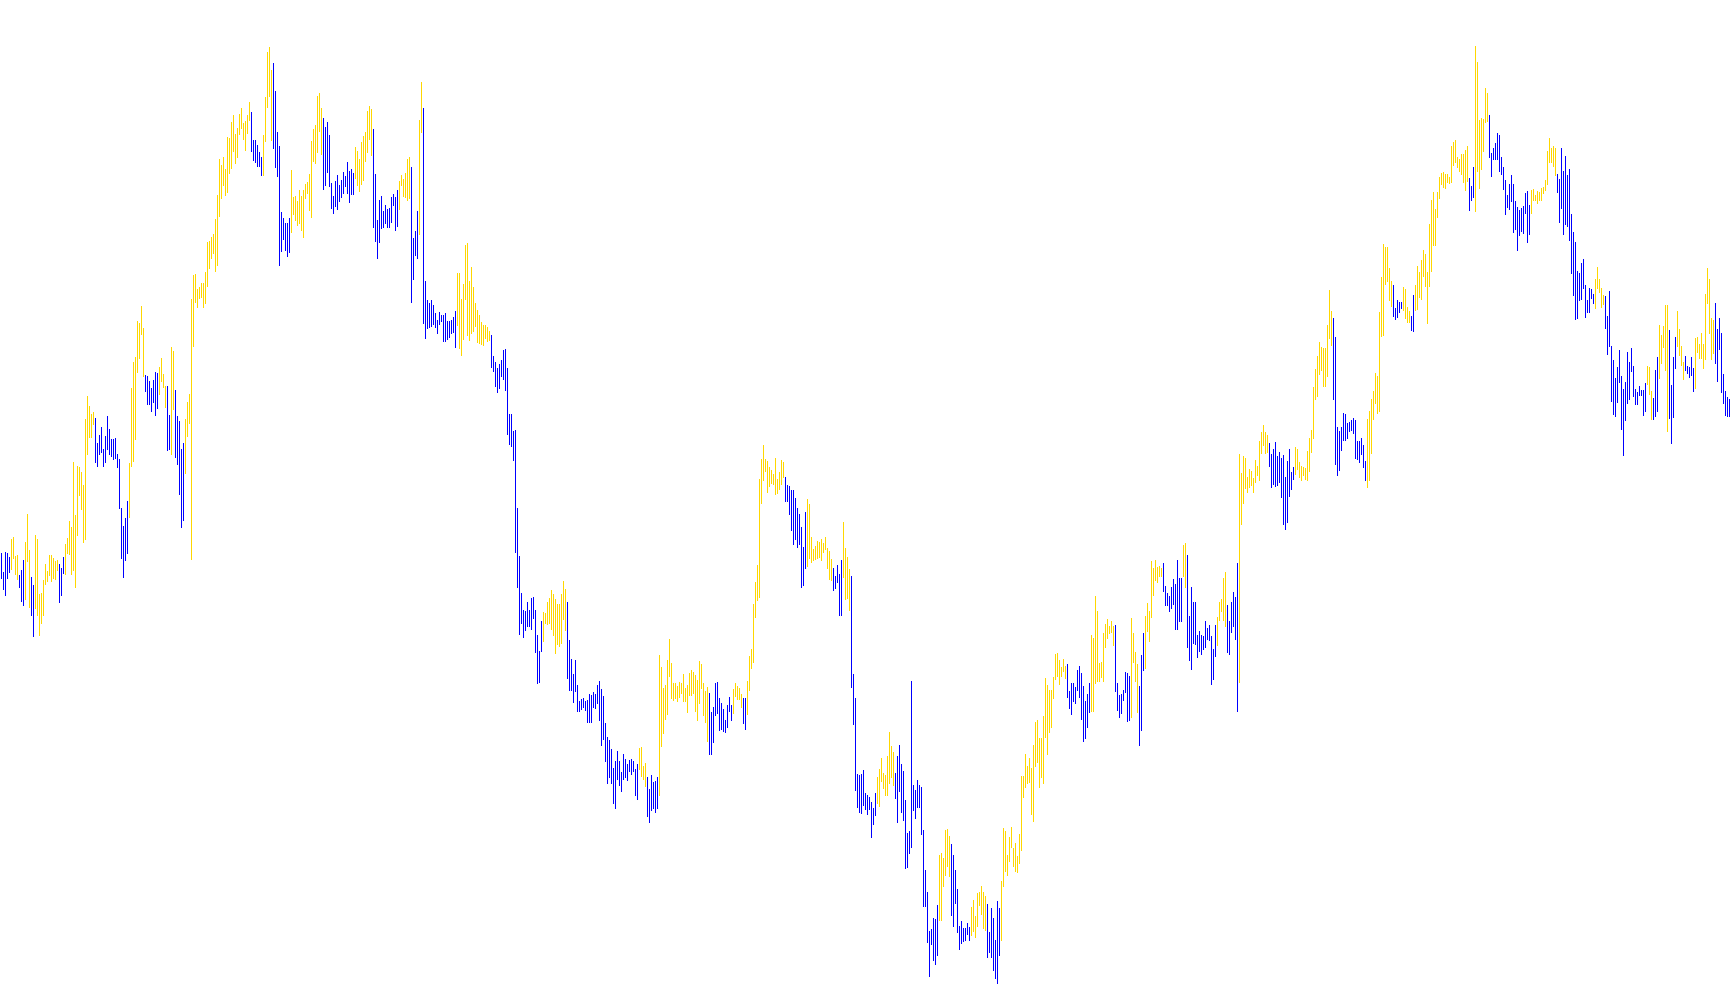
This indicator, titled Volatility Quality (VQ), is designed to analyze market movements by evaluating the relationship between price action and price volatility. Instead of simply looking at where the price is going, it seeks to measure the "quality" or strength of that movement relative to the price range established during a specific period.
How the Logic Works
The script processes market data through several layers of calculation to provide a visual representation of market direction:
1. Data Gathering and Smoothing The indicator first looks at several key price points simultaneously—specifically the Highs, Lows, Opens, and Closes of recent candles. It calculates moving averages for these different price types over a user-defined period. This allows the tool to understand not just the current price, but the "envelope" (the high-to-low range) in which the market is currently trading.
2. The Volatility Quality Calculation The core of the script lies in its unique formula for "VQ." It compares the distance between the recent Close and previous prices against the total volatility (the distance between the Highs and Lows).
- Essentially, it asks: "Is the price moving significantly compared to how much it is swinging?"
- By weighing these differences against each other, the script produces a value that represents the momentum's quality.
3. Filtering and Accumulation To ensure the data isn't too "noisy" or erratic, the script performs two refinements:
- Summation: It accumulates these Volatility Quality values over time to create a running total.
- Noise Reduction: It applies a filter that prevents small, insignificant price flickers from altering the overall trend. If a movement is smaller than a specific threshold, the indicator ignores it, keeping the data smooth and relevant.
4. Directional Output Finally, the script interprets the running total of Volatility Quality to determine the market's direction:
- If the accumulated quality is increasing, it identifies an Upward trend.
- If the accumulated quality is decreasing, it identifies a Downward trend.
Visual Representation
The results are displayed on your chart as a histogram. When the logic detects a high-quality upward movement, it highlights the price action accordingly; when it detects a downward shift, it switches colors/positions to reflect that change. This allows traders to see the underlying "health" of a trend rather than just reacting to raw price changes.
//+------------------------------------------------------------------+
//|                                                                  |                                                 VQ.mq4 |
//|                                               Volatility Quality |
//|                                                by raff1410@o2.pl |
//+------------------------------------------------------------------+

#property  indicator_chart_window
#property  indicator_buffers 2
#property  indicator_color1  Green
#property  indicator_color2  Red
#property  indicator_width1  2
#property  indicator_width2  2

extern   int      Length = 5;
extern   int      Method = 3;
extern   int      Smoothing = 1;
extern   int      Filter = 5;
extern   bool     Steady  = false;

double   VQ[];
double   SumVQ[];
double   DIR[];
double   UpBuffer[];
double   DnBuffer[];

//+------------------------------------------------------------------+

int init()
{
IndicatorBuffers(5);
SetIndexStyle(0,DRAW_HISTOGRAM);
SetIndexBuffer(0,UpBuffer);
SetIndexStyle(1,DRAW_HISTOGRAM);
SetIndexBuffer(1,DnBuffer);
SetIndexBuffer(2,SumVQ);
SetIndexBuffer(3,VQ);
SetIndexBuffer(4,DIR);

if (Length < 2) Length = 2;
if (Method < 0) Method = 0;
if (Method > 3) Method = 3;
if (Smoothing < 0) Smoothing = 0;
if (Filter < 0) Filter = 0;

string short_name = "VQ | "+ Length + " , " +
Method + " , " + Smoothing + " , " + Filter + "  | ";
IndicatorShortName(short_name);
SetIndexEmptyValue(0, 0.0);
SetIndexEmptyValue(1, 0.0);
SetIndexEmptyValue(2, 0.0);
SetIndexEmptyValue(3, 0.0);
return(0);
}

//+------------------------------------------------------------------+

int start()
{
 double MH = 0, ML = 0, MO = 0, MC = 0, MC1 = 0;
 int i, j, limit, counted_bars=IndicatorCounted();
//---- check for possible errors
 if(counted_bars<0) return(-1);
//---- last counted bar will be recounted
 if(counted_bars>0) counted_bars--;
//----
 if(counted_bars<1) i=Bars-Length-1;
 else i=Bars-counted_bars;
 if(counted_bars<1)
  {
   j=Bars-Length-1;
   SumVQ[j + 1] = Close[j + 1];
  }
 while (i >= 0)
   {
    MH = iMA(NULL,0,Length,0,Method,PRICE_HIGH,i);
    ML = iMA(NULL,0,Length,0,Method,PRICE_LOW,i);
    MO = iMA(NULL,0,Length,0,Method,PRICE_OPEN,i);
    MC = iMA(NULL,0,Length,0,Method,PRICE_CLOSE,i);
    MC1 = iMA(NULL,0,Length,0,Method,PRICE_CLOSE,i+Smoothing);

    if (Steady==true)
     {
      MC=iMA(NULL,0,Length,0,Method,PRICE_MEDIAN,i);
      MC1=iMA(NULL,0,Length,0,Method,PRICE_MEDIAN,i+Smoothing);
     }

    if((MH - ML)>0) VQ[i] = MathAbs(((MC - MC1) / MathMax(MH - ML, MathMax(MH - MC1, MC1 - ML)) + (MC - MO) / (MH - ML)) * 0.5) * ((MC - MC1 + (MC - MO)) * 0.5);
    SumVQ[i] = SumVQ[i + 1] + VQ[i];
    if (Filter > 0) if (MathAbs(SumVQ[i] - SumVQ[i + 1]) < Filter * Point) SumVQ[i] = SumVQ[i + 1];
    i--;
   }
 if(counted_bars<1) limit=Bars-Length-1;
 else limit=Bars-counted_bars;
 for (i = limit-1; i >= 0; i--)
  {
   if (SumVQ[i] > SumVQ[i+1]) DIR[i] = 1;
   if (SumVQ[i] < SumVQ[i+1]) DIR[i] = -1;
   if (SumVQ[i]== SumVQ[i+1]) DIR[i] = DIR[i + 1];

   if (DIR[i] > 0)
    {
     UpBuffer[i] = High[i];

     DnBuffer[i] = Low[i];
    }
   else
   if (DIR[i] < 0)
    {
     DnBuffer[i] = High[i];

     UpBuffer[i] = Low[i];
    }
  }

return(0);
}
Comments