TM2
Download script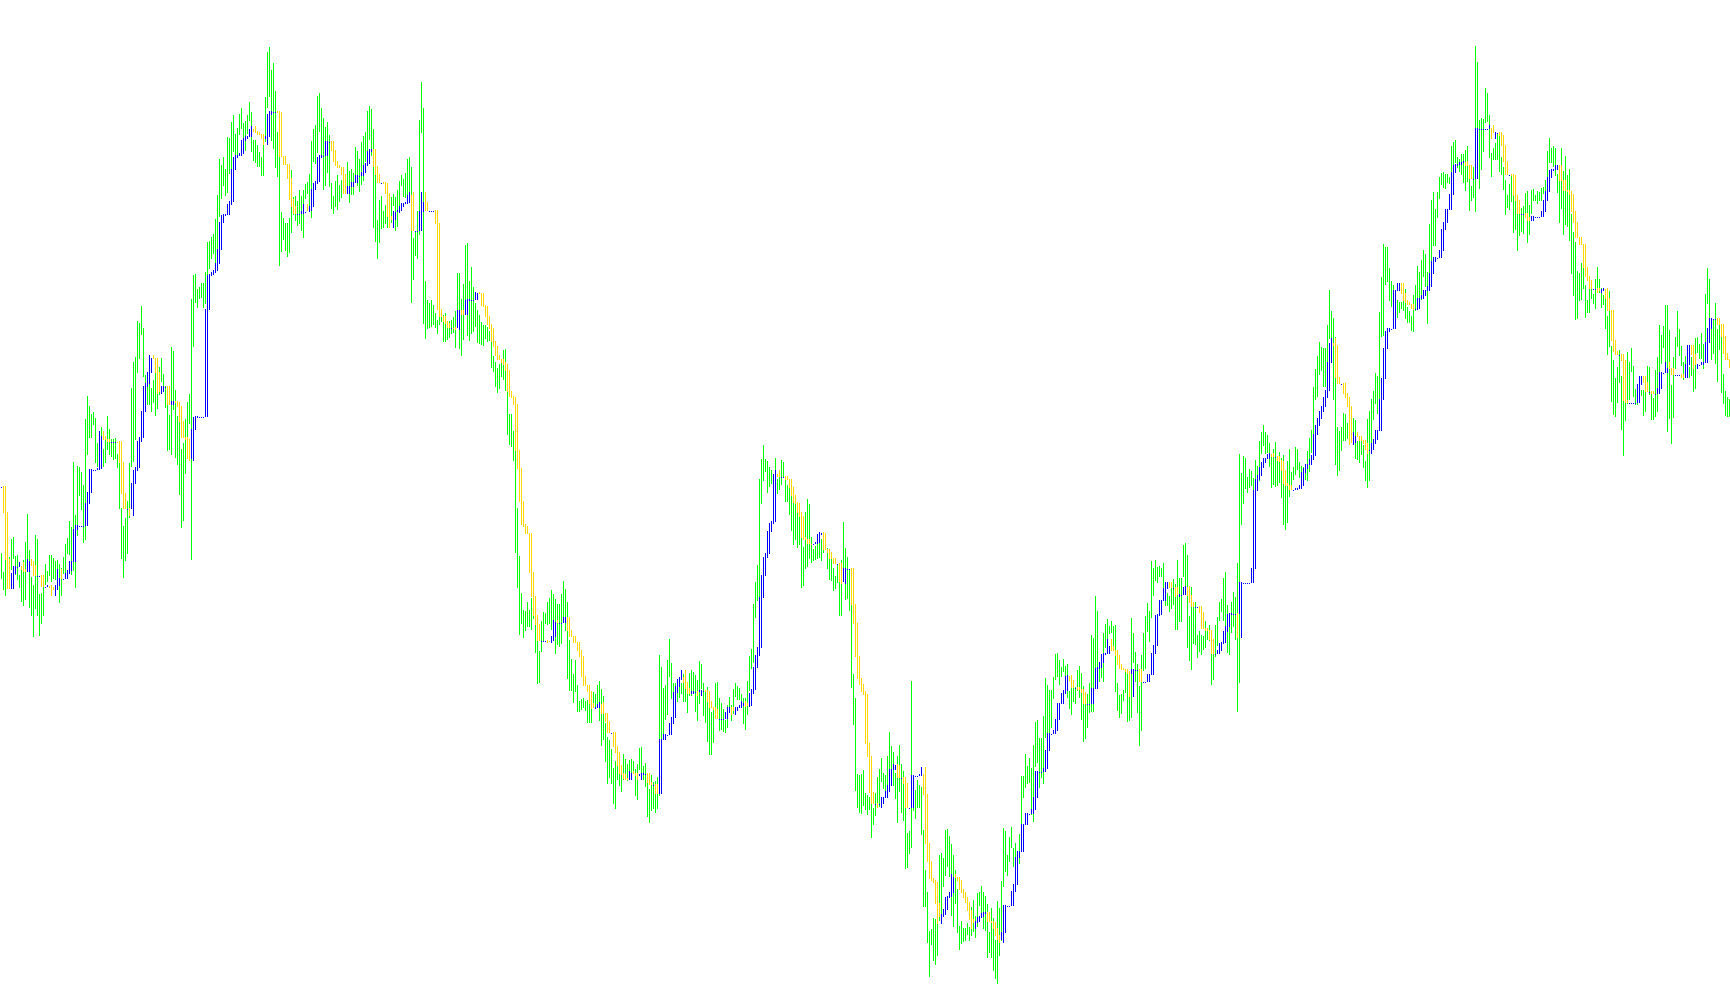
This technical tool is designed to provide visual clarity on a trading chart by identifying specific price levels based on historical movement. It essentially acts as a smoothed reference point, helping traders see the "middle ground" of price action over a set timeframe.
Core Logic and Functionality
The script operates by analyzing a specific window of time (the period) to determine where the highest and lowest prices occurred. Here is how that data is processed into the visual elements you see on your screen:
- Price Range Identification: The tool looks back at a user-defined number of candles. During this lookback, it identifies the absolute highest price reached and the absolute lowest price reached.
- Calculating the Center Point (Span A): Once the high and low points are identified, the script calculates the exact midpoint between them. This average value represents the "equilibrium" for that specific period. In the visual interface, this is represented by a red histogram.
- The Shifted Reference (Span B): To provide a comparison point, the tool also calculates a second value. This is essentially the same midpoint calculation but shifted forward or backward by a user-defined amount of bars. This creates a "delayed" reference point, shown as a blue histogram.
How it assists the trader
By plotting these two midpoints—one current and one shifted—the tool allows you to visualize the relationship between past price averages and current price action.
Instead of looking at raw, volatile price candles, this script simplifies the market into two distinct "lanes" of data. When these two lines move closer together or further apart, it provides a visual cue regarding price momentum and the distance between historical averages and the current market state. You can customize the length of the lookback period and the size of the shift to tailor the tool to different trading styles, whether you prefer a fast-reacting indicator or one that filters out more market noise.
// TM2.mq4

#property indicator_chart_window
#property indicator_buffers 2
#property indicator_color1 Red
#property indicator_color2 Blue

extern int TM_Period = 7;
extern int TM_Shift = 2;

double SpanA_Buffer[];
double SpanB_Buffer[];
int a_begin;

int init()
{
   a_begin=TM_Shift;
   SetIndexStyle(0,DRAW_HISTOGRAM,STYLE_SOLID);
   SetIndexBuffer(0,SpanB_Buffer);
   SetIndexDrawBegin(0,TM_Period+a_begin-1);
   SetIndexLabel(0,"TM_Period+");
   SetIndexStyle(1,DRAW_HISTOGRAM,STYLE_SOLID);
   SetIndexBuffer(1,SpanA_Buffer);
   SetIndexDrawBegin(1,TM_Period+a_begin-1);
   SetIndexLabel(1,"TM_Period");

   return(0);
}

int start()
{
   int    i,k;
   int    counted_bars=IndicatorCounted();
   double high,low,price;

   if(Bars<=TM_Period) return(0);
   if(counted_bars<1)
   {
      for(i=1;i<=TM_Period;i++)
      {
         SpanA_Buffer[Bars-i]=0;
         SpanB_Buffer[Bars-i]=0;
      }
   }

   i=Bars-TM_Period;
   if(counted_bars>TM_Period) i=Bars-counted_bars-1;
   while(i>=0)
   {
      high=High[i]; low=Low[i]; k=i-1+TM_Period;
      while(k>=i)
      {
         price=High[k];
         if(high<price) high=price;
         price=Low[k];
         if(low>price)  low=price;
         k--;
      }
      SpanA_Buffer[i]  = (high+low)/2.0;
      SpanB_Buffer[i]  = SpanA_Buffer[i+TM_Shift];
      i--;
   }

   return(0);
}
Comments