TIME_FRAME
Download script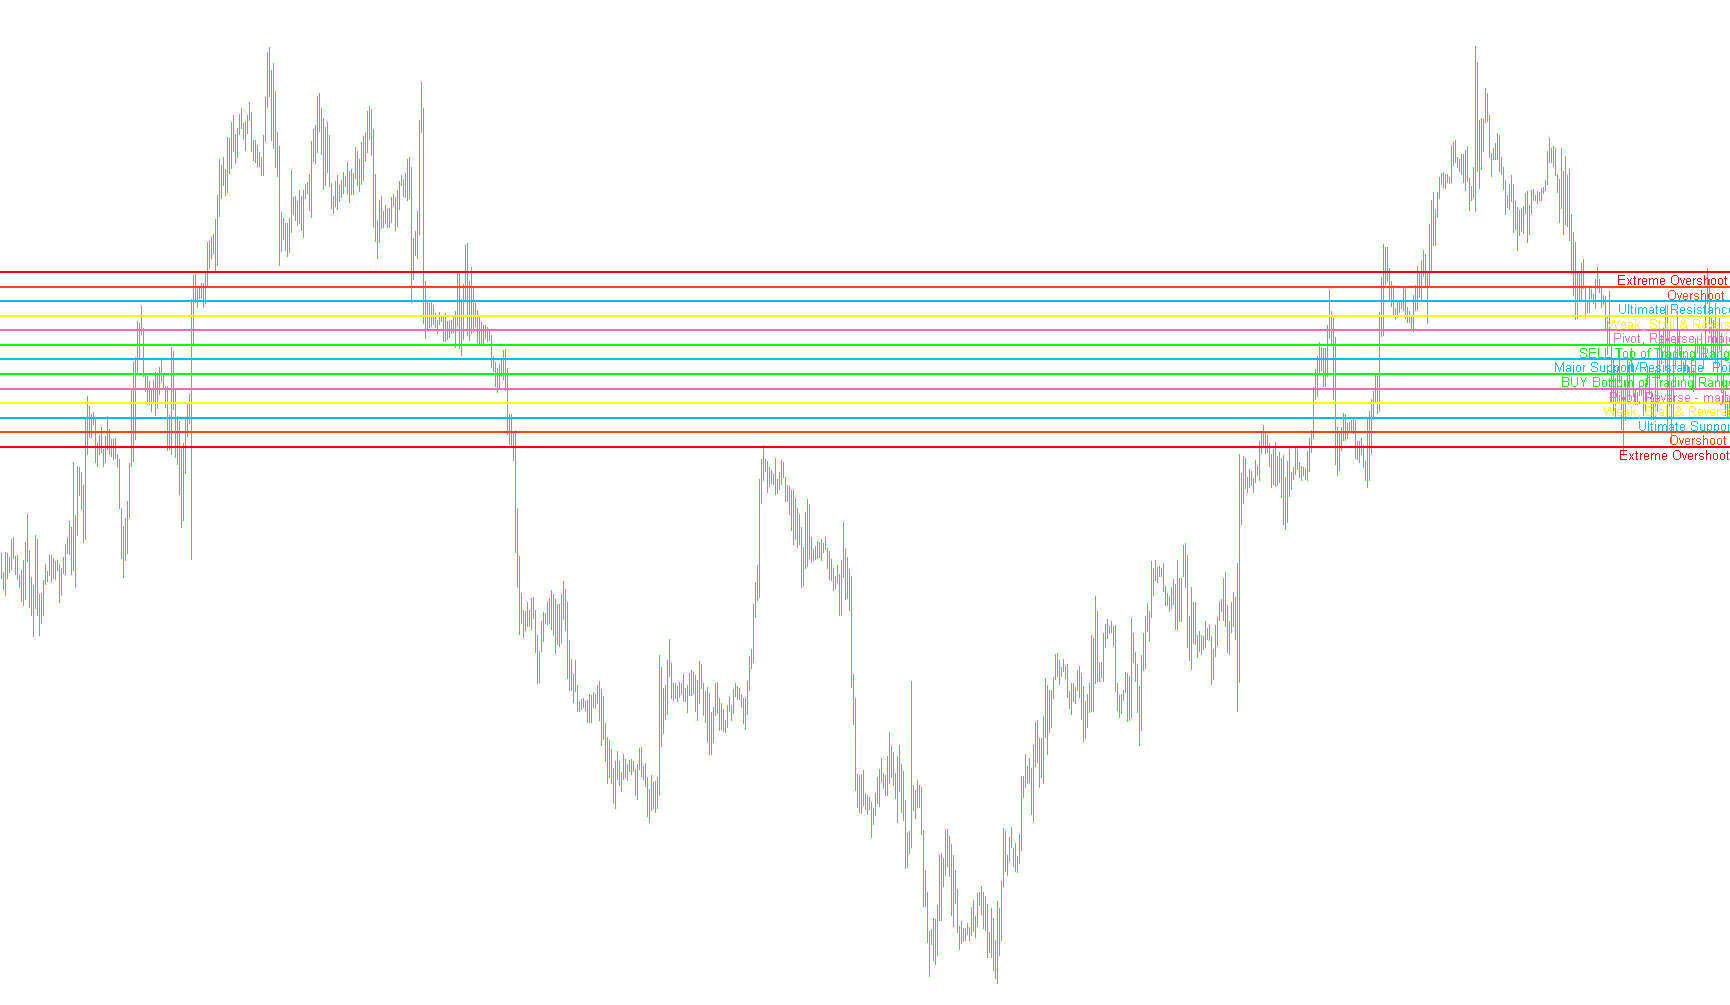
Overview of Logic
This script is designed to analyze the price action of a financial market and project a structured "grid" of support and resistance levels onto your trading chart. Instead of simply looking at past prices, it uses a mathematical approach called "Fractal Analysis" to determine the natural boundaries of the current trading range.
The logic follows a three-step process: identifying the boundary, calculating the fractal structure, and projecting the trading zones.
How the Logic Works
1. Range Identification
The script begins by scanning a specific look-back period (defined by the user) to find the absolute highest price and the absolute lowest price reached recently. These two points establish the "trading container"—the total range in which the price is currently moving.
2. Fractal Scaling
Once the range is established, the script determines the "scale" of the market using a fractal logic. It compares the size of the current price range against various mathematical constants (powers of 2). This allows the tool to automatically adapt to different assets; whether you are trading a high-value asset (like Gold) or a low-value currency pair, the script adjusts its internal math to ensure the zones remain proportional and meaningful.
3. Octave Calculation and Zone Mapping
After finding the correct scale, the script divides the price range into "Octaves." It performs a series of checks to find the most mathematically significant points within that range. These points are then used to calculate several distinct horizontal levels:
- Major Pivot Points: The script identifies where the price is most likely to stall or reverse based on the distribution of past movement.
- Support and Resistance Zones: It calculates specific values for "Ultimate Support" (the bottom), "Ultimate Resistance" (the top), and various intermediate "Buy" and "Sell" zones.
Visual Output and Interpretation
The script generates 13 distinct horizontal lines on your chart, each mapped to a specific price level with its own unique color and label. These labels provide a narrative for the price action:
- Extreme Zones: Identified as "Overshoot" or "Ultimate Resistance/Support," these represent areas where the price is stretched to its limit.
- Trading Ranges: Labels like "BUY Bottom of Trading Range" or "SELL Top of Trading Range" indicate areas where the script perceives a high probability of price reversal or accumulation.
- Stall Points: Intermediate labels describe areas where the market might "Weak, Stall & Reverse," indicating potential zones of transition.
Summary for the User
Essentially, this tool acts as an automated "map maker." It looks at how far the price has traveled in the recent past, calculates the mathematical "skeleton" of that movement, and draws a 13-step guide on your screen to help you identify where the market is likely to find balance or exhaustion.
//+------------------------------------------------------------------+
//|                                                   TIME_FRAME.mq4 |
//|                      Copyright © 2006, MetaQuotes Software Corp. |
//|                                        http://www.metaquotes.net |
//+------------------------------------------------------------------+
#property copyright "  "
#property link      "  "
#property indicator_chart_window
//+------------------------------------------------------------------+
//| Define the Variables to use.....                                 |
//+------------------------------------------------------------------+
extern int P = 64;
extern int StepBack = 0;
double  dmml = 0,dvtl = 0,sum  = 0,v1 = 0,v2 = 0,mn = 0,mx = 0,
        x1 = 0,x2 = 0,x3 = 0,x4 = 0,x5 = 0,x6 = 0,y1 = 0,y2 = 0,y3 = 0,y4 = 0,y5 = 0,y6 = 0,
        octave = 0,Octv = 0,fractal = 0,range = 0,finalH  = 0,finalL  = 0,mml[13];
string  ln_txt[13],
        buff_str = "";
int     bn_v1 = 0,bn_v2 = 0,OctLinesCnt = 13,
        mml_thk = 8,mml_clr[13],mml_shft = 3,
        nTime = 0,CurPeriod = 0,nDigits = 0,i = 0;
//+------------------------------------------------------------------+
//| Setup On-Screen Text                                             |
//+------------------------------------------------------------------+
int init() {
   ln_txt[0]  = "Extreme Overshoot [-2/8]            ";
   ln_txt[1]  = "Overshoot [-1/8]";// "overshoot [-1/8]";
   ln_txt[2]  = "Ultimate Support [0/8]       ";
   ln_txt[3]  = "Weak, Stall & Reverse [1/8]                ";
   ln_txt[4]  = "Pivot, Reverse - major [2/8]              ";
   ln_txt[5]  = "BUY Bottom of Trading Range [3/8]                          ";
   ln_txt[6]  = "Major Support/Resistance  Point [4/8]                          ";
   ln_txt[7]  = "SELL Top of Trading Range [5/8]                     ";
   ln_txt[8]  = "Pivot, Reverse - major [6/8]            ";
   ln_txt[9]  = "Weak, Stall & Reverse [7/8]              ";
   ln_txt[10] = "Ultimate Resistance [8/8]            ";
   ln_txt[11] = "Overshoot [+1/8]";
   ln_txt[12] = "Extreme Overshoot [+2/8]            ";
   mml_shft = 3;mml_thk  = 3;
   //color settings.....
   mml_clr[0]  = Red;    // [-2]/8
   mml_clr[1]  = OrangeRed;  // [-1]/8
   mml_clr[2]  = DeepSkyBlue;  //  [0]/8
   mml_clr[3]  = Yellow;      //  [1]/8
   mml_clr[4]  = HotPink;     //  [2]/8
   mml_clr[5]  = Lime;  //  [3]/8
   mml_clr[6]  = DeepSkyBlue;  //  [4]/8
   mml_clr[7]  = Lime;  //  [5]/8
   mml_clr[8]  = HotPink;     //  [6]/8
   mml_clr[9]  = Yellow;      //  [7]/8
   mml_clr[10] = DeepSkyBlue;  //  [8]/8
   mml_clr[11] = OrangeRed;  // [+1]/8
   mml_clr[12] = Red;    // [+2]/8
//----
   return(0);
  }
//+------------------------------------------------------------------+
//| Code to print On-Screen Lines                                    |
//+------------------------------------------------------------------+
int deinit() {
//---- TODO: add your code here
Comment(" ");
for(i=0;i<OctLinesCnt;i++) {
    buff_str = "mml"+i;
    ObjectDelete(buff_str);
    buff_str = "mml_txt"+i;
    ObjectDelete(buff_str);
    }
//----
   return(0);
  }
int start() {
//+------------------------------------------------------------------+
//| Define the LookBack Period                                       |
//+------------------------------------------------------------------+
if( (nTime != Time[0]) || (CurPeriod != Period()) ) {
  //price
   bn_v1 = Lowest(NULL,0,MODE_CLOSE,P+StepBack,0);
   bn_v2 = Highest(NULL,0,MODE_CLOSE,P+StepBack,0);
   v1 = Low[bn_v1]; v2 = High[bn_v2];
//+------------------------------------------------------------------+
//| Determine which Fractal to use.....                              |
//+------------------------------------------------------------------+
   if(v2<=250000 && v2>25000) fractal = 100000;
   if(v2<=25000 && v2>2500) fractal = 10000;
   if(v2<=2500 && v2>250) fractal = 1000;
   if(v2<=250 && v2>25) fractal = 100;
   if(v2<=25 && v2>12.5) fractal = 12.5;
   if(v2<=12.5 && v2>6.25) fractal = 12.5;
   if(v2<=6.25 && v2>3.125) fractal = 6.25;
   if(v2<=3.125 && v2>1.5625) fractal = 3.125;
   if(v2<=1.5625 && v2>0.390625) fractal = 1.5625;
   if(v2<=0.390625 && v2>0) fractal = 0.1953125;
// calculating our octave....
   range=(v2-v1); sum=MathFloor(MathLog(fractal/range)/MathLog(2));
   octave=fractal*(MathPow(0.5,sum)); mn=MathFloor(v1/octave)*octave;
   if((mn+octave)>v2)mx=mn+octave; mx=mn+(2*octave);
// calculating which octave fits best.....
//x2
    if( (v1>=(3*(mx-mn)/16+mn)) && (v2<=(9*(mx-mn)/16+mn)) )
    x2=mn+(mx-mn)/2;
    else x2=0;
//x1
    if( (v1>=(mn-(mx-mn)/8))&& (v2<=(5*(mx-mn)/8+mn)) && (x2==0) )
    x1=mn+(mx-mn)/2;
    else x1=0;
//x4
    if( (v1>=(mn+7*(mx-mn)/16))&& (v2<=(13*(mx-mn)/16+mn)) )
    x4=mn+3*(mx-mn)/4;
    else x4=0;
//x5
    if( (v1>=(mn+3*(mx-mn)/8))&& (v2<=(9*(mx-mn)/8+mn))&& (x4==0) )
    x5=mx;
    else x5=0;
//x3
    if( (v1>=(mn+(mx-mn)/8))&& (v2<=(7*(mx-mn)/8+mn))&& (x1==0) && (x2==0) && (x4==0) && (x5==0) )
    x3=mn+3*(mx-mn)/4;
    else x3=0;
//x6
    if( (x1+x2+x3+x4+x5) ==0 )
    x6=mx;
    else x6=0;
    finalH = x1+x2+x3+x4+x5+x6;
// calculating yy
//y1
    if( x1>0 )
    y1=mn;
    else y1=0;
//y2
    if( x2>0 )
    y2=mn+(mx-mn)/4;
    else y2=0;
//y3
    if( x3>0 )
    y3=mn+(mx-mn)/4;
    else y3=0;
//y4
    if( x4>0 )
    y4=mn+(mx-mn)/2;
    else y4=0;
//y5
    if( x5>0 )
    y5=mn+(mx-mn)/2;
    else y5=0;
//y6
    if( (finalH>0) && ((y1+y2+y3+y4+y5)==0) )
    y6=mn;
    else y6=0;
    finalL = y1+y2+y3+y4+y5+y6;
    for( i=0; i<OctLinesCnt; i++) {
         mml[i] = 0;
         }
// We now have our final Octave for the current timeframe.....
   dmml = (finalH-finalL)/8;Octv = finalH/(fractal/128);
   Comment("\n","TIMEFRAME","\n","HighClose = ",v2,"\n","LowClose = ",v1,"\n","Range = ",range,"\n","Fractal = ",fractal,"\n","OctMax = ",mx,"\n","OctMin = ",mn,"\n","MxMnRange = ",mx-mn,"\n","Octave 8/8ths = ",finalH,"\n","Octave 0/8ths = ",finalL,"\n","Octave 8ths = ",dmml);
   mml[0] =(finalL-dmml*2); //-2/8
   for( i=1; i<OctLinesCnt; i++) {
        mml[i] = mml[i-1] + dmml;
        }
   for( i=0; i<OctLinesCnt; i++ ){
        buff_str = "mml"+i;
        if(ObjectFind(buff_str) == -1) {
           ObjectCreate(buff_str, OBJ_HLINE, 0, Time[0], mml[i]);
           ObjectSet(buff_str, OBJPROP_STYLE, STYLE_SOLID);
           ObjectSet(buff_str, OBJPROP_WIDTH,2);
           ObjectSet(buff_str, OBJPROP_COLOR, mml_clr[i]);
           ObjectMove(buff_str, 0, Time[0],  mml[i]);
           }
        else {
           ObjectMove(buff_str, 0, Time[0],  mml[i]);
           }
        buff_str = "mml_txt"+i;
        if(ObjectFind(buff_str) == -1) {
           ObjectCreate(buff_str, OBJ_TEXT, 0, Time[mml_shft], mml_shft);
           ObjectSetText(buff_str, ln_txt[i], 10, "Arial", mml_clr[i]);
           ObjectMove(buff_str, 0, Time[mml_shft],  mml[i]);
           }
        else {
           ObjectMove(buff_str, 0, Time[mml_shft],  mml[i]);
           }
        } // for( i=1; i<=OctLinesCnt; i++ ){
   nTime    = Time[0]; CurPeriod= Period();
   }
  return(0);
  }
Comments