Tiki
Download script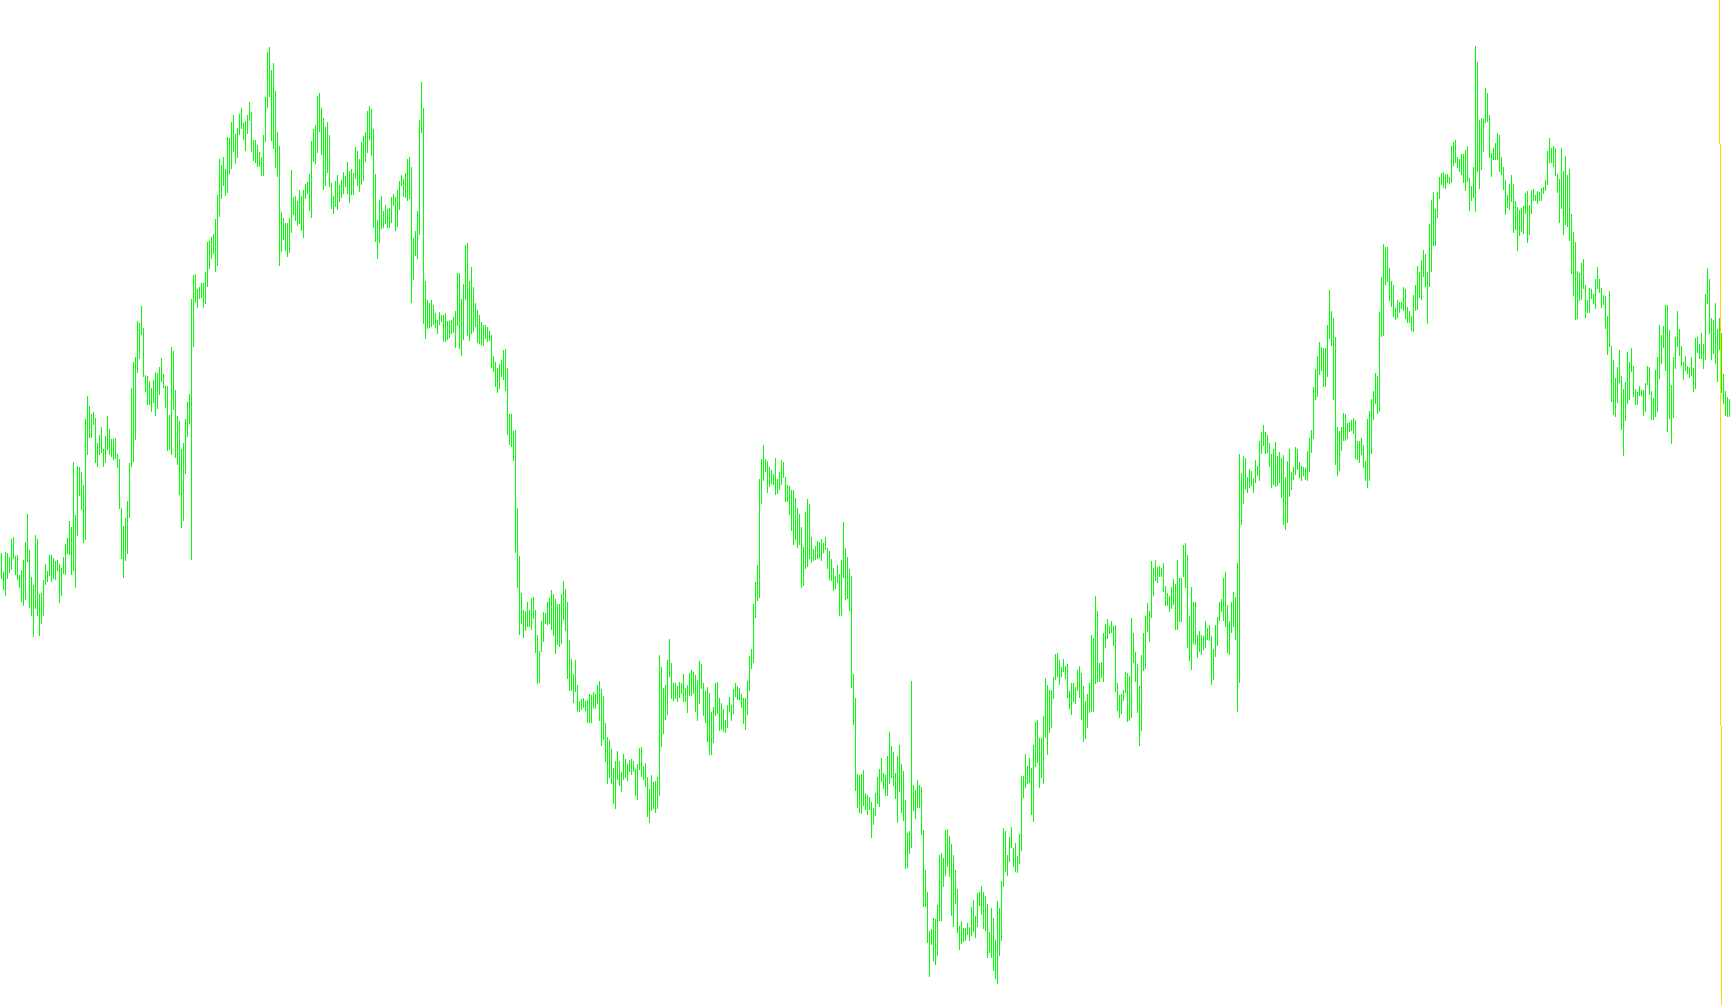
This tool is designed as a visual aid for traders to monitor real-time price movements within the MetaTrader platform. It functions by creating a dedicated window on your chart that tracks and displays a specific sequence of historical price data.
Core Functionality
The primary objective of this script is to capture the "heartbeat" of the market—the Bid price. It continuously monitors the current price and records it into a rolling history. Instead of just showing you where the price is at this exact second, it preserves a window of previous price points, allowing you to see how the market has transitioned over time.
How the Logic Works
To achieve this, the script operates through three main processes:
- Data Capture (The "Fill" Process): The tool constantly watches for any change in the current Bid price. Every time the price moves, the script identifies the new value and places it at the beginning of its memory bank. If the price remains static, the script waits until a movement occurs before updating.
- Historical Tracking (The "Shift" Process): This is the engine behind the visual history. Every time a new price point is captured, the tool pushes all previous data points forward by one position. Think of this like a moving conveyor belt: as a new price enters at the front, the older prices move back to make room.
- Visual Memory: The script maintains a specific depth of data (the "Deep" parameter). This ensures that the indicator doesn't just show you an infinite amount of history, but rather a focused, manageable segment of recent price action.
User Experience
When active on your platform, the script populates a separate sub-window. By constantly shifting and updating these values, it creates a continuous visual record of price fluctuations. This allows users to observe the progression of market trends and price "steps" more clearly than they might by looking at standard candlesticks alone.
//+------------------------------------------------------------------+
//|                                                                  |
//+------------------------------------------------------------------+
//---- indicator settings
#property  indicator_separate_window
#property  indicator_buffers 3
#property  indicator_color1  Red
#property  indicator_color2  Green
#property  indicator_color3  Blue
//---- indicator buffers
double     ExtBuffer0[];
double     ExtBuffer1[];
double     ExtBuffer2[];

       double Array[1000];
       int    Deep=120;
       int    Index=0, i, Z=0;
       double Current=0, tmp;

//+------------------------------------------------------------------+
//| Custom indicator initialization function                         |
//+------------------------------------------------------------------+
int init()
  {
//---- 2 additional buffers are used for counting.
   IndicatorBuffers(5);
//---- drawing settings
   SetIndexStyle(0,DRAW_LINE);
   SetIndexStyle(1,DRAW_NONE);
   SetIndexStyle(2,DRAW_NONE);
   IndicatorDigits(2);
   SetIndexDrawBegin(0,0);
   SetIndexDrawBegin(1,0);
   SetIndexDrawBegin(2,0);
//---- 3 indicator buffers mapping
   SetIndexBuffer(0,ExtBuffer0);
   SetIndexBuffer(1,ExtBuffer1);
   SetIndexBuffer(2,ExtBuffer2);
//---- name for DataWindow and indicator subwindow label
   IndicatorShortName("TT");
   SetIndexLabel(0,NULL);
   SetIndexLabel(1,NULL);
   SetIndexLabel(2,NULL);
//---- initialization done
   for(i=0;i<Deep;i++)
    {
     Array[i]=Bid;
    }
   return(0);
  }

//+------------------------------------------------------------------+
//|                                                                  |
//+------------------------------------------------------------------+

int fill()

{
 tmp=Bid;
 if (Current==tmp) {return(1);}
 if (tmp!=Current)
  {
   Array[0]=tmp;//-Current;
   Current=tmp;
  }
 for(i=0;i<Deep;i++)
  {
   ExtBuffer0[i]=Array[i];
  }
 return(0);
}
//-------------------------------------------------------------------------------------------------

//-- Shift ----------------------------------------------------------------------------------------
int shift()

{
 for (i=1;i<Deep;i++)
  {
   Array[i]=Array[i-1];
  }
 return(0);
}
//-------------------------------------------------------------------------------------------------


int start()
  {
   if (Current==0) {Current=Bid;}
   fill();
   shift();
   return(0);
  }
Comments