tmagiq
Download script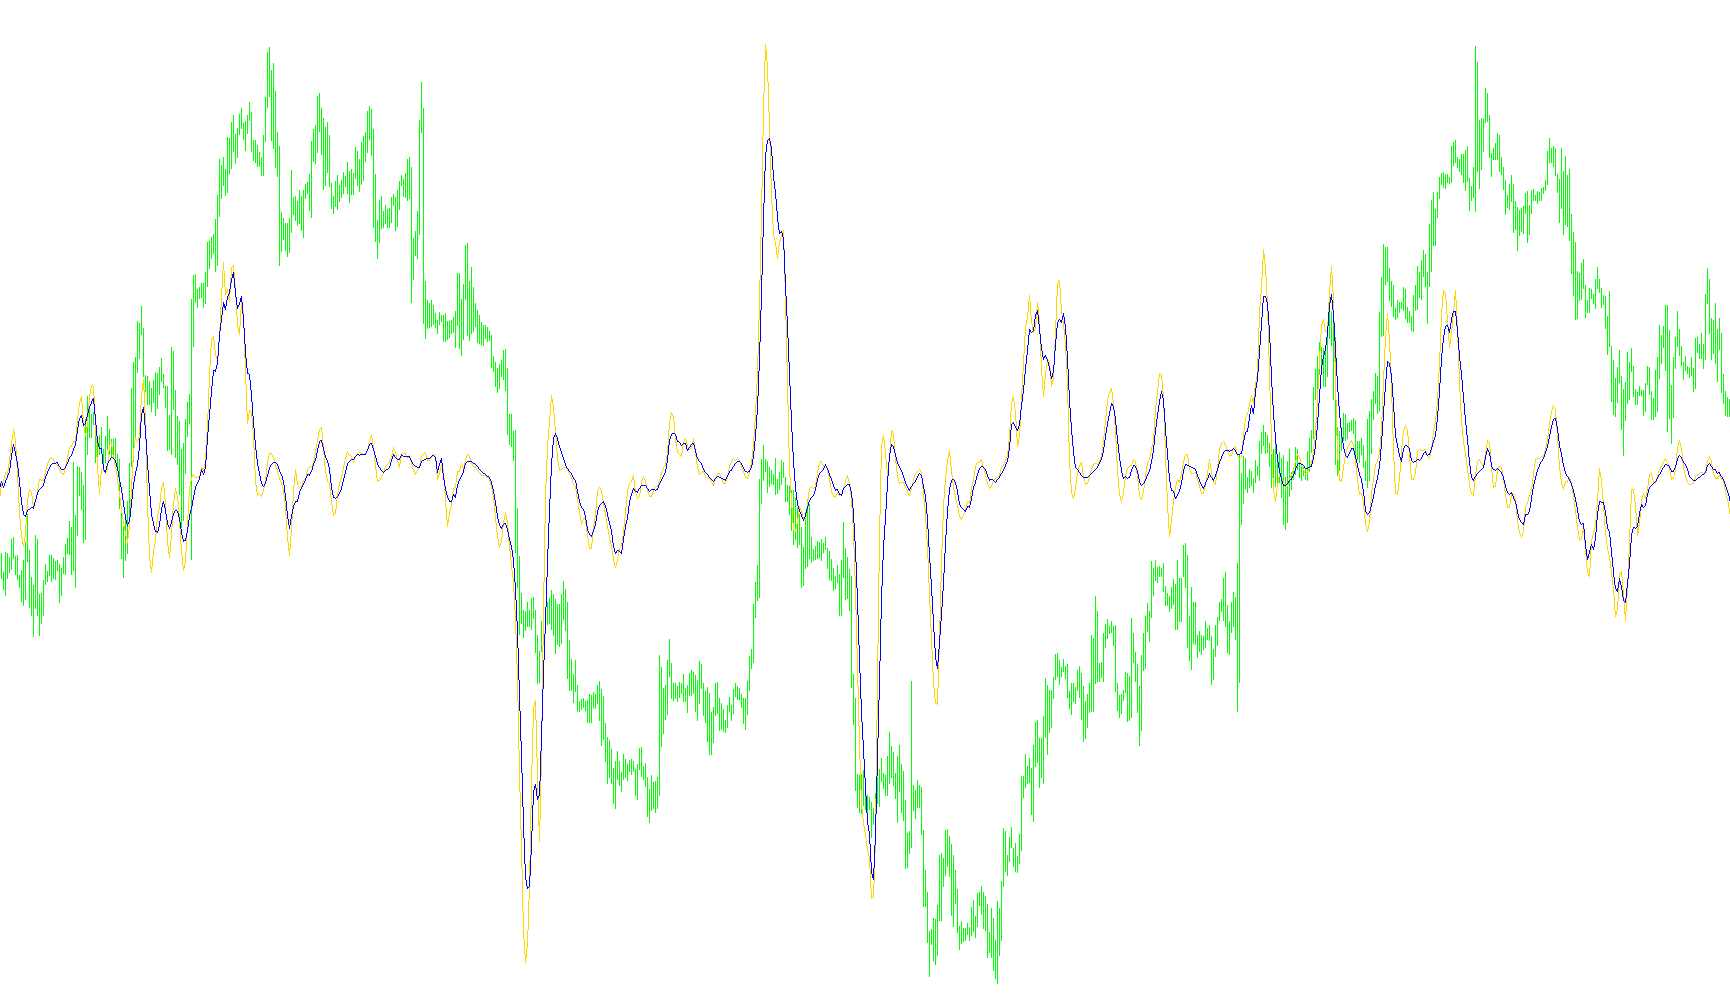
This technical indicator is designed to measure and visualize market volatility and momentum by analyzing the relationship between multiple moving averages. Instead of showing price directly, it provides a specialized view of how much "tension" or "spread" exists in the current market trend.
How the Logic Works
The tool operates through a multi-step calculation process:
1. Measuring Price Spread The script first looks at three different Simple Moving Averages (Fast, Mid, and Slow). It calculates the absolute distance between each of these averages. By adding these distances together, the indicator creates a single value that represents the "spread" or "expansion" of the price action. If the averages are bunched closely together, this value is low; if they are pulling away from each other, the value increases.
2. Factoring in Directional Strength To ensure the spread reflects actual market movement rather than just random noise, the script incorporates a "Directional Index" (ADX) component. It calculates the difference between upward and downward momentum. This result is used as a multiplier, effectively weighting the price spread by the current strength of the trend.
3. Smoothing the Data The raw results from the previous steps can often be jagged or "noisy," making it difficult to read clearly on a chart. To fix this, the script applies two additional smoothing layers:
- Simple Smoothing: A standard average that rounds out the peaks and valleys of the data.
- Linear Weighted Smoothing: A calculation that gives more importance to the most recent data points, helping the indicator react more quickly to recent changes in market behavior.
Visual Representation
The final output is displayed in a separate window below your main chart. It provides a visual representation of market activity where:
- Expansion suggests increasing volatility or a strengthening trend.
- Contraction suggests a cooling-off period, price consolidation, or a weakening trend.
By monitoring these fluctuations, users can better identify periods of high-intensity movement versus periods where the market is becoming stagnant.
//2009/8/18
//+------------------------------------------------------------------+
//| TMA.mq4 gaps
//+------------------------------------------------------------------+
#property copyright "Copyright (c) 2009"
#property indicator_separate_window
#property indicator_buffers 2
#property indicator_color1 Orange
#property indicator_color2 Gray
#property indicator_level1 0
#property indicator_levelstyle STYLE_SOLID
#property indicator_levelcolor Teal
//---- buffers
double Buf[];
double SG[];
double BS[];
//---- parameters
extern int FastMA=8;
extern int MidMA=16;
extern int SlowMA=25;
extern int SlowingSMA=3;
extern int SlowingLWMA=8;
//
string Unq="TMAG",Label;
int MAP;
//+------------------------------------------------------------------+
//| init
//+------------------------------------------------------------------+
int init()
{
	MAP=MathMax(SlowingSMA,SlowingLWMA);
	string sp1="("+FastMA+"/"+MidMA+"/"+SlowMA+")",sp2="("+SlowingSMA+","+SlowingLWMA+")";
	IndicatorBuffers(3);
	SetIndexBuffer(0,SG);SetIndexLabel(0,sp1);SetIndexDrawBegin(0,SlowMA+MAP);
	SetIndexBuffer(1,BS);SetIndexLabel(1,sp2);SetIndexDrawBegin(1,SlowMA+MAP);
	SetIndexBuffer(2,Buf);
	Label=Unq+sp1+">>A"+sp2;
	IndicatorShortName(Label);
	return(0);
}
//+------------------------------------------------------------------+
//| main
//+------------------------------------------------------------------+
int start()
{
	int cntbar=IndicatorCounted();
	int limit=Bars-cntbar;
	if(cntbar==0)limit-=SlowMA;
	for(int i=limit-1;i>=0;i--)
	{
		double ma1=iMA(NULL,0,FastMA,0,MODE_SMA,PRICE_CLOSE,i);
		double ma2=iMA(NULL,0,MidMA,0,MODE_SMA,PRICE_CLOSE,i);
		double ma3=iMA(NULL,0,SlowMA,0,MODE_SMA,PRICE_CLOSE,i);
		Buf[i]=MathAbs(ma1-ma2)+MathAbs(ma2-ma3)+MathAbs(ma1-ma3);
		double di=iADX(NULL,0,14,PRICE_HIGH,MODE_PLUSDI,i)-iADX(NULL,0,14,PRICE_LOW,MODE_MINUSDI,i);
		Buf[i]*=di/Point;
	}
	if(cntbar==0)limit-=MAP;
	for(i=limit-1;i>=0;i--)
	{
		SG[i]=iMAOnArray(Buf,0,SlowingSMA,0,MODE_SMA,i);
		BS[i]=iMAOnArray(Buf,0,SlowingLWMA,0,MODE_LWMA,i);
	}
   return(0);
}
//+------------------------------------------------------------------+
Comments