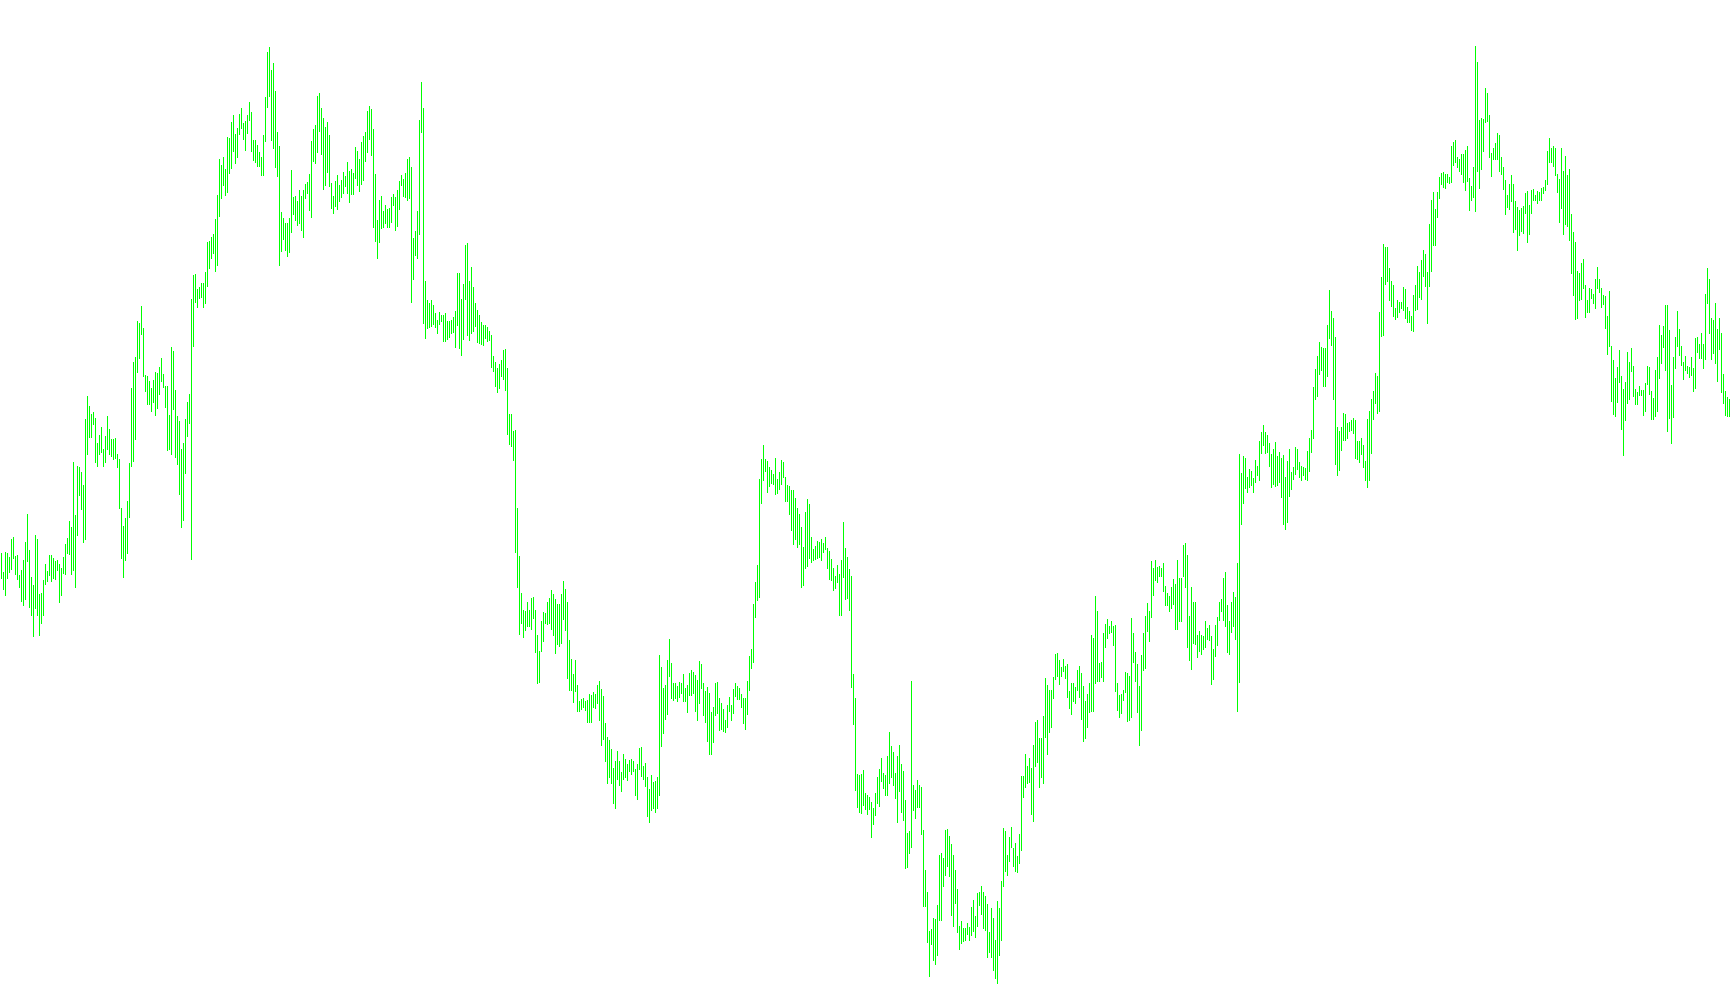
The Trend Intensity Index (TII) is a technical analysis tool designed to measure the strength and direction of a market trend. Instead of just showing you where the price is, this script helps identify how aggressively the market is moving in one direction versus another, allowing traders to determine when a trend is strong enough to follow or when it may be reaching a turning point.
How the Logic Works
The script functions by comparing current market prices against a long-term average to see if the market is "pulling away" from its mean. Here is the step-by-step breakdown of that logic:
1. Establishing the Baseline (The Major Trend) The script first calculates a "Moving Average." Think of this as the "fair value" or the center point of the market over a specific period (the default is 60 bars). This baseline helps the tool understand what the "normal" price should be, filtering out minor daily noise.
2. Measuring the Deviation Once the baseline is established, the script looks at the difference between the actual closing price and that moving average.
- If the price is above the average, it registers as a positive deviation (upward pressure).
- If the price is below the average, it registers as a negative deviation (downward pressure).
3. Calculating Intensity (The Minor Period) The script then focuses on a smaller window of recent data (the default is 30 bars) to see which "pressure" is winning. It sums up all the positive deviations and all the negative deviations within this window.
By comparing these two sums, it produces a final percentage score between 0 and 100:
- The Formula: It takes the total upward pressure and divides it by the difference between upward and downward pressure, then multiplies it by 100 to get a clear percentage.
How to Read the Results
The indicator provides a visual representation of market momentum based on the following rules:
- Trend Neutral (50): When the indicator is at 50, the market is balanced. There is no significant trend in either direction; upward and downward pressures are roughly equal.
- Uptrend (Above 50): As the value rises above 50, it indicates that upward pressure is dominating. The closer the number moves toward 100, the stronger the bull market becomes. A high TII suggests the trend is healthy and may continue in its current direction.
- Downtrend (Below 50): As the value drops below 50, it indicates that downward pressure is taking over. The closer the number moves toward 0, the stronger the bear market becomes.
Practical Application
The logic is designed to help a trader "ride the wave." When the TII shows a high intensity in one direction, it signals a strong trend where entry might be favorable. As the TII begins to lose momentum and move back toward the 50-level (the neutral zone), it serves as a warning that the current trend is weakening and may soon reverse, suggesting it might be time to exit a position or prepare for a move in the opposite direction.
/*-----------------------------+
|			       |
| Shared by www.Aptrafx.com    |
|			       |
+------------------------------*/

//+--------------------------------------------------------------------+
//|                                                   TII_RLH          |
//|                                    Copyright © 2006, Robert Hill   |
//|                                       http://www.metaquotes.net/   |
//|                                                                    |
//| Based on the formula developed by M. H. PEE                        |
//|                                                                    |
//| Trend Intensity Index.                                             |
//|                                                                    |
//| TII is used to indicate the strength of the current trend in the   |
//| market. The stronger the current trend, the more likely the        |
//| market will continue moving in the current direction.              |
//| It is recommended to enter the market during a strong trend        |
//| and ride it until TII shows signs of a reversal, at which time     |
//| you should abandon your position and prepare to enter in the       |
//| opposite direction.                                                |
//| Pee recommends using a major period of 60 and a minor period of 30.|
//| Assuming these setting, TII is calculated as follows.              |
//| The 60 bar simple moving average (MA) is computed.                 |
//| The deviation between the closing price and this computed average  |
//| for each of the last 30 bars is computed (CL - MA).                |
//| Positive deviations (CL > MA) are summed to give SDPOS.            |
//| Negative deviations (CL < MA) are summed to give SDNEG.            |
//| Then, the 30 period TII is calculated as:                          |
//|     100 * SDPOS / (SDPOS - SDNEG).                                 |
//| TII ranges from a lower limit of 0 to an upper limit of 100        |
//| A TII value above 50 signals an uptrend                            |
//| A TII value of 80 means that 80% of the total deviations are up    |
//| When TII fall below 50, a downtrend is likely in place             |
//| 50 represents a level that is trend-neutral                        |
//| The closer TII is to 100, the stronger the current uptrend         |
//| The closer TII is to 0, the stronger the current downtrend         |
//|                                                                    |
//+--------------------------------------------------------------------+
#property  copyright "Copyright © 2006, Robert Hill "
#property  link      "http://www.metaquotes.net/"

//---- indicator settings
#property  indicator_separate_window
#property  indicator_buffers 1
#property  indicator_color1  Red
#property  indicator_width1  2

extern int Major_Period = 60;
extern int Major_MaMode = 1; //0=sma, 1=ema, 2=smma, 3=lwma, 4=lsma
extern int Major_PriceMode = 0;//0=close, 1=open, 2=high, 3=low, 4=median(high+low)/2, 5=typical(high+low+close)/3, 6=weighted(high+low+close+close)/4
extern int Minor_Period = 30;
extern color LevelColor = Silver;
extern int BuyLevel = 20;
extern int MidLevel = 50;
extern int SellLevel = 80;

//---- buffers
double ma[];
double ma_dev[];
double tii[];


//+------------------------------------------------------------------+
//| Custom indicator initialization function                         |
//+------------------------------------------------------------------+
int init()
  {

//---- drawing settings
   IndicatorBuffers(3);

   SetIndexStyle(0,DRAW_LINE);
   SetIndexDrawBegin(0,Major_Period);
   IndicatorDigits(MarketInfo(Symbol(),MODE_DIGITS)+2);

//---- 3 indicator buffers mapping
   if(!SetIndexBuffer(0,tii) &&
      !SetIndexBuffer(1,ma_dev) &&
      !SetIndexBuffer(2,ma))
      Print("cannot set indicator buffers!");
//---- name for DataWindow and indicator subwindow label
   IndicatorShortName(" TII  ,  Major_Period ( "+Major_Period+" )  ,  Minor_Period  ( "+Minor_Period+" ), ");
   SetLevelStyle(STYLE_DASH,1,LevelColor);
   SetLevelValue(0,BuyLevel);
   SetLevelValue(1,MidLevel);
   SetLevelValue(2,SellLevel);

//---- initialization done
   return(0);
  }

//+------------------------------------------------------------------+
//| LSMA with PriceMode                                              |
//| PrMode  0=close, 1=open, 2=high, 3=low, 4=median(high+low)/2,    |
//| 5=typical(high+low+close)/3, 6=weighted(high+low+close+close)/4  |
//+------------------------------------------------------------------+

double LSMA(int Rperiod, int prMode, int shift)
{
   int i;
   double sum, pr;
   int length;
   double lengthvar;
   double tmp;
   double wt;

   length = Rperiod;

   sum = 0;
   for(i = length; i >= 1  ; i--)
   {
     lengthvar = length + 1;
     lengthvar /= 3;
     tmp = 0;
     switch (prMode)
     {
     case 0: pr = Close[length-i+shift];break;
     case 1: pr = Open[length-i+shift];break;
     case 2: pr = High[length-i+shift];break;
     case 3: pr = Low[length-i+shift];break;
     case 4: pr = (High[length-i+shift] + Low[length-i+shift])/2;break;
     case 5: pr = (High[length-i+shift] + Low[length-i+shift] + Close[length-i+shift])/3;break;
     case 6: pr = (High[length-i+shift] + Low[length-i+shift] + Close[length-i+shift] + Close[length-i+shift])/4;break;
     }
     tmp = ( i - lengthvar)*pr;
     sum+=tmp;
    }
    wt = sum*6/(length*(length+1));

    return(wt);
}

int start()
{
   int i,j,  limit;
   double sdPos, sdNeg;
   int    counted_bars=IndicatorCounted();
   if(counted_bars>0) counted_bars--;
   limit=Bars-counted_bars;

   for(i = limit; i >= 0; i--)
   {
      if (Major_MaMode == 4)
      {
         ma[i] = LSMA(Major_Period, Major_PriceMode, i);
      }
      else
      {
       ma[i] = iMA(NULL,0,Major_Period,0,Major_MaMode,Major_PriceMode,i);
      }
      ma_dev[i] = Close[i] - ma[i];
   }


//========== COLOR CODING ===========================================

   for(i = 0; i <=limit; i++)
   {
       sdPos = 0;
       sdNeg = 0;
       for (j=i;j<i+Minor_Period;j++)
       {
          if (ma_dev[j] >= 0) sdPos = sdPos + ma_dev[j];
          if (ma_dev[j] < 0) sdNeg = sdNeg + ma_dev[j];
       }
       tii[i] = 100 * sdPos/(sdPos - sdNeg);
   }

   return(0);
}
//+------------------------------------------------------------------+
Comments