TIME1_GMTplus2
Download script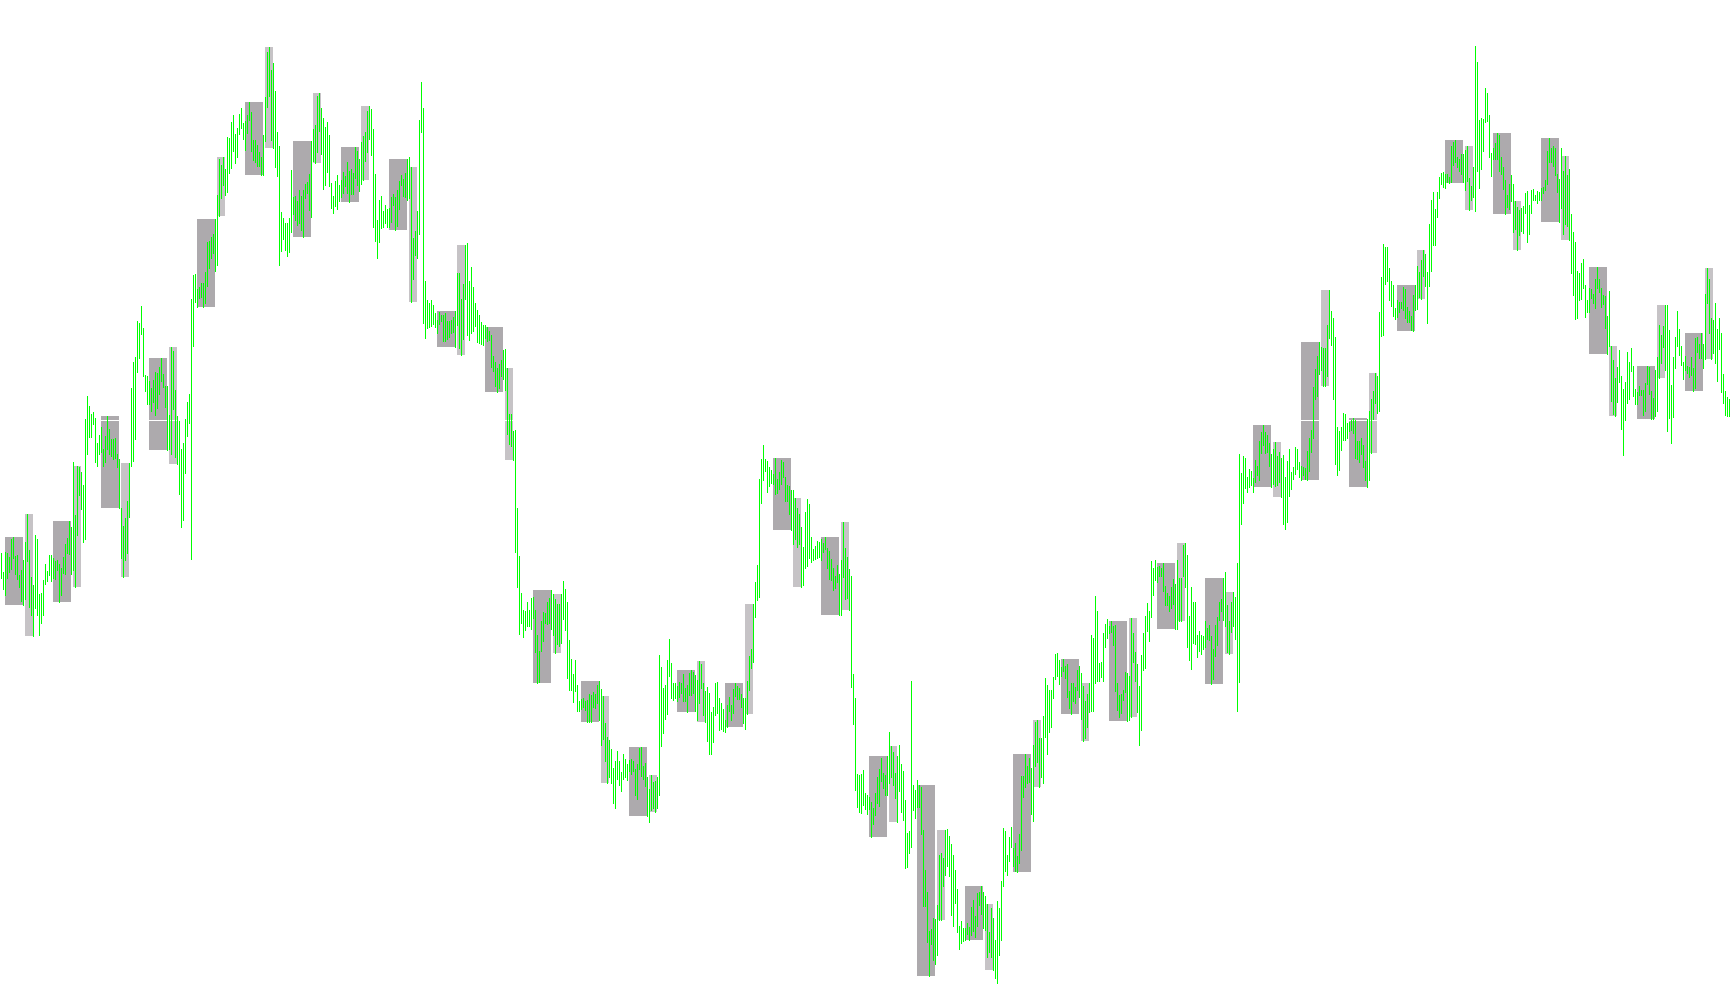
This tool is designed to enhance your trading visual experience by clearly marking the different global trading sessions directly on your price chart. By transforming the abstract concept of "market hours" into visible, shaded zones, it helps traders identify high-volatility periods and key session transitions at a glance.
How the Logic Works
The script functions by automatically identifying and drawing rectangular highlights over specific timeframes for the following three major markets:
- Asia Session: Highlighted in Dark Gray.
- Europe Session: Highlighted in Silver.
- USA Session: Highlighted in Gray.
Key Features and Behavior
1. Automated Time Mapping Instead of you having to manually draw lines or boxes, the script calculates the start and end times for each session based on your settings. It looks at the current date and "paints" the background of the chart to show exactly when one market is active and another is ending.
2. Historical Visualization The tool doesn't just show you today’s session; it automatically projects these zones backward across a user-defined number of days (defaulting to 50 days). This allows you to see historical patterns, helping you recognize how price action behaved during specific sessions in the past.
3. Dynamic Price Scaling To ensure the highlights are useful for analysis, the script intelligently calculates the highest and lowest prices reached during each specific session period. It then stretches the rectangular boxes to cover that price range, creating a "box" effect that encapsulates the market's movement for those hours.
4. Smart Calendar Awareness The logic includes a specialized calendar handler. This ensures that the drawing process skips over non-trading days (like weekends) and correctly calculates date transitions, ensuring that the colored zones remain continuous and accurate as they move from one trading day to the next.
Summary for the Trader
Essentially, this script acts as a visual overlay that cleans up your chart's "time geography." By providing a constant visual cue of which market is currently "open," it allows you to focus on price action while immediately knowing the prevailing global context of the current trading environment.
//+------------------------------------------------------------------+
//|                                                        times.mq4 |
//|                                                                  |
//|               Made/Modified by sh _j .                           |
//+------------------------------------------------------------------+
#property copyright "Morning Star"
#property link      "http://Grand Forex.ir"

#property indicator_chart_window


extern int    NumberOfDays = 50;
extern string AsiaBegin    = "00:00";
extern string AsiaEnd      = "09:59";
extern color  AsiaColor    = DarkGray;
extern string EurBegin     = "10:00";
extern string EurEnd       = "14:59";
extern color  EurColor     = Silver;
extern string USABegin     = "15:00";
extern string USAEnd       = "23:59";
extern color  USAColor     = Gray;


//+------------------------------------------------------------------+
//| Custom indicator initialization function                         |
//+------------------------------------------------------------------+
void init() {
  DeleteObjects();
  for (int i=0; i<NumberOfDays; i++) {
    CreateObjects("AS"+i, AsiaColor);
    CreateObjects("EU"+i, EurColor);
    CreateObjects("US"+i, USAColor);
  }
  Comment("");
}

//+------------------------------------------------------------------+
//| Custor indicator deinitialization function                       |
//+------------------------------------------------------------------+
void deinit() {
  DeleteObjects();
  Comment("");
}


void CreateObjects(string no, color cl) {
  ObjectCreate(no, OBJ_RECTANGLE, 0, 0,0, 0,0);
  ObjectSet(no, OBJPROP_STYLE, STYLE_SOLID);
  ObjectSet(no, OBJPROP_COLOR, cl);
  ObjectSet(no, OBJPROP_BACK, True);
}

//+------------------------------------------------------------------+
//| Óäàëåíèå îáúåêòîâ èíäèêàòîðà                                     |
//+------------------------------------------------------------------+
void DeleteObjects() {
  for (int i=0; i<NumberOfDays; i++) {
    ObjectDelete("AS"+i);
    ObjectDelete("EU"+i);
    ObjectDelete("US"+i);
  }
}

//+------------------------------------------------------------------+
//| Custom indicator iteration function                              |
//+------------------------------------------------------------------+
void start() {
  datetime dt=CurTime();

  for (int i=0; i<NumberOfDays; i++) {
    DrawObjects(dt, "AS"+i, AsiaBegin, AsiaEnd);
    DrawObjects(dt, "EU"+i, EurBegin, EurEnd);
    DrawObjects(dt, "US"+i, USABegin, USAEnd);
    dt=decDateTradeDay(dt);
    while (TimeDayOfWeek(dt)>5) dt=decDateTradeDay(dt);
  }
}


void DrawObjects(datetime dt, string no, string tb, string te) {
  datetime t1, t2;
  double   p1, p2;
  int      b1, b2;

  t1=StrToTime(TimeToStr(dt, TIME_DATE)+" "+tb);
  t2=StrToTime(TimeToStr(dt, TIME_DATE)+" "+te);
  b1=iBarShift(NULL, 0, t1);
  b2=iBarShift(NULL, 0, t2);
  p1=High[Highest(NULL, 0, MODE_HIGH, b1-b2, b2)];
  p2=Low [Lowest (NULL, 0, MODE_LOW , b1-b2, b2)];
  ObjectSet(no, OBJPROP_TIME1 , t1);
  ObjectSet(no, OBJPROP_PRICE1, p1);
  ObjectSet(no, OBJPROP_TIME2 , t2);
  ObjectSet(no, OBJPROP_PRICE2, p2);
}


datetime decDateTradeDay (datetime dt) {
  int ty=TimeYear(dt);
  int tm=TimeMonth(dt);
  int td=TimeDay(dt);
  int th=TimeHour(dt);
  int ti=TimeMinute(dt);

  td--;
  if (td==0) {
    tm--;
    if (tm==0) {
      ty--;
      tm=12;
    }
    if (tm==1 || tm==3 || tm==5 || tm==7 || tm==8 || tm==10 || tm==12) td=31;
    if (tm==2) if (MathMod(ty, 4)==0) td=29; else td=28;
    if (tm==4 || tm==6 || tm==9 || tm==11) td=30;
  }
  return(StrToTime(ty+"."+tm+"."+td+" "+th+":"+ti));
}
//+------------------------------------------------------------------+
Comments