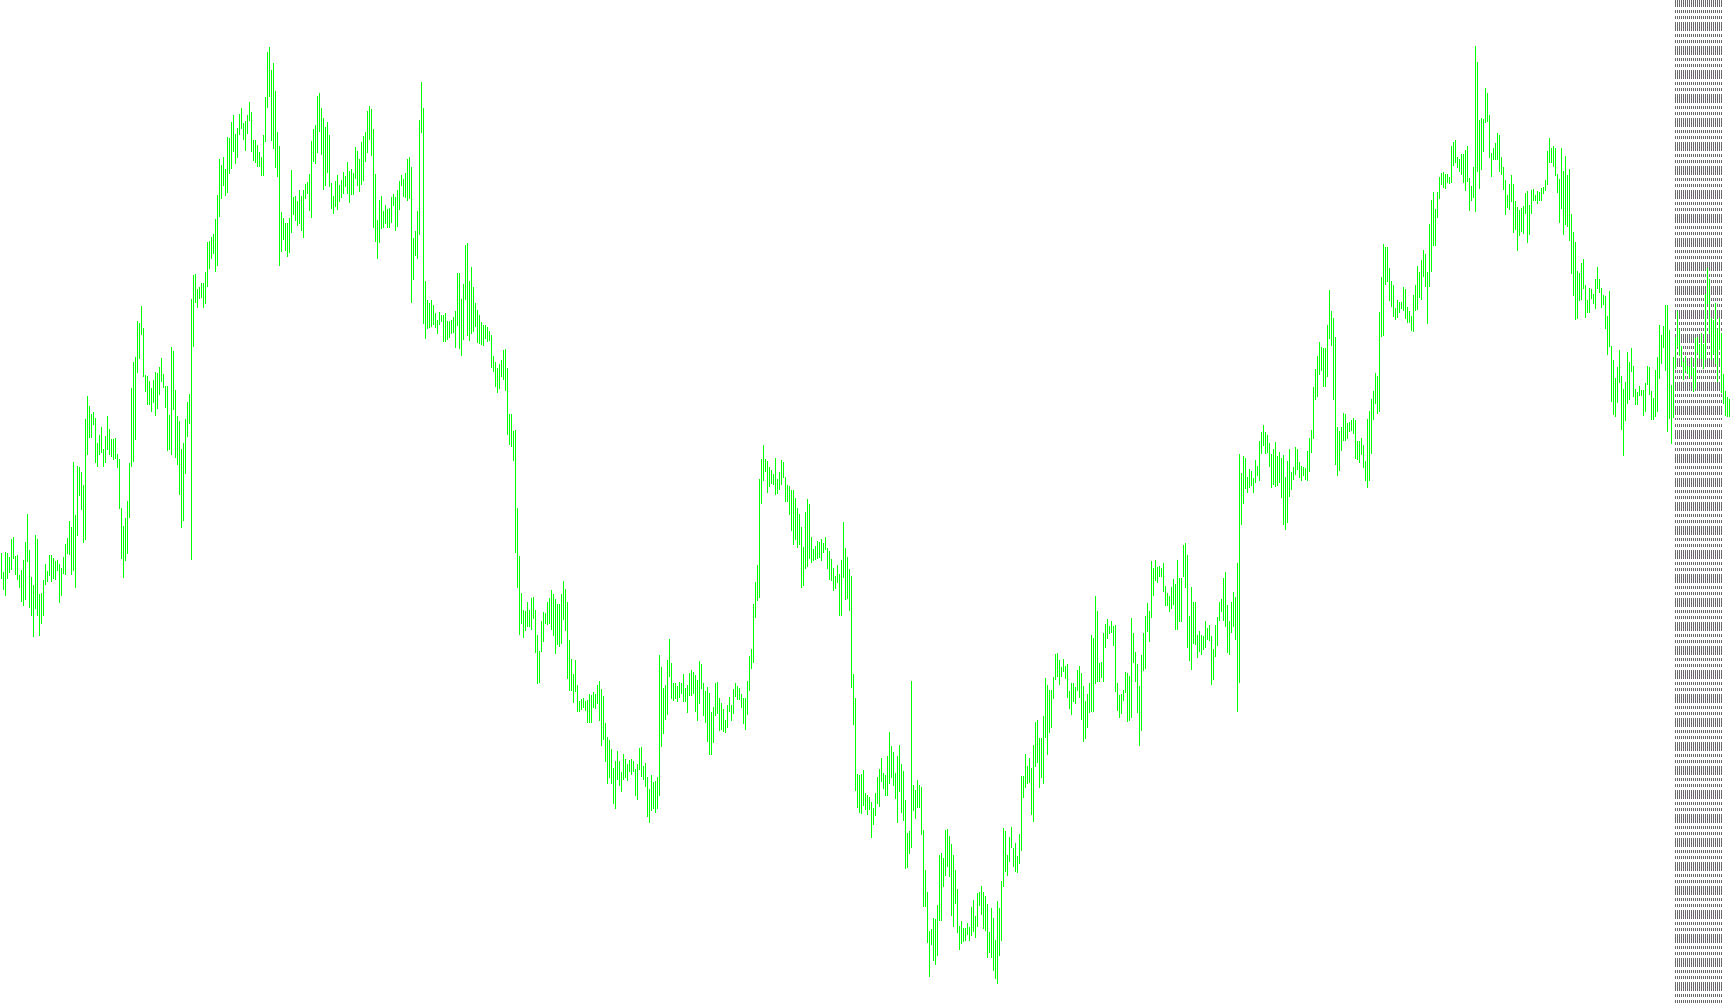
This tool is designed as a visual aid for traders who need to clearly identify specific time boundaries on their trading charts. Its primary purpose is to automatically draw vertical lines at regular intervals, helping you visualize the start of new hours or periods without having to manually plot them.
How it Works
The script analyzes your current chart and looks back at a specific number of past bars (which you can customize). It then identifies the exact moment a new time period begins based on a timeframe setting you choose—for example, it can be set to mark every hour or every day.
For every identified interval, the tool places a vertical line on your screen. Because it calculates these positions automatically, it ensures that the markings are consistent and mathematically accurate according to the market's clock.
Key Features & Customization
The script offers several ways to tailor the visual experience to fit your specific trading style:
- Timeframe Selection: You can choose which specific time interval you want to highlight (e.g., marking every 60 minutes).
- Visual Styling: You have full control over the aesthetic of the lines, including their color, thickness, and style (such as solid, dashed, or dotted lines).
- Background Placement: You can choose whether the lines appear on top of the price candles or stay in the background so they don't obstruct your view of the price action.
- Historical Depth: You can define how far back into the past the script should go to draw these lines, allowing you to see previous session boundaries at a glance.
Summary for Traders
Essentially, this is an organizational tool. It cleans up your workspace by providing a clear "grid" of time. By knowing exactly when one hour ends and the next begins, it helps you better track session changes, identify recurring patterns at specific times of the day, and maintain a more organized perspective on market movements.
//+------------------------------------------------------------------+
//|                                                      Time_H1.mq4 |
//|                                                     Yuriy Tokman |
//|                                            yuriytokman@gmail.com |
//+------------------------------------------------------------------+
#property copyright "Yuriy Tokman"
#property link      "yuriytokman@gmail.com"

#property indicator_chart_window


extern int     TF = 60;

extern color   LineColir = DimGray;
extern int     LineStyle = 4;
extern int     LineWidth = 1;

extern bool    LineOnBckgrnd = true;
extern int     barsToProcess = 24;

extern string  TimeFrames = "M1;5,15,30,60H1;240H4;1440D1;10080W1;43200MN";
extern string  LineStyles = "line0 dash1 dot2 dashdot3 dashdotdot4";

string name;

//+------------------------------------------------------------------+
//| Custom indicator initialization function                         |
//+------------------------------------------------------------------+
int init()
  {
//---- indicators
//----
   return(0);
  }
//+------------------------------------------------------------------+
//| Custom indicator deinitialization function                       |
//+------------------------------------------------------------------+
int deinit()
  {
//----
   int i;


   for (i=0;i<Bars;i++)
    {
    ObjectDelete(name+DoubleToStr(i,0));
    }
//----
   return(0);
  }
//+------------------------------------------------------------------+
//| Custom indicator iteration function                              |
//+------------------------------------------------------------------+
int start()
  {
   int    counted_bars=IndicatorCounted(),
//----
   limit,
   i=0;
   if(counted_bars>0)
      counted_bars--;

   limit=Bars-counted_bars;

   if(limit>barsToProcess)
      limit=barsToProcess;


      name = "TimeVLine M" +TF +" "+DoubleToStr(i,0);

   while (i<limit)
   {
      datetime t = iTime(NULL,TF,i)+60*TF;
      if (t>0)
       {
        ObjectCreate (name +DoubleToStr(i,0),OBJ_VLINE,0,t,0);
        ObjectSet    (name +DoubleToStr(i,0),OBJPROP_STYLE,LineStyle);
        ObjectSet    (name +DoubleToStr(i,0),OBJPROP_COLOR,LineColir);
        ObjectSet    (name +DoubleToStr(i,0),OBJPROP_WIDTH,LineWidth);
        ObjectSet    (name +DoubleToStr(i,0),OBJPROP_BACK, LineOnBckgrnd);
//      ObjectSet    (name +DoubleToStr(i,0),OBJPROP_TIMEFRAMES,NULL);
       }
     i++;
   }
//----
   return(0);
  }
//+------------------------------------------------------------------+
Comments