Tick_Power
Download script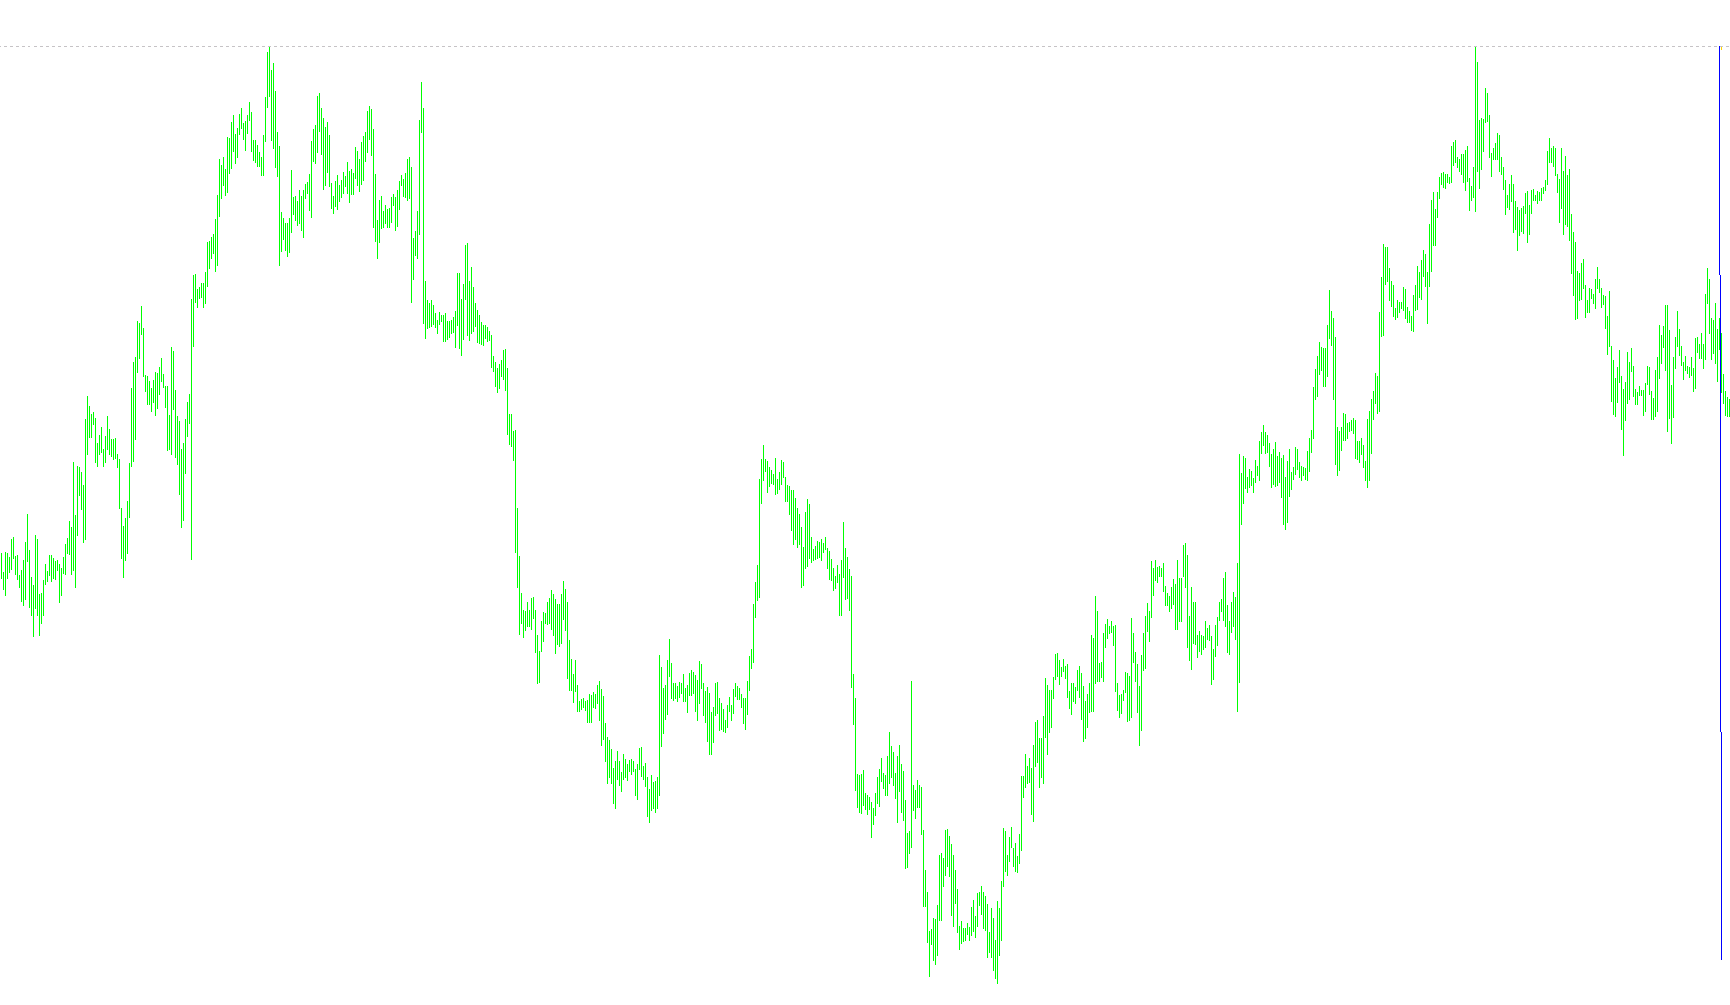
This tool is designed to monitor and visualize the underlying speed and behavior of price movements within the market. Rather than focusing on standard price levels like Support or Resistance, it analyzes the "heartbeat" of the market by looking at individual price updates (ticks).
How the Logic Works
The script tracks every single movement of the current market price. It identifies three primary components to provide a comprehensive view of market activity:
1. Price Direction and Movement Tracking The tool monitors the difference between the current price and the previous price update.
- If the price moves up, it calculates the positive progression.
- If the price moves down, it tracks the negative movement.
- By doing this, the tool creates a visual history of the "momentum" or the velocity at which the price is traveling.
2. Velocity and Volatility Analysis The logic distinguishes between the raw change in price and the cumulative direction of those changes. By calculating these values simultaneously, the indicator allows users to see how aggressively the market is reacting in real-time, represented visually on your chart as a histogram and a line graph.
3. Time Frequency (Tick Speed) One of the core functions of this script is measuring time. It calculates the exact number of milliseconds between each price change.
- It maintains a history of these time intervals to determine how fast "ticks" are occurring.
- It provides an Average Tick Time, which tells you how quickly the market is updating on average over a specific period (customizable by the user).
What This Means for the Trader
Instead of just seeing where the price is, this tool helps you see how fast it is moving. By providing the Average Tick Time and real-time velocity tracking, it helps you understand:
- Market Activity: Is the market "lively" with constant small movements, or is it "heavy" with slow, deliberate moves?
- Reaction Speed: How many seconds does it typically take for a new price to form?
- Momentum Flow: You can visually see the strength of the current trend based on the intensity of the calculated price movements.
In short, this script acts as a speedometer for the market, translating raw data into a visual representation of market urgency and flow.
//+------------------------------------------------------------------+
//|                                                     Ticks v1.mq4 |
//|                                                      Nicholishen |
//|                                              www.tradingintl.com |
//+------------------------------------------------------------------+
#property copyright "Nicholishen"
#property link      "www.tradingintl.com"

#property indicator_separate_window
//#property indicator_minimum -100
//#property indicator_maximum 100
#property indicator_buffers 2

//#property indicator_color1 Lime
#property indicator_color1 Yellow
#property indicator_color2 Purple
//---- buffers
extern int TicksToAvg=20;
double ExtMapBuffer1[],ExtMapBuffer2[];
int bar;int LastTick,tt;
int Range[50];
double vv,pv,ff,LastAsk,ticks;
//+------------------------------------------------------------------+
//| Custom indicator initialization function                         |
//+------------------------------------------------------------------+
int init()
  {
//---- indicators
 //  ArrayInitialize(ExtMapBuffer1,0.0);
    SetIndexStyle(0,DRAW_HISTOGRAM);
    SetIndexStyle(1,DRAW_LINE);
   // SetIndexStyle(1,DRAW_HISTOGRAM);
    SetIndexBuffer(0,ExtMapBuffer1);
    SetIndexBuffer(1,ExtMapBuffer2);
   // SetIndexBuffer(0,Vol);
//----
   SetLevelValue(0,0);
   return(0);
  }
//+------------------------------------------------------------------+
//| Custom indicator deinitialization function                       |
//+------------------------------------------------------------------+
int deinit()
  {
//----

//----
   return(0);
  }
//+------------------------------------------------------------------+
//| Custom indicator iteration function                              |
//+------------------------------------------------------------------+
int start()
  {
  int avg;
   int    counted_bars=IndicatorCounted();
//----
   if(bar!=Bars){ff=0;pv=0;vv=0;bar=Bars;}

   for(int i=0; i<1;i++){
      if(LastAsk!=0){
         if(Ask>LastAsk){vv=vv+1*Point;ff=ff+1*Point;pv=pv+(Ask-LastAsk);}
         else if(Ask<LastAsk){vv=vv+1*Point;ff=ff-1*Point;pv=pv-(LastAsk-Ask);}

      }

      //if(ticks<=2)ff=0;
      ExtMapBuffer1[i]=ff;
      ExtMapBuffer2[i]=pv;
     // Vol[i]=vv;
   }
   ticks++;
   //Tick[0]=ticks;

   int Tick=GetTickCount();
   if(Ask!=LastAsk){
      tt++;
      for(i=49;i>0;i--){
         Range[i]=Range[i-1];
      }
      Range[0]=Tick-LastTick;
   }
   if(tt>TicksToAvg){
      for(i=0;i<TicksToAvg;i++){
         avg+=Range[i];
      }
      int av2=avg/TicksToAvg;
   }
   Comment("\n","Ticks (",ticks,")  ",(Tick-LastTick)*0.001," seconds","\n","Average Tick Time [",TicksToAvg,"] :",av2*0.001," S");
//----
   LastTick=Tick;
   LastAsk=Ask;
   //if(!init){
   return(0);
  }
//+------------------------------------------------------------------+
Comments