test bars 5_v1
Download script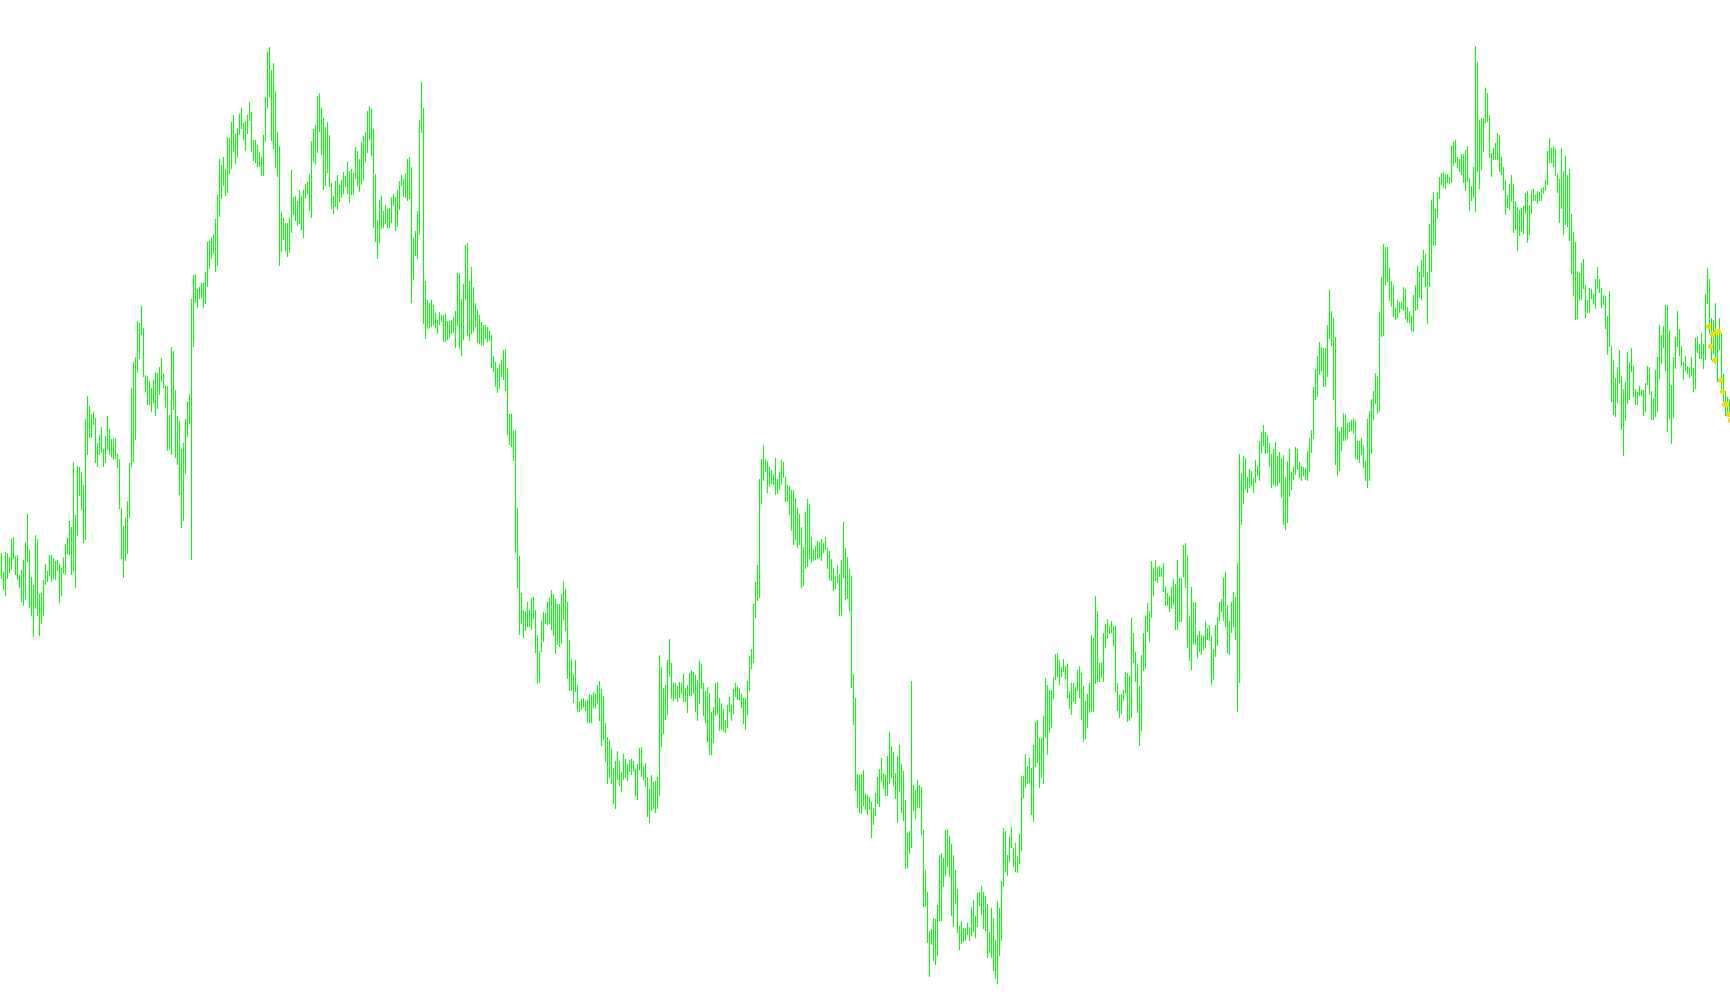
This technical indicator is designed to visualize specific price data points directly on your trading chart. By analyzing the relationship between historical price movement and established parameters, it provides a visual overlay to help traders identify significant market data.
Core Functionality
The primary objective of this script is to map price information onto the chart using distinct visual markers (arrows). It operates by scanning the price history and identifying key coordinates based on the closing prices of previous candles.
Key Logic Components
- Data Mapping: The script monitors the closing price of each candle in a sequence. It systematically records these prices into internal memory buffers, which are then translated into visual markers on your screen.
- Visual Representation: Instead of drawing continuous lines, the tool uses specific symbols (arrows) to highlight data points. This allows for a cleaner chart interface where only the most relevant price information is brought to the forefront.
- Buffer Management: The logic includes a management system to ensure that the indicator calculates correctly as new candles form. It handles "counted bars"—a process that tells the software how much of the chart it needs to update, ensuring the visual markers remain synced with real-time price movement.
- Initialization & Setup: Upon being added to a chart, the script automatically configures its display properties, such as color and symbol type, ensuring it integrates seamlessly with your existing visual setup without requiring complex manual configuration.
How It Appears on Your Chart
When active, the indicator populates the chart with white arrows. These markers serve as visual anchors, representing specific price levels captured by the script's logic. This allows a trader to see historical price "snapshots" clearly, facilitating a better understanding of where the market has closed during previous periods.
//+------------------------------------------------------------------+
//| test 5.mq4                                                       |
//+------------------------------------------------------------------+
#property copyright "Ron T"
#property link      "http://www.lightpatch.com"

// in chart window, or seperate window
#property indicator_chart_window

// buffer allocation and color for lines
#property indicator_buffers 2
#property indicator_color1 White
#property indicator_color2 White

// actual buffer array
double ExtMapBuffer1[];
double ExtMapBuffer2[];

// ???
int ExtCountedBars=0;

// external user input (CHECK FOR ERRORS!!)
extern double indChange=0.01;


//+------------------------------------------------------------------+
//| Custom indicator init                                            |
//|------------------------------------------------------------------|
int init()
  {

   // line properties

   SetIndexStyle(0,DRAW_ARROW);
   SetIndexBuffer(0, ExtMapBuffer1);
   SetIndexArrow(0,159);

   SetIndexStyle(1,DRAW_ARROW);
   SetIndexBuffer(1, ExtMapBuffer2);
   SetIndexArrow(1,159);

   return(0);
  }


//+------------------------------------------------------------------+
//| Custor indicator deinit function                                 |
//+------------------------------------------------------------------+
int deinit()
   {
   return(0);
   }


//+------------------------------------------------------------------+
//| Custom indicator iteration function                              |
//+------------------------------------------------------------------+
int start()
  {
     double sum=0;
     double oldsum=0;
     double change=0;
     double hitot=0;         // must start at lowest point
     double lotot=9999;      // must start at highest point

     int    i;
     int pos=5;

   if(Bars<=10) return(0);
   ExtCountedBars=IndicatorCounted();
   if (ExtCountedBars<0) return(-1);
   if (ExtCountedBars>0) ExtCountedBars--;

   while ( pos >= 0 )
      {
      ExtMapBuffer1[pos]=Close[pos];
      pos--;
      }


//---- zero initial bars
   if(ExtCountedBars<1)
      {
      for(i=1;i<5;i++) ExtMapBuffer1[Bars-i]=0;
      for(i=1;i<5;i++) ExtMapBuffer2[Bars-i]=0;
      }


   return(0);
  }

//+------------------------------------------------------------------+
Comments