test last 100_v1
Download script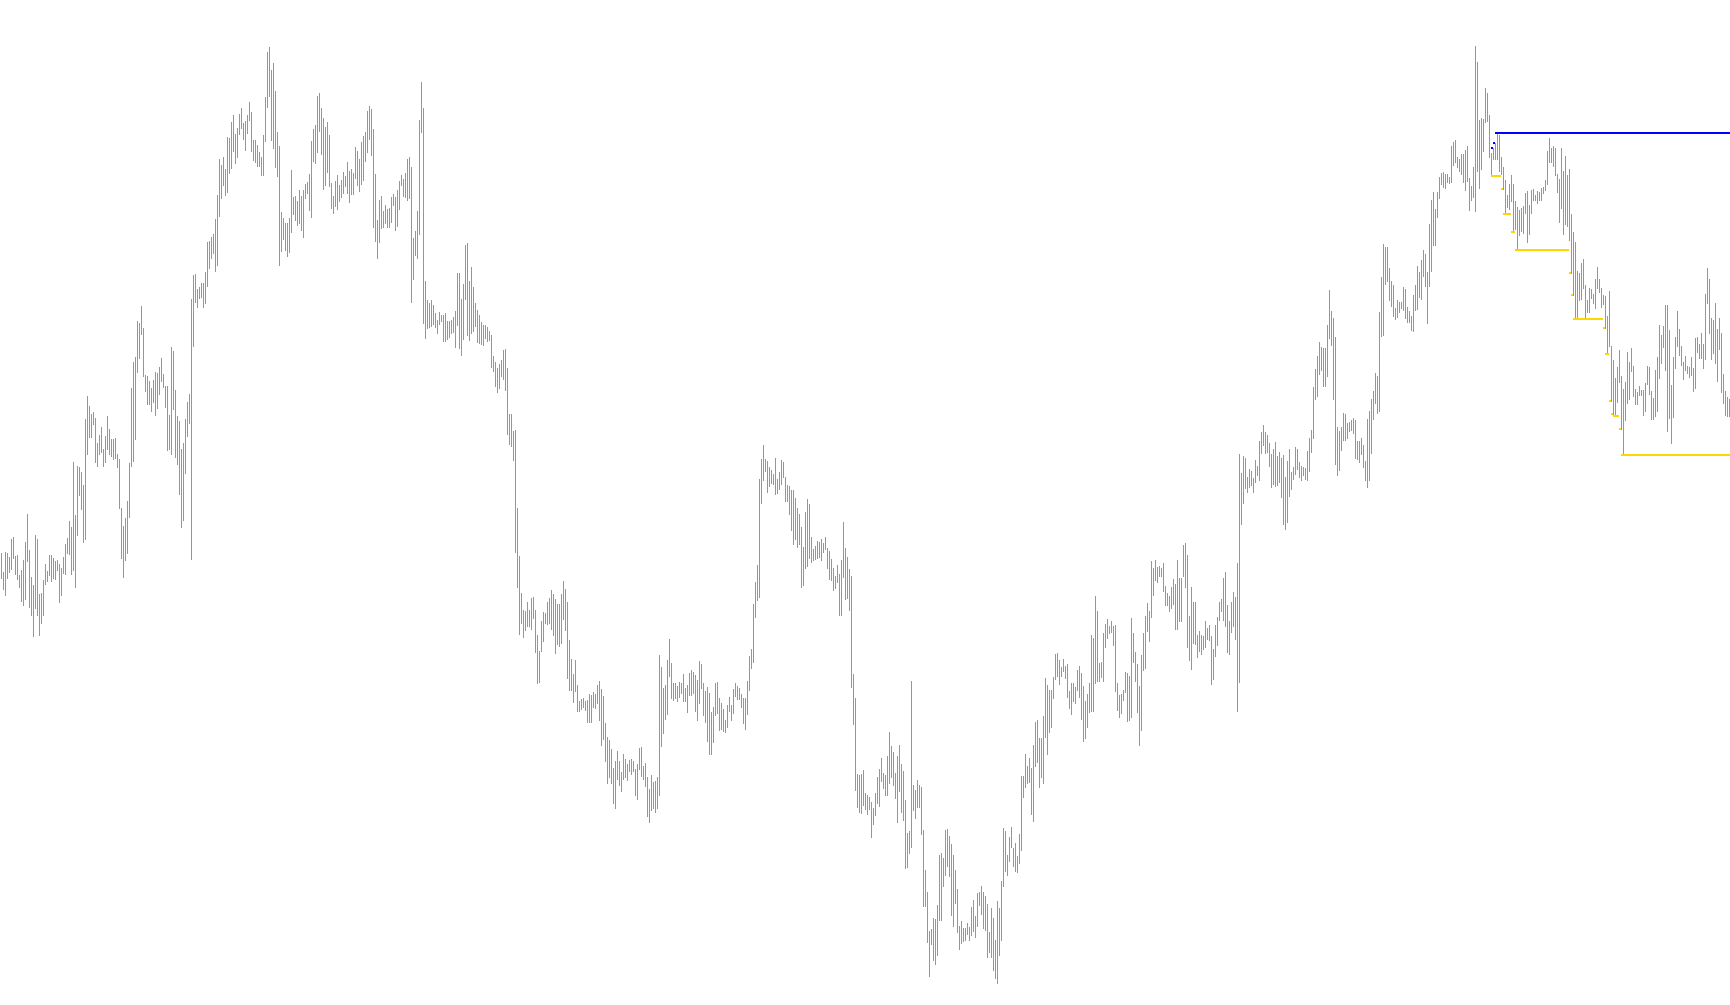
This tool is designed to provide visual clarity on price action by identifying specific historical boundaries within a set timeframe. Instead of following every minor fluctuation in the market, this script focuses on defining the absolute extreme highs and lows over a designated period.
Core Functionality
The logic operates by scanning back through a fixed number of price bars (the lookback period) to identify the "ceiling" and "floor" of that specific timeframe.
- Boundary Identification: The script constantly monitors the highest point reached and the lowest point hit during its designated window.
- Dynamic Tracking: As new candles form, the script updates these boundaries in real-time. If the price breaks above the previous high or below the previous low within that timeframe, the tool automatically adjusts the boundary to reflect the new extreme.
- Visual Representation: These extremes are plotted on your chart as distinct markers. This allows you to see at a glance where the most significant price expansion occurred during the recent period, helping to separate significant structural movements from minor noise.
How it Works for the Trader
The script essentially "scans" the history for you. Rather than having to manually look back and determine what the highest or lowest price was over the last 120 candles, the indicator does this automatically. It creates a visual map of the price territory:
- High Boundary: It identifies the peak reached during the period.
- Low Boundary: It identifies the bottom reached during the period.
By highlighting these two critical levels, the tool helps traders identify zones of potential resistance and support based on the actual extremes of recent market activity.
/*-----------------------------+
|			       |
| Shared by www.Aptrafx.com    |
|			       |
+------------------------------*/

//+------------------------------------------------------------------+
//|                                           MultiMovingAverage.mq4 |
//+------------------------------------------------------------------+
#property copyright "Ron T"
#property link      "http://www.lightpatch.com"

//in chart or out of chart
#property indicator_chart_window

// buffer allocation and color
#property indicator_buffers 2
#property indicator_color1 White
#property indicator_color2 Red

// actual line buffers
double ExtMapBuffer1[];
double ExtMapBuffer2[];


//+------------------------------------------------------------------+
//| Custom indicator init function                                   |
//|------------------------------------------------------------------|
int init()
   {
   SetIndexStyle(0,DRAW_ARROW);
   SetIndexBuffer(0, ExtMapBuffer1);
   SetIndexArrow(0,158);

   SetIndexStyle(1,DRAW_ARROW);
   SetIndexBuffer(1, ExtMapBuffer2);
   SetIndexArrow(1,158);

   return(0);
   }


//+------------------------------------------------------------------+
//| Custor indicator deinitialization function                       |
//+------------------------------------------------------------------+
int deinit()
   {
   return(0);
   }


//+------------------------------------------------------------------+
//| Custom indicator iteration function                              |
//+------------------------------------------------------------------+
int start()
   {
   double hitot=Low[120];     // yes, high=low - must start at lowest point
   double lotot=High[120];    // yes, low=high - must start at highest point

   int size=120;  // make this external one day
   int i;
   int pos=size;

   if ( Bars <= size*2 ) return(0);
   if ( size < 2 ) size = 10;
   if ( size > Bars ) size = 250;

// MAIN

   while(pos>=0)
      {
      if ( Low[pos]  < lotot ) lotot = Low[pos];
      if ( High[pos] > hitot ) hitot = High[pos];
      ExtMapBuffer1[pos]=lotot;
      ExtMapBuffer2[pos]=hitot;
 	   pos--;
      }

   // clean up old indicators in array
   for(i=size;i<size+10;i++) ExtMapBuffer1[i]=0;
   for(i=size;i<size+10;i++) ExtMapBuffer2[i]=0;


   return(0);
  }

//+------------------------------------------------------------------+
Comments