test 5minRSI
Download script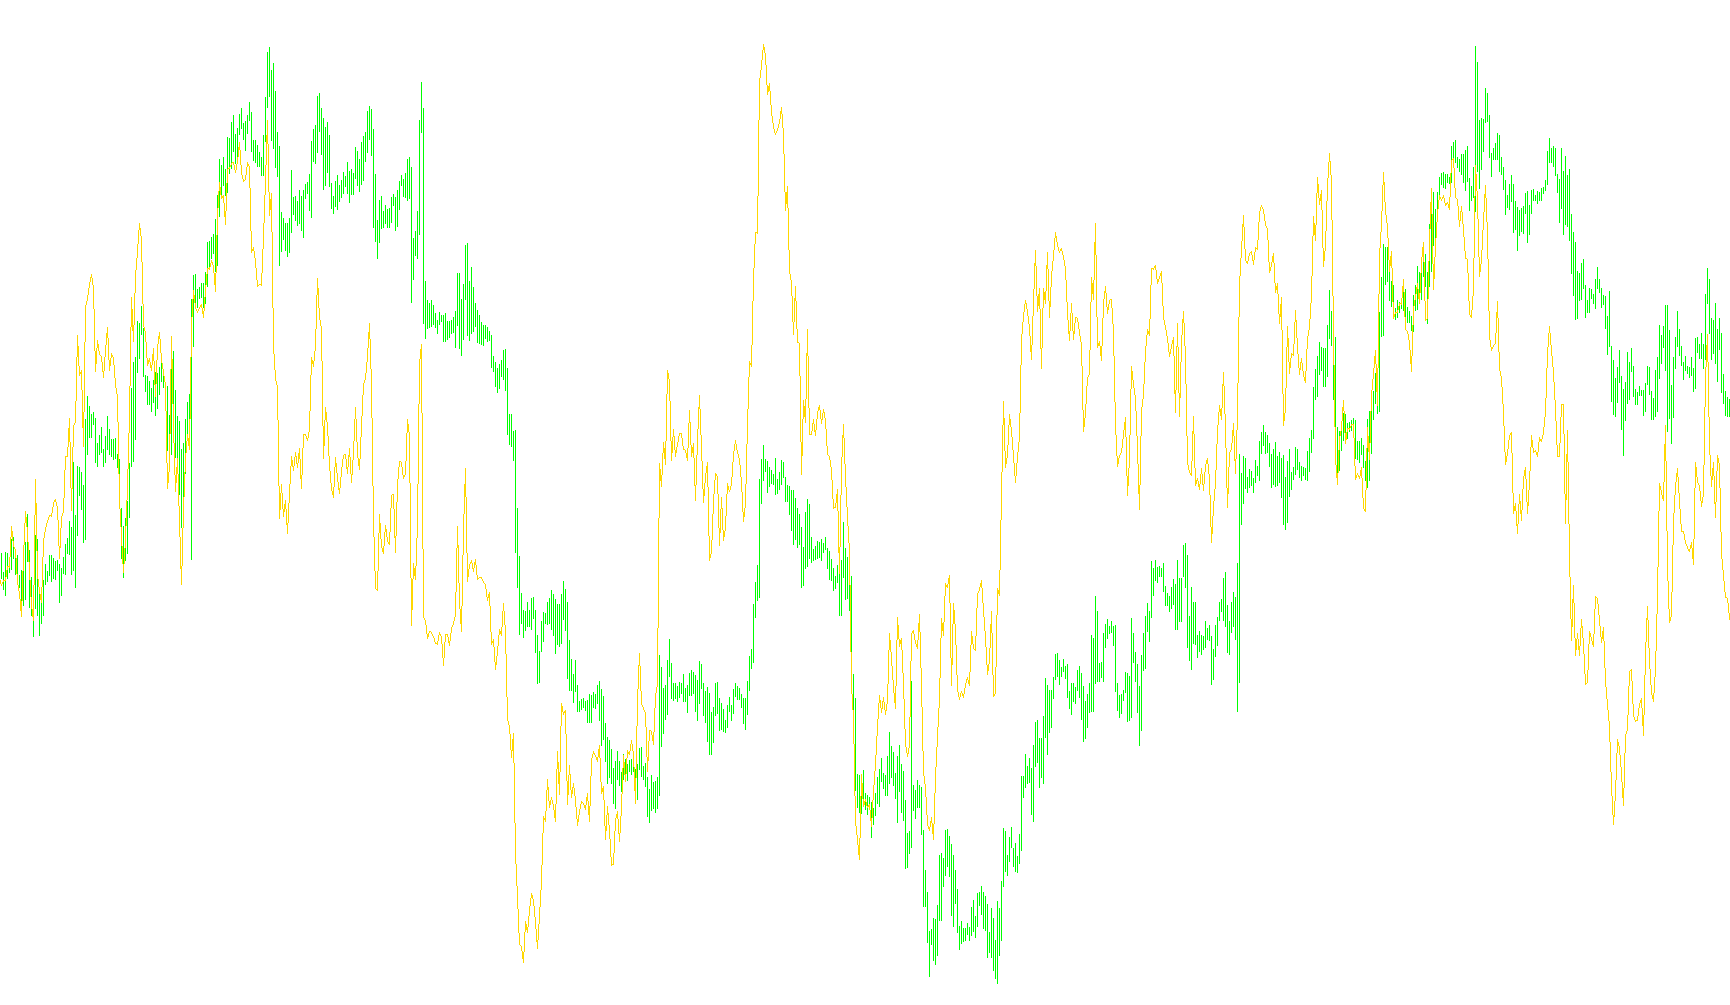
This script is designed as a custom technical analysis tool for the MetaTrader platform. Its primary purpose is to visualize and calculate the Relative Strength Index (RSI), which is a common momentum oscillator used by traders to determine whether an asset is overbought, oversold, or trending in a specific direction.
Core Functionality
The script automatically processes historical price data to generate a continuous line representing the RSI value. Specifically, it focuses on the following logic:
- Data Calculation: The tool monitors the closing prices of the current financial instrument over a rolling period of 28 units. By analyzing these price changes, it calculates the "strength" of upward movements versus downward movements.
- Visual Representation: The result is plotted as a white line in a separate window below your main trading chart. This allows you to observe the momentum of the market without cluttering the primary price action.
- Dynamic Updating: The script scans through historical data (starting from approximately 100 bars back) and populates the visual buffer, ensuring that the trend line is rendered smoothly across the chart.
Purpose for the Trader
While the underlying math handles the heavy lifting of identifying market velocity, the ultimate goal is to help you identify shifts in market sentiment. By viewing the RSI line generated by this script, you can observe how quickly an asset is moving and identify potential turning points where the momentum may be exhausting.
In summary, this tool acts as a specialized visual filter that translates complex price fluctuations into a simplified momentum curve, allowing for easier identification of market trends at a glance.
/*-----------------------------+
|			       |
| Shared by www.Aptrafx.com    |
|			       |
+------------------------------*/

//+------------------------------------------------------------------+
//| 5 Min RSI 12-period qual INDICATOR                               |
//+------------------------------------------------------------------+
#property copyright "Ron T"
#property link      "http://www.lightpatch.com"

#property indicator_separate_window
#property indicator_buffers 1
#property indicator_color1 White

//---- buffers
double ExtMapBuffer1[];


//+------------------------------------------------------------------+
//| Custom indicator initialization function                         |
//|------------------------------------------------------------------|

int init()
  {
   SetIndexStyle(0,DRAW_LINE);
   SetIndexBuffer(0, ExtMapBuffer1);

   return(0);
  }


//+------------------------------------------------------------------+
//| Custor indicator deinitialization function                       |
//+------------------------------------------------------------------+
int deinit()
  {
   int i;

   for( i=0; i<Bars; i++ ) ExtMapBuffer1[i]=0;

   return(0);
  }


//+------------------------------------------------------------------+
//| Custom indicator iteration function                              |
//+------------------------------------------------------------------+

// Current position if 55/45 or over/under. Does any of
// the previous 'qual' period ever fall below55/above45? (last11)
//
// If qual*2 periods have been above55/below45
// then lets not try to transact any more (last22)


int start()
  {
   double   rsi=0;        // Relative Strength Indicator
   int      pos=Bars-100; // leave room for moving average periods

   while(pos>=0)
     {
      rsi=iRSI(Symbol(),0,28,PRICE_CLOSE,pos);
      ExtMapBuffer1[pos]=rsi;
 	   pos--;
     }

   return(0);
  }
//+------------------------------------------------------------------+
Comments