TEMa-RV_v1
Download script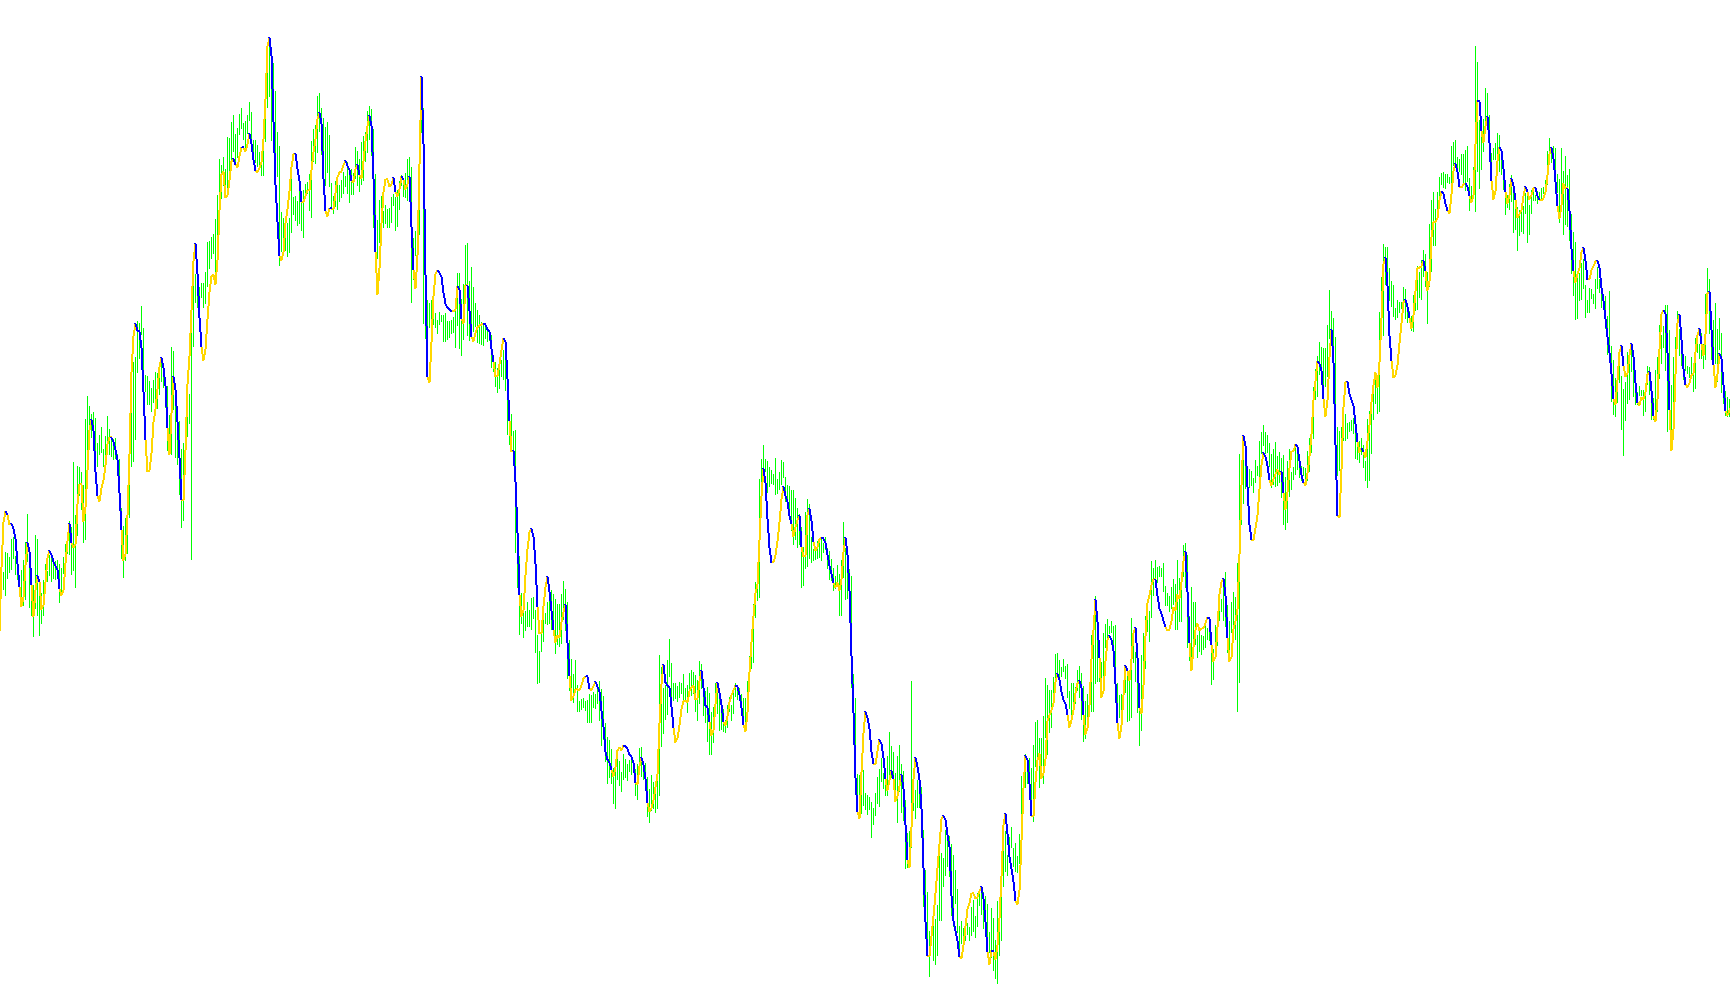
This indicator is designed to provide traders with a sophisticated visual tool for identifying price trends by using a multi-layered smoothing technique. Unlike standard moving averages that can often be "noisy" or reactive to sudden market fluctuations, this script employs a Triple Exponential Moving Average (TeMA) logic. This creates a much smoother line that attempts to follow the core trend of the market while filtering out minor, insignificant price vibrations.
How the Logic Works
The core functionality relies on a "layering" process. Instead of calculating a single average of the price, the script performs several sequential mathematical operations:
- Initial Data Selection: The user can choose which specific price data point to track (such as the closing price, the high/low range, or an average of all three).
- Triple Smoothing Pass: The indicator takes that base price and runs it through three distinct stages of calculation. It applies a moving average to the price, then applies another moving average to that result, and a third time again. This "nesting" of averages significantly reduces lag while keeping the line smooth.
- Weighted Calculation: The script uses a specific weighted formula to combine these smoothed results. This ensures that the final output is mathematically balanced to reflect the most relevant trend information.
- Final Polishing: A final smoothing pass is applied to the resulting calculation to ensure the visual representation on your chart is fluid and clear.
Visual Interpretation for Traders
The indicator renders two distinct lines on the chart, typically in contrasting colors (Red and Green). These lines serve as a guide for market momentum:
- Trend Direction: The movement of the lines helps identify whether the current market price is trending upward or downward over the chosen periods.
- Dynamic Tracking: Because of the triple-smoothing logic, the line will stay steady during sideways "choppy" markets but will react efficiently when a new trend begins.
- Visual Cues: The script includes logic to manage how these lines appear on your screen, ensuring that you see a clean progression of movement without unnecessary visual clutter.
In essence, this tool is built for traders who want a more refined "big picture" view of the market, providing a stable trend line that ignores minor price noise while staying responsive to significant shifts in direction.
//+------------------------------------------------------------------+
//|                   Double - Triple Exponential Moving Average.mq4 |
//|                         Copyright © 2006, Ronald Verwer/ROVERCOM |
//+------------------------------------------------------------------+
#property copyright "Copyright © 2006, Ronald Verwer/ROVERCOM"

#property indicator_chart_window
#property indicator_buffers 2
#property indicator_color1 Red
#property indicator_color2 Green
#property indicator_width1 2
#property indicator_width2 2
//---- indicator parameters
extern int Apply_To_Price=0; //0=close 1=Open 2=High 3=Low 4=(H+L)/2 5=(H+L+C)/3 6=(H+L+C+C)/4extern int MA1_FirstPeriod=10;
extern int TeMA_Method=3; //0=Simple 1=Exponential 2=Smoothed 3=linear weighted
extern int TeMA_FirstPeriod=3;
extern int TeMA_SecondPeriod=6;
extern int TeMA_ThirdPeriod=15;
extern int TeMA_SmoothingPeriod=3;

//---- indicator buffers
double x0[];
double x1[];
double x[];
double y[];
double z[];
double q[];

string txt;
int clr1,clr2;

//----
int ExtCountedBars=0;
//+------------------------------------------------------------------+
//| Custom indicator initialization function                         |
//+------------------------------------------------------------------+
int init()
  {
   int    draw_begin;
//---- drawing settings
   IndicatorBuffers(8);
   SetIndexStyle(0,DRAW_LINE,0,2);
   SetIndexStyle(1,DRAW_LINE,0,2);
   IndicatorDigits(MarketInfo(Symbol(),MODE_DIGITS));
   //if(TeMA_FirstPeriod<2) TeMA_FirstPeriod=13;
   draw_begin=TeMA_SecondPeriod-1;
//---- indicator short name
   SetIndexDrawBegin(0,draw_begin);
//---- indicator buffers mapping
   SetIndexBuffer(0,x0);
   SetIndexBuffer(1,x1);
   SetIndexBuffer(2,x);
   SetIndexBuffer(3,y);
   SetIndexBuffer(4,z);
   SetIndexBuffer(5,q);
   switch(Apply_To_Price)
      {
      case 1:
         {txt="Open";break;}
      case 2:
         {txt="High";break;}
      case 3:
         {txt="Low"; break;}
      case 4:
         {txt="Median"; break;}
      case 5:
         {txt="Typical"; break;}
      case 6:
         {txt="WghtdClose"; break;}
   	default:
         {txt="Close";}
      }
   IndicatorShortName("TeMa/"+txt+"("+TeMA_FirstPeriod+")");
//---- initialization done
   return(0);
  }
//+------------------------------------------------------------------+
//|                                                                  |
//+------------------------------------------------------------------+
int start()
   {
   int i,limit,counted_bars=IndicatorCounted();
   if(counted_bars<0) return(-1);
   if(counted_bars>0) counted_bars--;
   limit=Bars-counted_bars;

   for(i=limit;i>=0;i--)
      x[i]=iMA(NULL,0,TeMA_FirstPeriod,0,TeMA_Method,Apply_To_Price,i);

   for(i=limit;i>=0;i--)
      y[i]=iMAOnArray(x,0,TeMA_SecondPeriod,0,TeMA_Method,i);

   for(i=limit;i>=0;i--)
      z[i]=iMAOnArray(y,0,TeMA_ThirdPeriod,0,TeMA_Method,i);

   for(i=limit;i>=0;i--)
      q[i]=x[i]*3-y[i]*3+z[i];

   for(i=limit;i>=0;i--)
      {
      x0[i]=iMAOnArray(q,0,TeMA_SmoothingPeriod,0,TeMA_Method,i);
      x1[i]=x0[i];
      if(x0[i]>x0[i+1])
         x1[i+1]=EMPTY_VALUE;
      }
   return(0);
  }
//+------------------------------------------------------------------+
Comments