TD_REI
Download script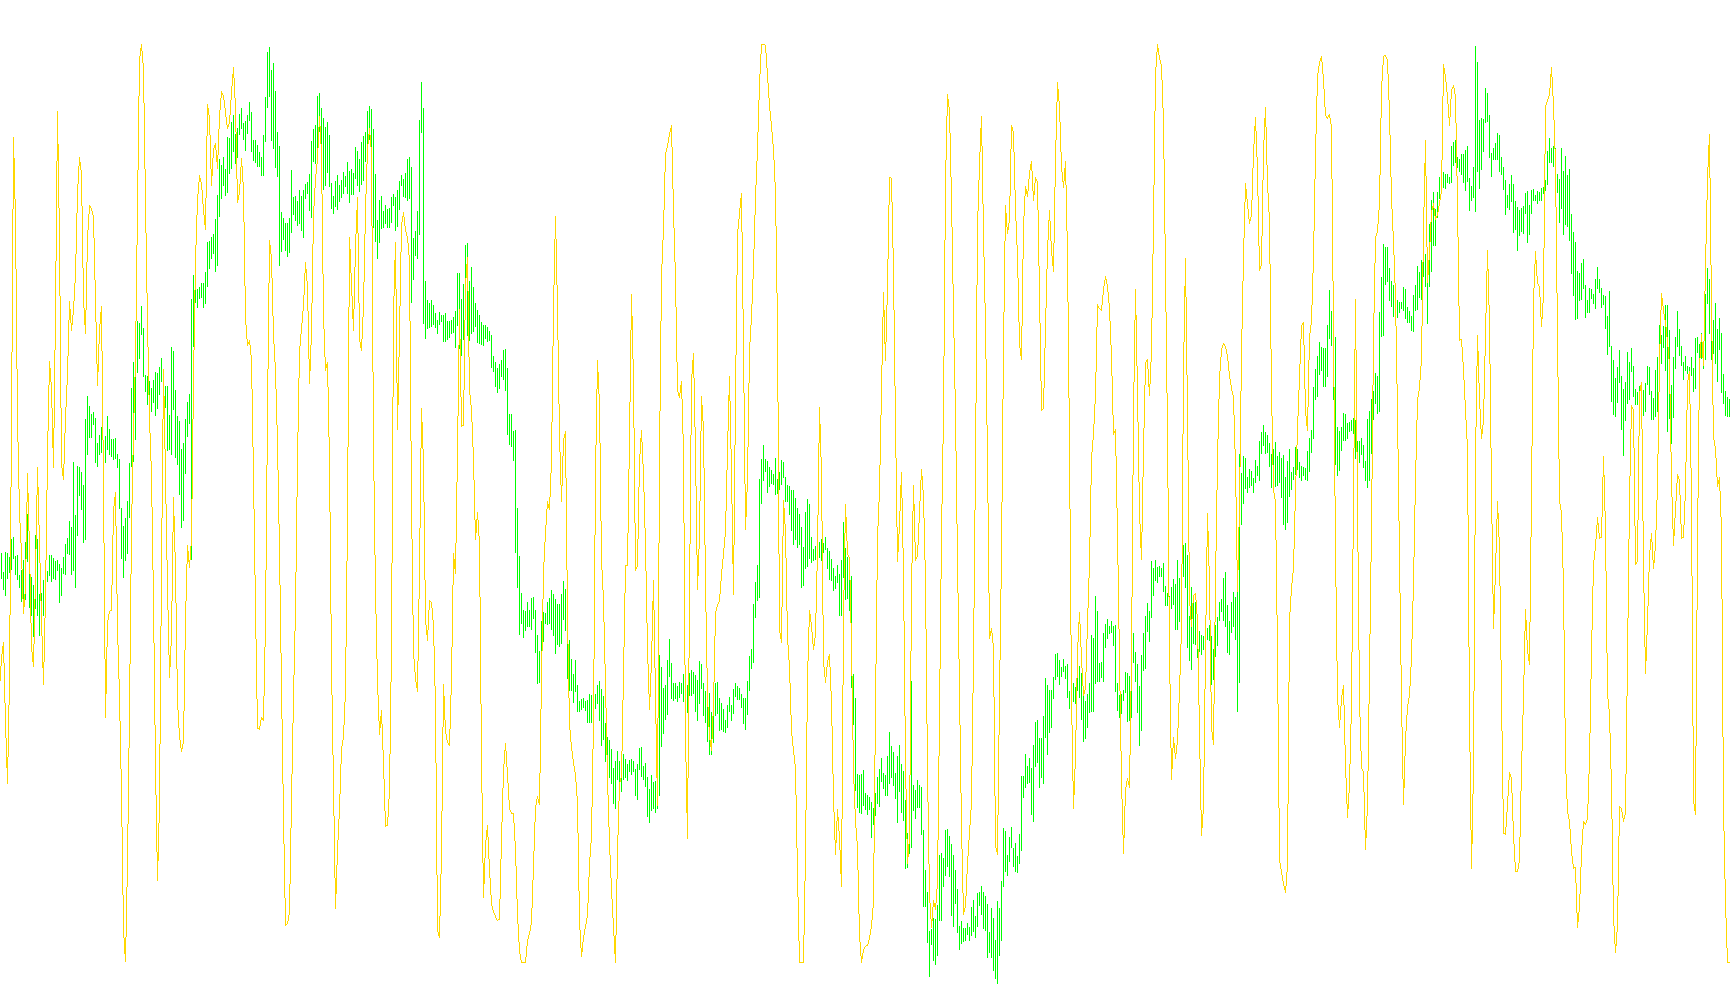
This script functions as a custom technical analysis tool designed to measure and visualize market momentum by analyzing the relationship between price movements over a specific period. Instead of simply looking at the raw price, it evaluates how "directional" the price action is by comparing current highs and lows against those from two periods prior.
Core Logic and Mechanism
The indicator operates through three primary steps to generate its visual output:
1. Calculating Relative Movement For every point on the chart, the script looks at the difference between the current high/low and the high/low from two positions back. It performs two distinct types of calculations simultaneously:
- It determines the Net Change: This represents the actual movement (positive or negative).
- It determines the Absolute Magnitude: This represents the total distance traveled, regardless of whether the price went up or down.
2. Aggregation and Ratio Analysis The tool then looks back over a user-defined timeframe (determined by the "length" setting). It sums up all the Net Changes and all the Absolute Magnitudes within that window. By dividing the total Net Change by the total Absolute Magnitude, the script calculates a ratio.
This specific logic is designed to distinguish between "clean" directional moves and "choppy" market noise. For example, if the price moves significantly in one direction without much fluctuation, the ratio will be high. If the price bounces up and down aggressively but ends up near where it started, the total distance (Absolute Magnitude) will be high while the Net Change remains low, resulting in a much smaller ratio.
3. Normalization for Visualization To make this data easier for a human to read on a chart, the script converts that ratio into a percentage-based format (scaling it by 100). The result is plotted as a continuous line in a separate window at the bottom of your trading platform.
Key Characteristics
- Trend Strength Identification: The indicator highlights how much of a price move is "meaningful" directional progress versus random volatility.
- Sensitivity: By adjusting the "length" parameter, users can change how much historical data is considered when calculating these ratios.
- Visual Output: The resulting line provides a smoothed representation of market energy, allowing traders to see periods of strong trending conviction versus periods of consolidation or erratic price action.
//+------------------------------------------------------------------+
//| REI.mq4 |
//| Mishutka |
//| www.ourarsenal.narod.ru |
//+------------------------------------------------------------------+
#property copyright "Mishutka"
#property link "www.ourarsenal.narod.ru"

#property indicator_separate_window
#property indicator_buffers 1
#property indicator_color1 Red
//+------------------------------------------------------------------+
//| Custom indicator initialization function |
//+------------------------------------------------------------------+
extern int lenght=8;
extern int NBars=100;
double REABS[21];
double RE[21];
double REI;
double SUM;
double SUMABS;
int Z;
double TDREI;

double WORK[];
int init()
{
REI=0;
SUM=0;
SUMABS=0;
Z=0;
TDREI=0;
int www=14;

IndicatorBuffers(1);
SetIndexBuffer(0,WORK);
//---- drawing settings
SetIndexLabel(0,"REI");
//SetIndexDrawBegin(0,0);
//SetIndexStyle(0,DRAW_LINE,STYLE_SOLID,255);
SetIndexStyle(0,DRAW_LINE,STYLE_SOLID,1);

IndicatorDigits(MarketInfo(Symbol(),MODE_DIGITS)+1);
//---- indicator buffers mapping


//---- name for DataWindow and indicator subwindow label


//---- initialization done
return(0);
}
int start()
{
Sleep(100);
int counted_bars=IndicatorCounted();
int limit;
//---- check for possible errors
if(counted_bars<0) return(-1);
//---- last counted bar will be recounted
if(counted_bars>0) counted_bars--;
limit=Bars-counted_bars;

//---- rei counted in the 1-st buffer
//??? ????? ? ????????? ??????? ???????? ? ??????? ? ???????????? ???? ? ?????????? ? ????????? ?? ??? ??? ?? ?????.
//????????????? ???????? ??????????? ?????, ????? ???????????? ???? ????, ??? ??? ??? ?????. ????????????? ????????
// ??????????? ?????, ????? ??? ???????????? ???? ??????, ??? ??? ??? ?????. ???? ??????????? ???? ???? ???????????
//???? ??? ??? ???? ?????, ?? ??????????? ????????????? ????????. ???? ??? ??????, ??? ??? ??? ?????, ?? ??????????? ?
//???????????? ????????. ????? ??? ?????????? ???????? ??????????? ? ???????????? ???????? ??? ??????? ???.


for (int shift=limit;shift>=0;shift--)
{

RE[0]=(High[shift]-High[shift+2])+(Low[shift]-Low[shift+2]);
REABS[0]=MathAbs(High[shift]-High[shift+2])+MathAbs(Low[shift]-Low[shift+2]);
SUM=0;
SUMABS=0;

for (Z=0;Z<=lenght-1;Z++)
{
SUM=SUM+RE[Z];
SUMABS=SUMABS+REABS[Z];
}

if (SUMABS>0) {REI=SUM/SUMABS;}

TDREI=100*REI;
if (TDREI==0) {TDREI=0.00001;}


WORK[shift]=TDREI;


for (Z=21;Z>=0;Z--)
{
RE[Z]=RE[Z-1];
REABS[Z]=REABS[Z-1];
}

}


//----
return(0);
}
//+------------------------------------------------------------------+
Comments