TD Sequential_v3
Download script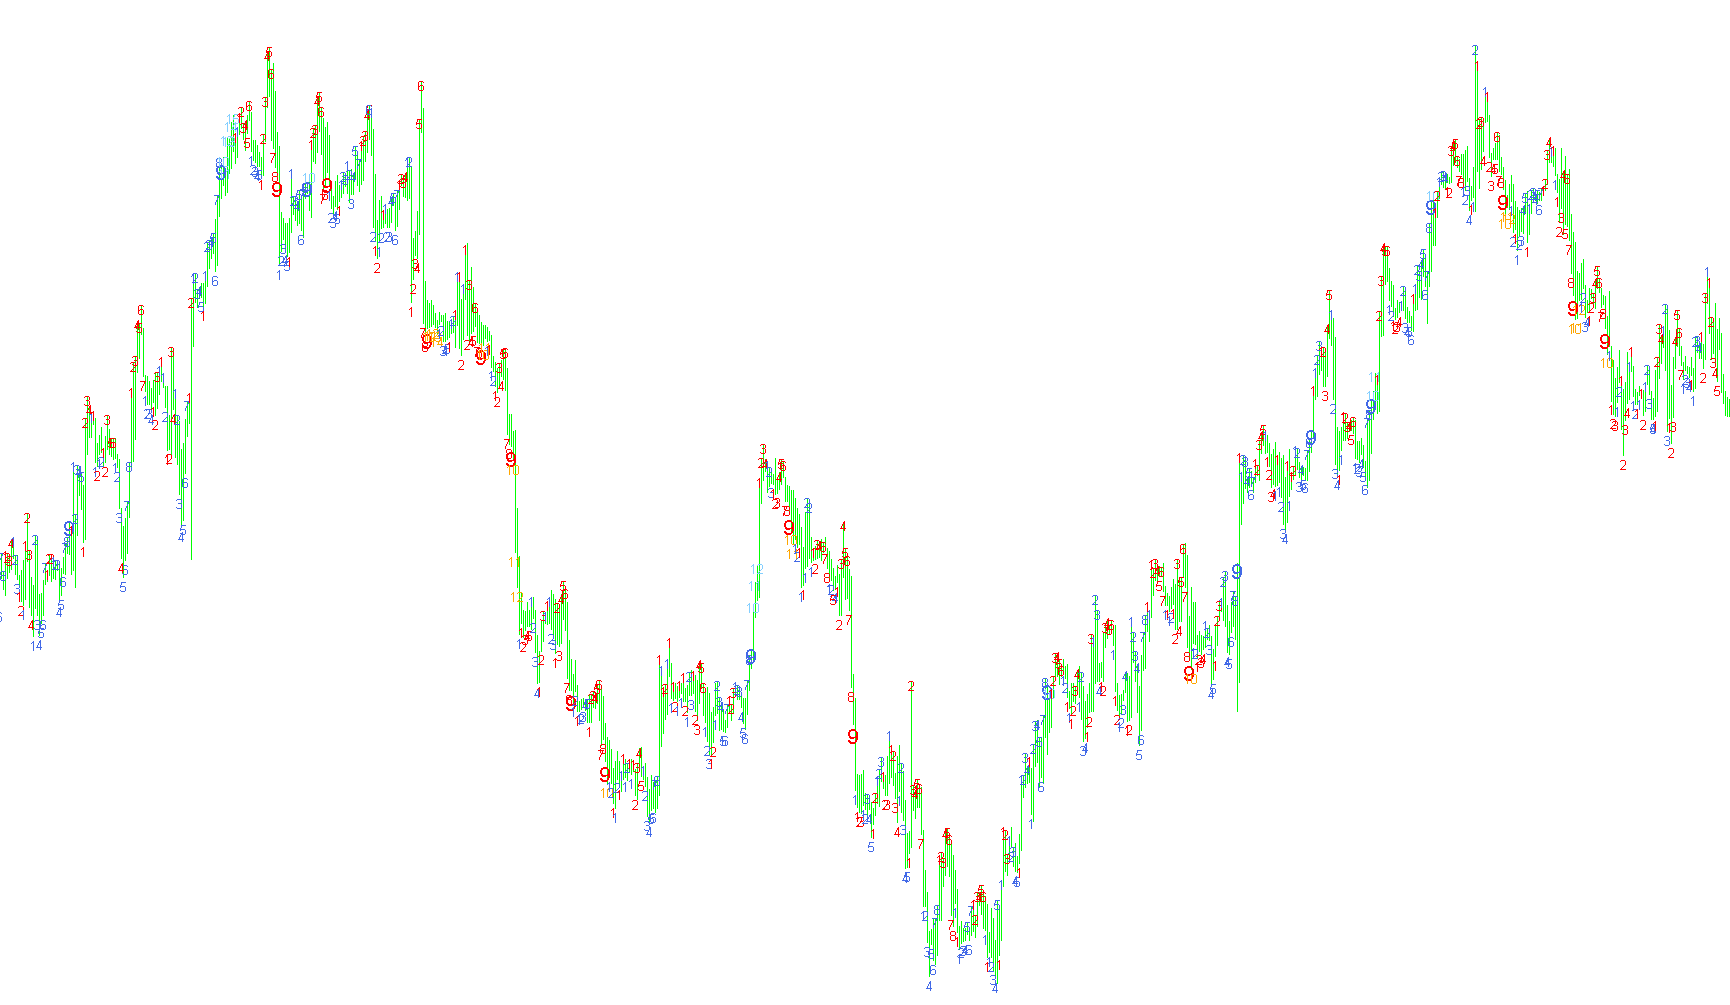
This script is designed to provide a visual representation of price momentum and trend strength on your trading charts. It automatically identifies and labels consecutive price movements, helping traders gauge whether a current trend is gaining strength or becoming exhausted.
How the Logic Works
The script monitors the relationship between the closing prices of historical candles over a specific timeframe. Instead of just looking at the immediate previous candle, it compares the current price movement against a point further back in history (specifically five intervals back) to determine the "direction" of the trend.
1. Tracking Price Momentum The tool tracks two distinct types of movements simultaneously:
- Downward Movement: It counts how many consecutive times the price has moved lower compared to its previous position.
- Upward Movement: It counts how many consecutive times the price has moved higher compared to its previous position.
2. Dynamic Visual Labeling As the trend progresses, the script places numerical labels directly on your chart to show the "count" of these consecutive moves:
- Standard Counts (1-8): When a move is in its early stages, it displays a small number.
- The Turning Point (9): When the count reaches nine, the script enlarges the text size. This serves as a visual alert that the trend is reaching a significant milestone.
- Extended Trends (10+): If the price continues to move in the same direction beyond the initial count, the script changes the color of the labels. This helps distinguish between a standard price swing and a deeply extended, long-term trend.
3. Color Coding for Quick Analysis The logic uses different colors to help you instantly identify the sentiment of the market:
- Red and Orange tones: These are used to track downward pressure. Red signifies the primary count, while orange appears during extended bearish movements.
- Blue and Sky Blue tones: These are used to track upward pressure. Royal Blue identifies the initial upward momentum, while Light Sky Blue highlights extended bullish trends.
Summary for the Trader
Essentially, this script acts as an "odometer" for price action. By looking at the numbers appearing above and below the candles, you can see exactly how far a trend has traveled without having to manually count bars. It provides a clear, color-coded history of market exhaustion and strength, allowing you to identify potential reversal zones or high-momentum entries at a glance.
//+------------------------------------------------------------------+
//| TD Sequential.mq4                                                |
//| Copyright © 2004, MetaQuotes Software Corp.                      |
//| http://www.metaquotes.net                                        |
//+------------------------------------------------------------------+
#property copyright "James OBrien"
#property link "http://www.metaquotes.net"
//----
#property indicator_chart_window
#property indicator_buffers 1
#property indicator_color1 LimeGreen
//#property indicator_color2 Red
//---- input parameters
//int shift=0;
int i;
int num=0;
int num1=0;
string textVar;
//---- buffers
double ExtMapBuffer1[];
//double ExtMapBuffer2[];
//double b4plusdi,b4minusdi,nowplusdi,nowminusdi;
//+------------------------------------------------------------------+
//| Custom indicator initialization function                         |
//+------------------------------------------------------------------+
int init()
  {
//---- indicators
   SetIndexStyle(0,DRAW_ARROW);
   SetIndexArrow(0,159);
   SetIndexBuffer(0, ExtMapBuffer1);
/*
SetIndexStyle(1,DRAW_ARROW,EMPTY);
SetIndexArrow(1,234);
SetIndexBuffer(1, ExtMapBuffer2);
*/
//----
   return(0);
  }
//+------------------------------------------------------------------+
//| Custor indicator deinitialization function                       |
//+------------------------------------------------------------------+
int deinit()
  {
//---- TODO: add your code here
   int limit;
   limit=1500;
   for(int i=limit; i>=0; i--)
     {
      ObjectDelete(""+i);
     }
//----
   return(0);
  }
//+------------------------------------------------------------------+
//| Custom indicator iteration function                              |
//+------------------------------------------------------------------+
int start()
  {
   int limit;
   int counted_bars=IndicatorCounted();
//---- check for possible errors
   if(counted_bars<0) return(-1);
//---- last counted bar will be recounted
   if(counted_bars>0) counted_bars--;
   limit=1500-counted_bars;
//---- macd counted in the 1-st buffer
   for(int i=limit; i>=0; i--)
     {
      if(Close[i+1]<Close[i+5])num=num + 1;
      else num=0;
        if (num > 0 && num < 10)
        {
         textVar=num;
         ObjectCreate(""+i, OBJ_TEXT, 0, Time[i+1],Low[i+1]-5*Point );
         ObjectSetText(""+i, ""+DoubleToStr(num,0), 10, "Arial", Red);
        }
        if (num==9)
        {
         ObjectCreate(""+i, OBJ_TEXT, 0, Time[i+1],Low[i+1]-5*Point );
         ObjectSetText(""+i, ""+DoubleToStr(num,0), 16, "Arial", Red);
        }
      else if((Close[i+1]<Close[i+5])&& num>=10)
           {
            ObjectCreate(""+i, OBJ_TEXT, 0, Time[i+1],Low[i+1]-5*Point );
            ObjectSetText(""+i, ""+DoubleToStr(num,0), 10, "Arial", Orange);
           }
      if(Close[i+1]>Close[i+5]) num1=num1 + 1;
      else num1=0;
//----
      if (num1 > 0 && num1 < 10)
        {
         textVar=num1;
         ObjectCreate(""+i, OBJ_TEXT, 0, Time[i+1],High[i+1]+10*Point );
         ObjectSetText(""+i, ""+DoubleToStr(num1,0), 10, "Arial", RoyalBlue);
        }
        if (num1==9)
        {
         ObjectCreate(""+i, OBJ_TEXT, 0, Time[i+1],High[i+1]+10*Point );
         ObjectSetText(""+i, ""+DoubleToStr(num1,0), 16, "Arial", RoyalBlue);
        }
      else if((Close[i+1]>Close[i+5])&& num1>=10)
           {
            ObjectCreate(""+i, OBJ_TEXT, 0, Time[i+1],High[i+1]+10*Point );
            ObjectSetText(""+i, ""+DoubleToStr(num1,0), 10, "Arial", LightSkyBlue);
           }
     }
//----
   return(0);
  }
//+------------------------------------------------------------------+
Comments