Tema_rlh_v2
Download script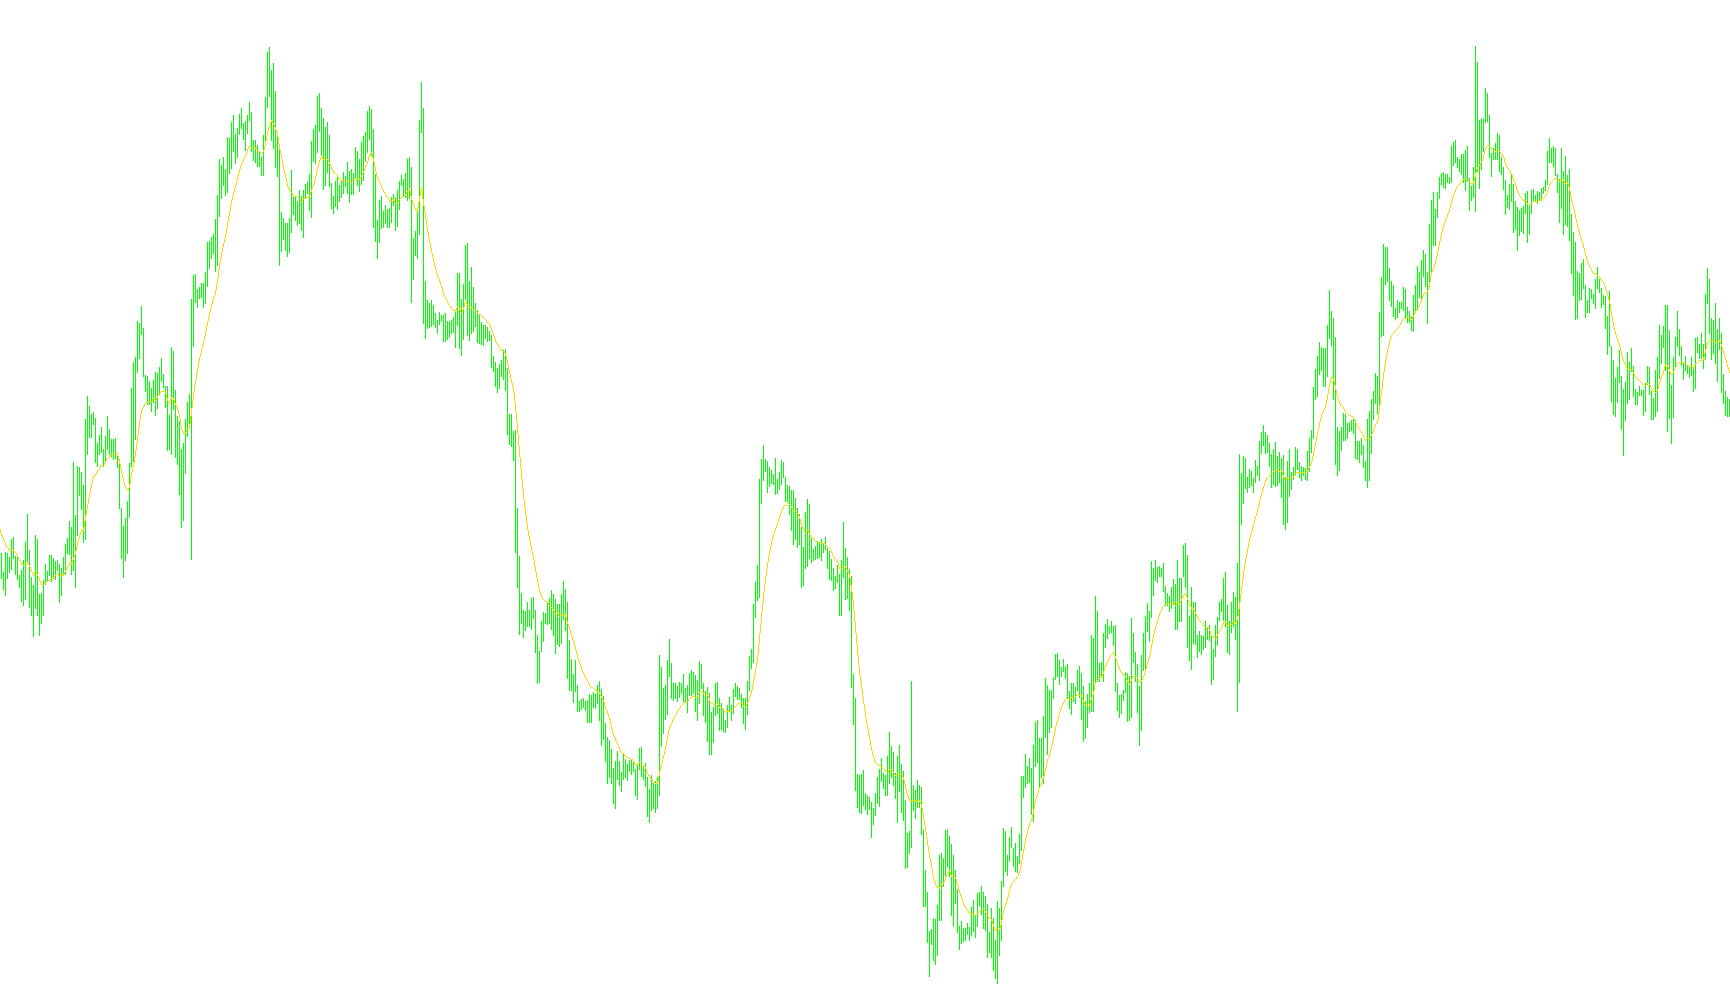
This tool provides a sophisticated method for analyzing market trends by using a specialized mathematical smoothing technique known as the Triple Exponential Moving Average (TEMA).
While standard moving averages are commonly used to "smooth out" price fluctuations and identify the general direction of a market, they often suffer from a delay—meaning the indicator might show a trend change only after it has already occurred. The logic behind this script is designed to significantly reduce that lag while maintaining a clean, readable line.
How the Logic Works
The script achieves its results by layering three different levels of moving averages on top of one another. To understand the final output, the script performs the following sequence:
- Primary Smoothing: It first calculates a standard Exponential Moving Average (EMA) of the market price.
- Secondary Smoothing: It then takes that first average and calculates a second average based solely on those results (an "Average of an Average").
- Tertiary Smoothing: It repeats the process one more time, calculating a third average from the previous step (an "Average of an Average of an Average").
The Final Calculation
Instead of simply choosing one of these three lines to display, the script uses a specific mathematical formula to combine them: It triples the value of the first average, subtracts three times the value of the second average, and adds the value of the third average.
By using this specific combination, the indicator filters out "market noise" much more efficiently than a standard moving average. The result is a highly responsive trend line that stays closer to the actual price action, making it easier for traders to identify shifts in momentum without being distracted by minor, insignificant price spikes.
Visual Representation
To help users visualize the internal logic, the script displays four different lines on your chart:
- Red Line: The basic Exponential Moving Average (EMA).
- Green Line: The second layer of smoothing (EMA of EMA).
- Yellow Line: The third layer of smoothing (EMA of EMA of EMA).
- Aqua Line: The final TEMA result—the optimized, high-performance trend line.
//+------------------------------------------------------------------+
//|                                                       TEMA_RLH   |
//|                                    Copyright © 2006, Robert Hill |
//|                                       http://www.metaquotes.net/ |
//|                                                                  |
//| Based on the formula developed by Patrick Mulloy                 |
//|                                                                  |
//| It can be used in place of EMA or to smooth other indicators.    |
//|                                                                  |
//| TEMA = 3 * EMA - 3 * (EMA of EMA) + EMA of EMA of EMA            |
//|                                                                  |
//|  Red is EMA, Green is EMA of EMA, Yellow is Ema of Ema of Ema    |
//|  Aqua is TEMA                                                    |
//|                                                                  |
//+------------------------------------------------------------------+
#property  copyright "Copyright © 2006, Robert Hill "
#property  link      "http://www.metaquotes.net/"
//---- indicator settings
#property  indicator_chart_window
#property  indicator_buffers 4
#property  indicator_color1  Red
#property  indicator_color2  Green
#property  indicator_color3  Yellow
#property  indicator_color4  Aqua
#property  indicator_width1  1
#property  indicator_width2  1
#property  indicator_width3  1
#property  indicator_width4  2
//----
extern int EMA_Period=14;
//---- buffers
double Ema[];
double EmaOfEma[];
double EmaOfEmaOfEma[];
double Tema[];
//+------------------------------------------------------------------+
//| Custom indicator initialization function                         |
//+------------------------------------------------------------------+
int init()
  {
//---- drawing settings
   SetIndexStyle(0,DRAW_LINE);
   SetIndexStyle(1,DRAW_LINE);
   SetIndexStyle(2,DRAW_LINE);
   SetIndexStyle(3,DRAW_LINE);
   SetIndexDrawBegin(0,EMA_Period);
   IndicatorDigits(MarketInfo(Symbol(),MODE_DIGITS)+2);
//---- 3 indicator buffers mapping
   if(!SetIndexBuffer(0,Ema) &&
      !SetIndexBuffer(1,EmaOfEma) &&
      !SetIndexBuffer(2,EmaOfEmaOfEma) &&
      !SetIndexBuffer(3,Tema))
      Print("cannot set indicator buffers!");
   //   if(!SetIndexBuffer(0,Tema) )
   //      Print("cannot set indicator buffers!");
//---- name for DataWindow and indicator subwindow label
   IndicatorShortName("TEMA("+EMA_Period+")");
//---- initialization done
   return(0);
  }
//+------------------------------------------------------------------+
//|                                                                  |
//+------------------------------------------------------------------+
int start()
  {
   int i, limit;
   int    counted_bars=IndicatorCounted();
   if(counted_bars>0) counted_bars--;
   limit=Bars-counted_bars;

   for(i=limit; i>=0; i--)
      Ema[i]=iMA(NULL,0,EMA_Period,0,MODE_EMA,PRICE_CLOSE,i);
   for(i=limit; i >=0; i--)
      EmaOfEma[i]=iMAOnArray(Ema,Bars,EMA_Period,0,MODE_EMA,i);

   for(i=limit; i >=0; i--)
      EmaOfEmaOfEma[i]=iMAOnArray(EmaOfEma,Bars,EMA_Period,0,MODE_EMA,i);
   //========== COLOR CODING ===========================================
   for(i=limit; i >=0; i--)
      Tema[i]=3 * Ema[i] - 3 * EmaOfEma[i] + EmaOfEmaOfEma[i];
//----
   return(0);
  }
//+------------------------------------------------------------------+
Comments