TD_REI_v2
Download script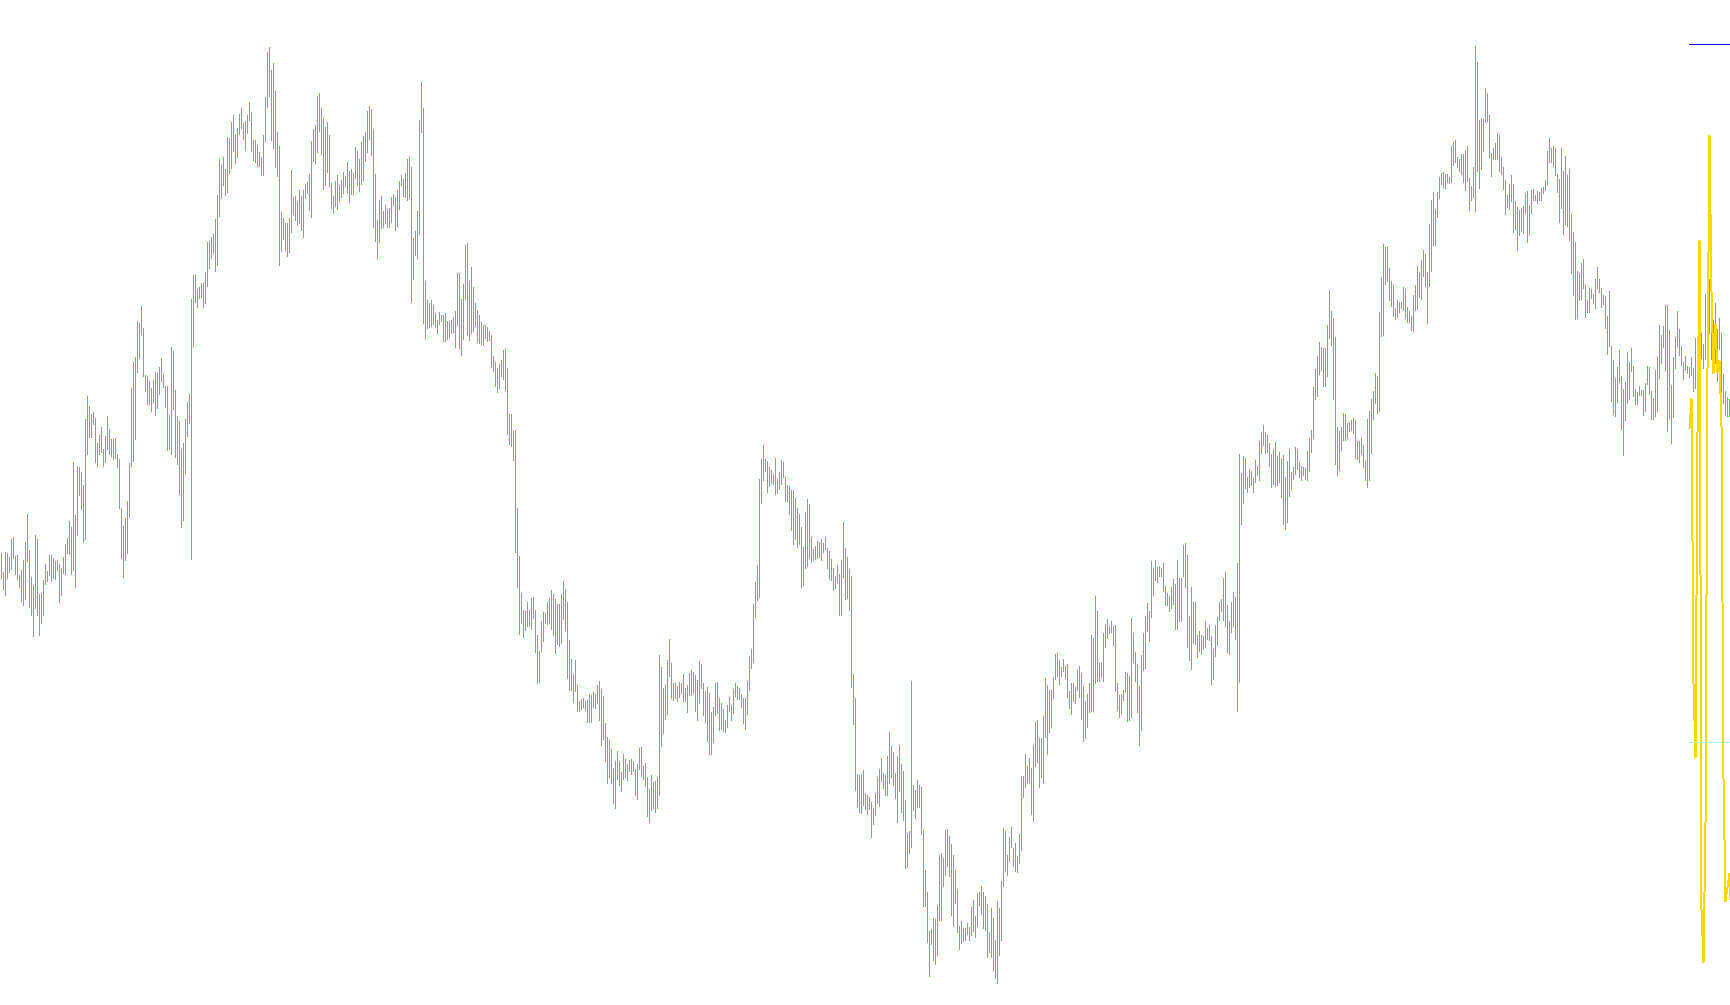
This tool is designed to provide traders with a visual representation of market momentum and price equilibrium by analyzing the relationship between high and low price points over specific periods. Instead of looking at standard price movements alone, this script focuses on how much "force" is being applied in a specific direction relative to the total volatility of the market.
How the Logic Works
The core mechanism of this indicator relies on three primary steps:
1. Measuring Price Displacement The script examines the difference between current price highs and lows compared to those from two bars back. This allows it to identify whether the price is expanding or contracting and in which direction that expansion is favoring. By comparing these values, the tool captures the "raw" movement of the market.
2. Calculating the Momentum Ratio To turn these movements into a usable metric, the logic calculates two different types of totals over a set timeframe:
- It sums up all the directional movements to see the overall trend.
- It simultaneously calculates the absolute value of those movements (the total volume of activity) regardless of direction.
By dividing the directional sum by the total activity, the script creates a ratio. This is then scaled to a percentage-like format. If the market is moving strongly in one direction, this value will move toward the extremes; if the market is choppy and movingsideways with no clear direction, the value stays closer to the center.
3. Visualizing Supply and Demand Zones The indicator plots three distinct lines on a separate window for easy analysis:
- The Momentum Line: The primary orange-red line fluctuates based on the calculations above, showing the immediate "pulse" of the market.
- The Supply and Demand Boundaries: The script establishes two constant horizontal boundaries (Supply at 60 and Demand at -60). These act as visual anchors, allowing traders to see when momentum is reaching significant levels or potentially exhausting itself against a specific threshold.
Summary for Traders
In practical terms, this tool helps you visualize the "intensity" of price action. It filters out minor market noise to show you the net direction of movement. When the main line moves toward the upper boundary, it indicates strong upward momentum; when it moves toward the lower boundary, it suggests dominant downward pressure. The horizontal lines provide a clear visual framework to identify these overextended states at a glance.
//+------------------------------------------------------------------+
//|                                                    TD_REI_v2.mq4 |
//|                                                             Oleg |
//|                                                           nolink |
//+------------------------------------------------------------------+
#property copyright "Oleg"
#property link  "gendir@glagol.tvcom.ru"


#property indicator_separate_window
#property indicator_buffers 3
#property indicator_color1 OrangeRed
#property indicator_color2 Red
#property indicator_color3 Blue
double Reabs[21], Re[21], Sum, Sumabs, Rei, Tdrei, Arr[], Supply[], Demand[];
int length = 8, n=15;
double Supply_Line = 60;
double Demand_Line = -60;
//+------------------------------------------------------------------+
//| Custom indicator initialization function                         |
//+------------------------------------------------------------------+
int init()
  {
  SetIndexBuffer(0, Arr);
  SetIndexStyle (0, DRAW_LINE, STYLE_SOLID, 2);

    SetIndexBuffer(1, Supply);
  SetIndexStyle (1, DRAW_LINE, STYLE_SOLID, 1);

  SetIndexBuffer(2, Demand);
  SetIndexStyle (2, DRAW_LINE, STYLE_SOLID, 1);
//---- indicators
//----
   return(0);
  }
//+------------------------------------------------------------------+
//| Custor indicator deinitialization function                       |
//+------------------------------------------------------------------+
int deinit()
  {
//----

//----
   return(0);
  }
//+------------------------------------------------------------------+
//| Custom indicator iteration function                              |
//+------------------------------------------------------------------+
int start()
  {
   int shift, z;
   for (shift=n; shift>=0; shift--)
   {
      Re[0]=(High[shift]-High[shift+2])+(Low[shift]-Low[shift+2]);
      Reabs[0]=MathAbs(High[shift]-High[shift+2])+MathAbs(Low[shift]-Low[shift+2]);
      Sum = 0;
      Sumabs = 0;

      for (z = 0; z<=(length-1); z++)
      {
         Sum = Sum + Re[z];
         Sumabs = Sumabs + Reabs[z];
      }
      if (Sumabs>0) Rei = Sum/Sumabs;
      Tdrei = 100*Rei;
      if (Tdrei==0) Tdrei=0.00001;
      Arr[shift] = Tdrei;
      for (z=21;z>= 0;z--)
      {
      Re[z]=Re[z-1];
      Reabs[z]=Reabs[z-1];
      }
      Supply[shift] = Supply_Line;
      Demand[shift] = Demand_Line;
   }
//----

//----
   return(0);
  }
//+------------------------------------------------------------------+
Comments