TD Sequential_v1
Download script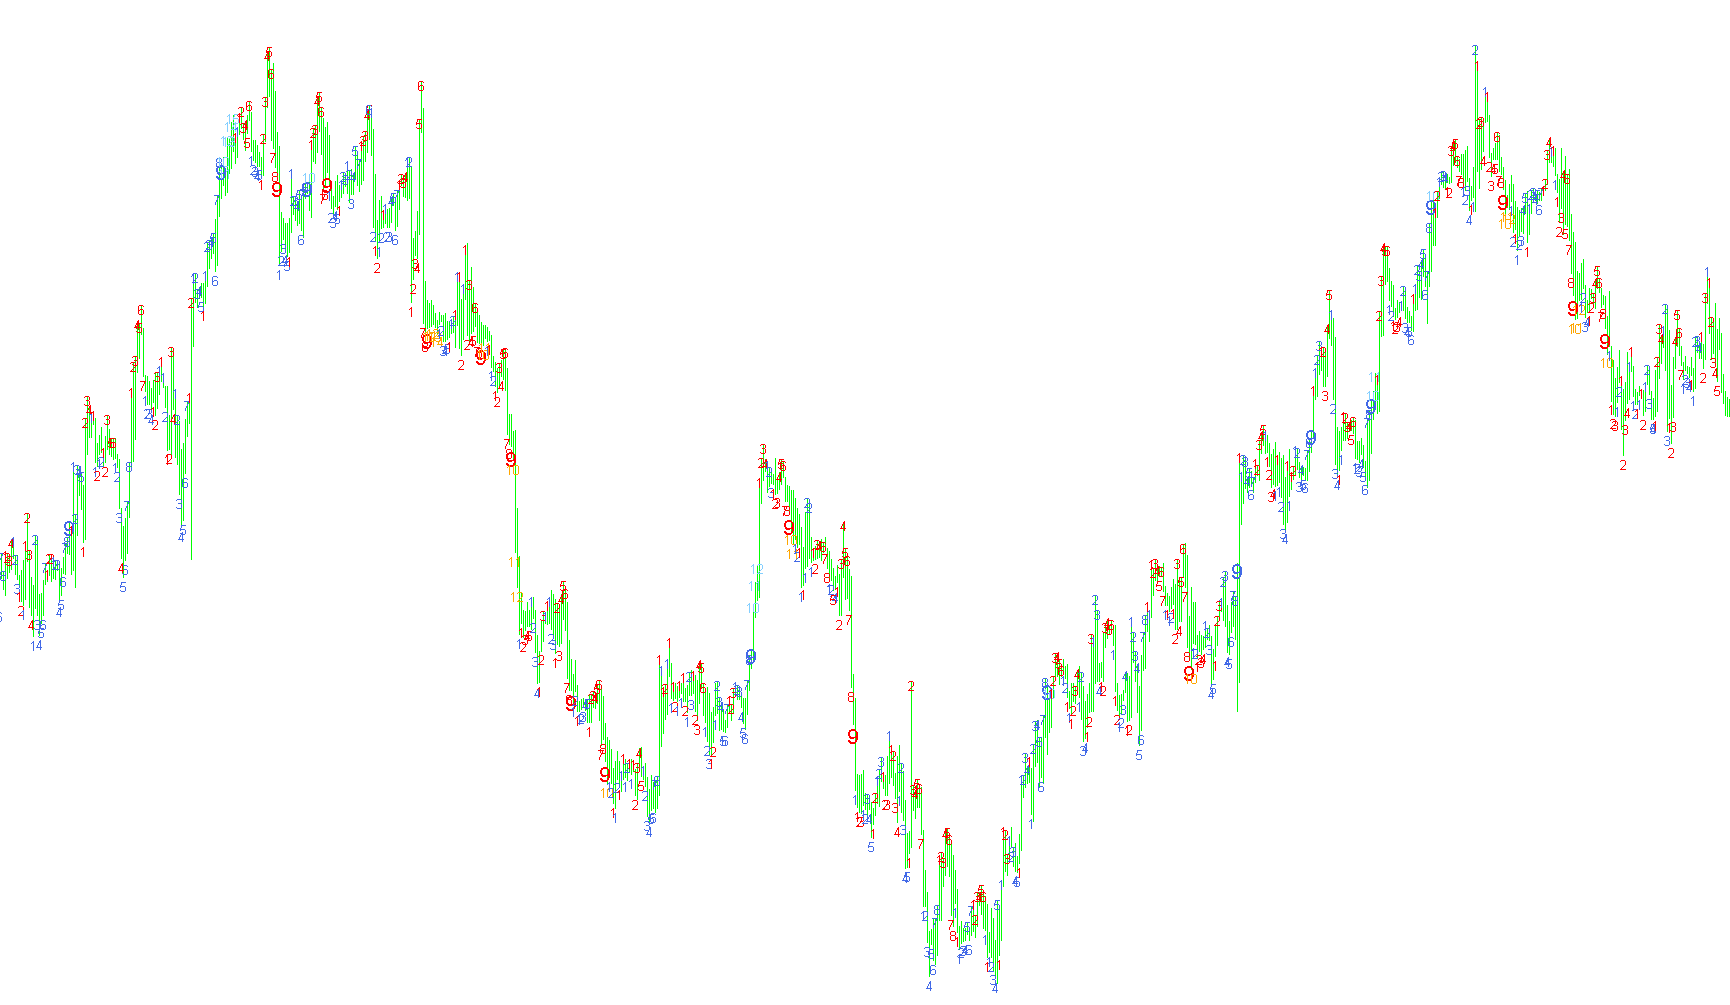
This tool is designed to provide a visual representation of price momentum and trend exhaustion on a trading chart. It functions by tracking the "count" of consecutive price movements, allowing traders to identify whether a market move is gaining strength or reaching a point of potential reversal.
Core Logic Overview
The script analyzes the relationship between current prices and historical prices at specific intervals. By calculating these sequences, it identifies patterns of consistent movement and labels them automatically on your chart with numeric values.
How the Analysis Works
1. Trend Counting The logic looks at the closing price of a candle compared to the closing price from several bars back.
- Bearish Momentum: If the current price is lower than the price from the previous interval, the script increments a counter. This tracks how many consecutive times the price has "dropped" relative to that specific lookback point.
- Bullish Momentum: Conversely, if the current price is higher than the price from the previous interval, the script increments a separate counter to track the strength of the upward move.
2. Visual Labeling and Weighting To make this data easy to read at a glance, the script places text labels directly on the candles:
- Standard Counts: For early stages of a trend (counts 1 through 8), the script displays small numbers. These help you see the initial progression of a move.
- The "9" Milestone: When a count reaches 9, the script increases the font size significantly. This acts as a visual warning that the move is becoming highly extended.
- Extreme Momentum (10+): If the price continues to move beyond a count of 10, the labels change color and maintain their visibility. This signifies an overextended trend where the market may be "overheated."
Color Coding for Clarity
The script uses a distinct color palette to separate buying pressure from selling pressure:
- Blue/Light Sky Blue: These colors are associated with upward momentum. They appear above the candles to indicate a rising price trend.
- Red/Orange: These colors are associated with downward momentum. They appear below the candles to indicate a falling price trend.
Summary for the Trader
Essentially, this script acts as a "momentum thermometer." Instead of just showing you that the price is going up or down, it tells you how long it has been moving in that direction. By watching the numbers grow and change colors, you can visually identify areas where a trend might be exhausted, helping you make more informed decisions on potential entries and exits.
//+------------------------------------------------------------------+
//| TD Sequential.mq4 |
//| Copyright © 2004, MetaQuotes Software Corp. |
//| http://www.metaquotes.net |
//+------------------------------------------------------------------+
#property copyright "James OBrien"
#property link "http://www.metaquotes.net"

#property indicator_chart_window
#property indicator_buffers 1
#property indicator_color1 LimeGreen
//#property indicator_color2 Red
//---- input parameters
//int shift=0;
int i;
int num=0;
int num1=0;
string textVar;
//---- buffers
double ExtMapBuffer1[];
//double ExtMapBuffer2[];

//double b4plusdi,b4minusdi,nowplusdi,nowminusdi;

//+------------------------------------------------------------------+
//| Custom indicator initialization function |
//+------------------------------------------------------------------+
int init()
{
//---- indicators

SetIndexStyle(0,DRAW_ARROW);
SetIndexArrow(0,159);
SetIndexBuffer(0, ExtMapBuffer1);
/*
SetIndexStyle(1,DRAW_ARROW,EMPTY);
SetIndexArrow(1,234);
SetIndexBuffer(1, ExtMapBuffer2);
*/
//----
return(0);
}
//+------------------------------------------------------------------+
//| Custor indicator deinitialization function |
//+------------------------------------------------------------------+
int deinit()
{
//---- TODO: add your code here
int limit;
limit=1500;
for(int i=limit; i>=0; i--)
{
	ObjectDelete(""+i);
}

//----
return(0);
}
//+------------------------------------------------------------------+
//| Custom indicator iteration function |
//+------------------------------------------------------------------+
int start()
{
int limit;
int counted_bars=IndicatorCounted();
//---- check for possible errors
if(counted_bars<0) return(-1);

//---- last counted bar will be recounted
if(counted_bars>0) counted_bars--;
limit=1500-counted_bars;
//---- macd counted in the 1-st buffer


for(int i=limit; i>=0; i--)
{
if(Close[i+1]<Close[i+5])num = num + 1;
else num = 0;
	if (num > 0 && num < 10) {
		textVar = num;
		ObjectCreate(""+i, OBJ_TEXT, 0, Time[i+1],Low[i+1]-5*Point );
      ObjectSetText(""+i, ""+DoubleToStr(num,0), 10, "Arial", Red);
		}
		if (num == 9) {
		ObjectCreate(""+i, OBJ_TEXT, 0, Time[i+1],Low[i+1]-5*Point );
      ObjectSetText(""+i, ""+DoubleToStr(num,0), 16, "Arial", Red);
      }
		else if((Close[i+1]<Close[i+5])&& num>=10)
		{
		ObjectCreate(""+i, OBJ_TEXT, 0, Time[i+1],Low[i+1]-5*Point );
      ObjectSetText(""+i, ""+DoubleToStr(num,0), 10, "Arial", Orange);
		}


if(Close[i+1]>Close[i+5]) num1 = num1 + 1;
else num1 = 0;

	if (num1 > 0 && num1 < 10)
	   {
		textVar = num1;
		ObjectCreate(""+i, OBJ_TEXT, 0, Time[i+1],High[i+1]+10*Point );
      ObjectSetText(""+i, ""+DoubleToStr(num1,0), 10, "Arial", RoyalBlue);
		}
		if (num1 == 9) {
		ObjectCreate(""+i, OBJ_TEXT, 0, Time[i+1],High[i+1]+10*Point );
      ObjectSetText(""+i, ""+DoubleToStr(num1,0), 16, "Arial", RoyalBlue);
      }
		else if((Close[i+1]>Close[i+5])&& num1>=10)
		{
		ObjectCreate(""+i, OBJ_TEXT, 0, Time[i+1],High[i+1]+10*Point );
      ObjectSetText(""+i, ""+DoubleToStr(num1,0), 10, "Arial", LightSkyBlue);

		}


}

//----
return(0);
}
Comments