TD_DRP
Download script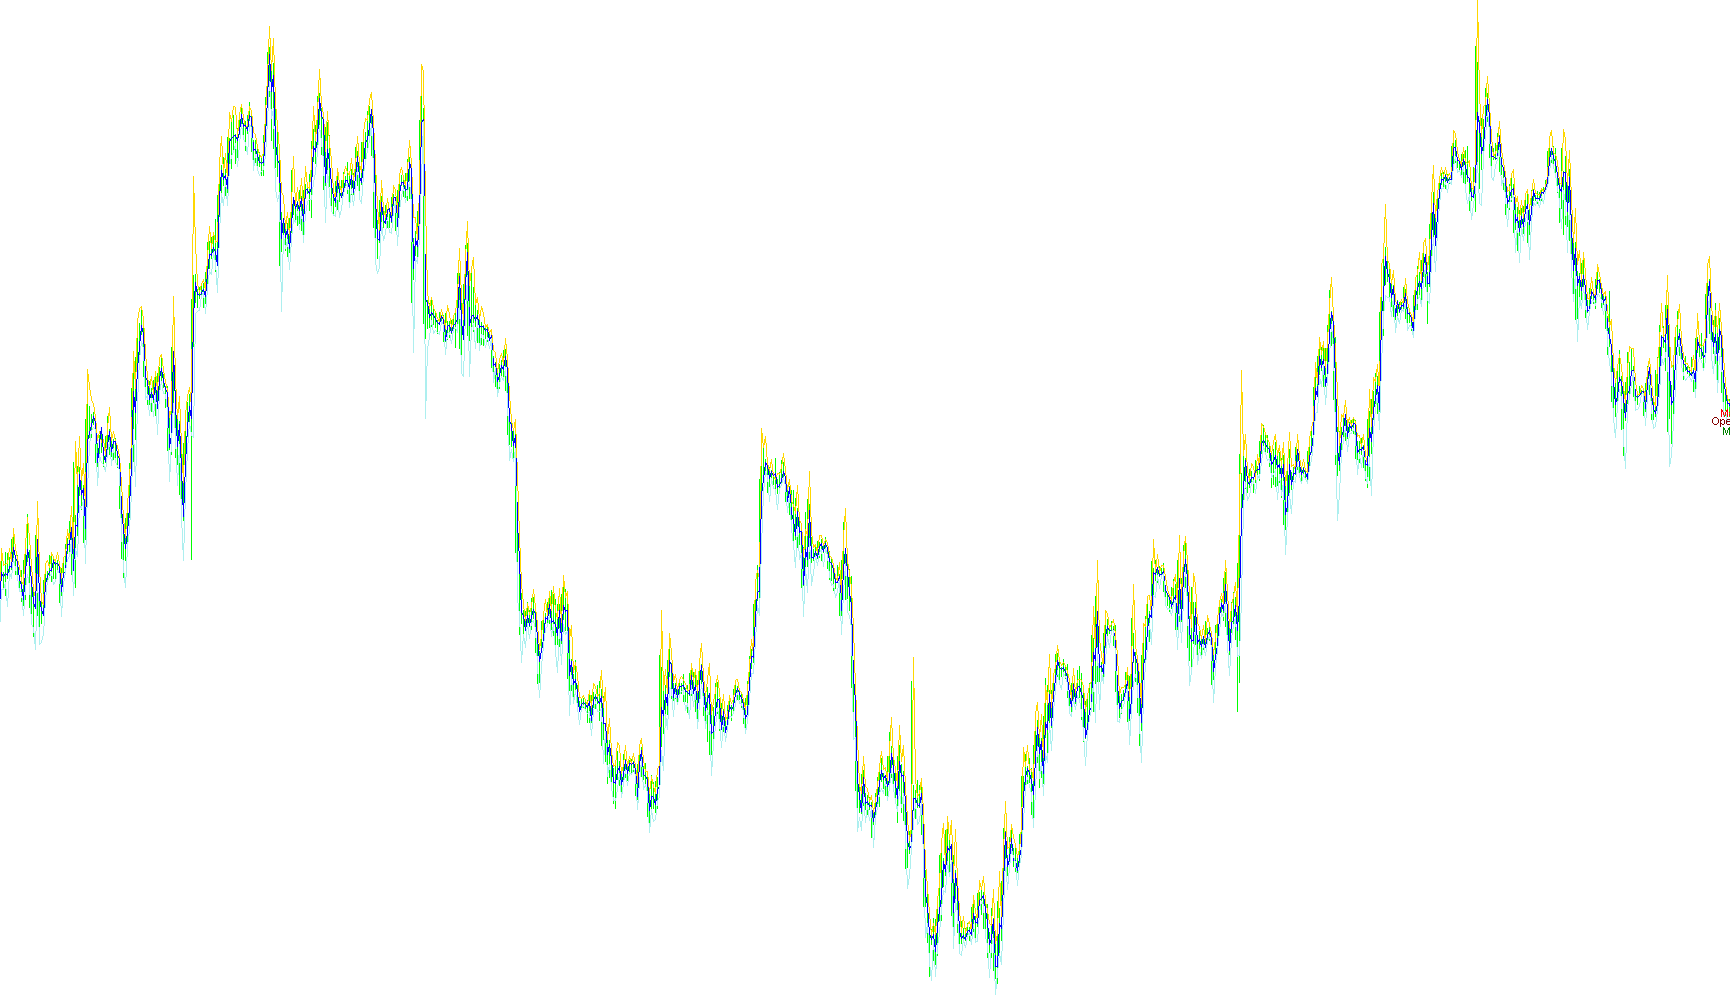
This script functions as a visual trading indicator designed to help you analyze price action by identifying specific mathematical levels on your trading chart. It breaks down the movement of price candles into three distinct zones, providing a clearer picture of where the "center" of the market is and how far the price has moved relative to its extreme points.
Core Logic and Functionality
1. Dynamic Price Calculations The tool works by scanning the historical data of every candle on your chart. It evaluates each candle's behavior (whether it closed higher, lower, or equal to its opening price) and applies a specific mathematical formula to find a reference point. This reference point essentially establishes a "balance" area based on the high, low, and closing prices of the previous candle.
2. Three-Line Visual Mapping The primary output of this script is the creation of three distinct lines that follow the price action:
- Max Line (Upper Boundary): This represents the upper mathematical limit calculated from the current price movement. It helps identify where the "ceiling" of the current momentum sits.
- Midline (Reference Point): This tracks the opening price, acting as the anchor for the current candle's movement.
- Min Line (Lower Boundary): This represents the lower mathematical limit, showing the "floor" of the current price action.
3. Real-Time Data Overlay To make these calculations easy to read at a glance, the script automatically generates text labels directly on your chart in real-time. It displays:
- The Max value (highlighted in red).
- The Min value (highlighted in green).
- The current Open price.
Practical Application for Traders
Instead of forcing you to manually calculate the volatility or the "fair value" of a candle, this script does the heavy lifting instantly. It provides a visual framework that highlights the range between the calculated minimum and maximum points. By observing how these three lines move in relation to one another, you can better visualize price volatility and potential zones of interest as they develop on the live chart.
//+------------------------------------------------------------------+
//|                                                       TD_DRP.mq4 |
//|                                                  Oleg-Vaócheslav |
//|                                                    http://www.ru |
//+------------------------------------------------------------------+
#property copyright "Oleg-Vaócheslav"
#property link      "http://www.ru"

#property indicator_chart_window
#property indicator_buffers 3

#property indicator_color1 Red
#property indicator_color2 Maroon
#property indicator_color3 Green

double X,  Max,  Min, Top, Down;
double maxline[],midline[],minline[],hline[];
string obj_name;
int code=250;
double n=1.0001;

//+------------------------------------------------------------------+
//| Custom indicator initialization function                         |
//+------------------------------------------------------------------+
int init()
  {
//---- indicators
//----

   SetIndexBuffer(0, maxline);
   SetIndexStyle (0, DRAW_LINE, STYLE_SOLID, 1);

   SetIndexBuffer(1, midline);
   SetIndexStyle (1, DRAW_LINE, STYLE_SOLID, 1);

   SetIndexBuffer(2, minline);
   SetIndexStyle (2, DRAW_LINE, STYLE_SOLID, 1);

 Comment("");

   return(0);
  }
//+------------------------------------------------------------------+
//| Custor indicator deinitialization function                       |
//+------------------------------------------------------------------+
int deinit()
  {
//----
   ObjectsDeleteAll();
//----
   return(0);
  }
//+------------------------------------------------------------------+
//| Custom indicator iteration function                              |
//+------------------------------------------------------------------+
int start()
  {
for (int i = Bars; i>=0; i--)
{
   if (Close[i+1]<Open[i+1])
   {
   X =((High[i+1]+Low[i+1]+Close[i+1]+Low[i+1])/2);
   Max = (X - Low[i+1]);
   Min = (X - High[i+1]);
   Top = (Max-Open[i]);
   Down= (Open[i]- Min);
   }

   if (Close[i+1]>Open[i+1])
   {
   X =((High[i+1]+Low[i+1]+Close[i+1]+High[i+1])/2);
   Max = (X - Low[i+1]);
   Min = (X - High[i+1]);
   Top = (Max-Open[i]);
   Down= (Open[i]- Min);
   }

   if (Close[i+1]==Open[i+1])
   {
   X =((High[i+1]+Low[i+1]+Close[i+1]+Close[i+1])/2);
   Max = (X - Low[i+1]);
   Min = (X - High[i+1]);
   Top = (Max-Open[i]);
   Down= (Open[i]- Min);
   }


// ÏÐÎÐÈÑÎÂÊÀ
   maxline[i] = Max;
   midline[i] = Open[i];
   minline[i] = Min;


}
Comment("Top: ",Top,"\nDown: ",Down);
   obj_name="maxline";
   if (ObjectFind(obj_name)==-1)
   {
      ObjectCreate(obj_name, OBJ_TREND, 0, Time[1], Max, Time[0], Max);
      ObjectSet(obj_name, OBJPROP_STYLE, STYLE_SOLID);
      ObjectSet(obj_name, OBJPROP_COLOR, DodgerBlue);
   } else {
      ObjectDelete(obj_name);
      ObjectCreate(obj_name, OBJ_TREND, 0, Time[1], Max, Time[0], Max);
      ObjectSet(obj_name, OBJPROP_STYLE, STYLE_DASH);
      ObjectSet(obj_name, OBJPROP_COLOR, DodgerBlue);
   }

      obj_name="midline";
   if (ObjectFind(obj_name)==-1)
   {
      ObjectCreate(obj_name, OBJ_TREND, 0, Time[1], Open[0], Time[0], Open[0]);
      ObjectSet(obj_name, OBJPROP_STYLE, STYLE_SOLID);
      ObjectSet(obj_name, OBJPROP_COLOR, DodgerBlue);
   } else {
      ObjectDelete(obj_name);
      ObjectCreate(obj_name, OBJ_TREND, 0, Time[1], Open[0], Time[0], Open[0]);
      ObjectSet(obj_name, OBJPROP_STYLE, STYLE_DASH);
      ObjectSet(obj_name, OBJPROP_COLOR, DodgerBlue);
   }

   obj_name="minline";
   if (ObjectFind(obj_name)==-1)
   {
      ObjectCreate(obj_name, OBJ_TREND, 0, Time[1], Min, Time[0], Min);
      ObjectSet(obj_name, OBJPROP_STYLE, STYLE_SOLID);
      ObjectSet(obj_name, OBJPROP_COLOR, DodgerBlue);
   } else {
      ObjectDelete(obj_name);
      ObjectCreate(obj_name, OBJ_TREND, 0, Time[1], Min, Time[0], Min);
      ObjectSet(obj_name, OBJPROP_STYLE, STYLE_DASH);
      ObjectSet(obj_name, OBJPROP_COLOR, DodgerBlue);
   }

   obj_name="midtext";
   if (ObjectFind(obj_name)==-1)
   {
      ObjectCreate(obj_name, OBJ_TEXT, 0, Time[0], Open[0]);
      ObjectSet(obj_name, OBJPROP_COLOR, Maroon);
      ObjectSetText(obj_name,"open",5);
   } else {
      ObjectDelete(obj_name);
      ObjectCreate(obj_name, OBJ_TEXT, 0, Time[0], Open[0]);
      ObjectSet(obj_name, OBJPROP_COLOR, Maroon);
      ObjectSetText(obj_name,"Open[0]",8);
   }

    obj_name="maxtext";
   if (ObjectFind(obj_name)==-1)
   {
      ObjectCreate(obj_name, OBJ_TEXT, 0, Time[0], Max);
      ObjectSet(obj_name, OBJPROP_COLOR, Red);
      ObjectSetText(obj_name,"open",5);
   } else {
      ObjectDelete(obj_name);
      ObjectCreate(obj_name, OBJ_TEXT, 0, Time[0], Max);
      ObjectSet(obj_name, OBJPROP_COLOR, Red);
      ObjectSetText(obj_name,"Max",8);
   }

     obj_name="mintext";
   if (ObjectFind(obj_name)==-1)
   {
      ObjectCreate(obj_name, OBJ_TEXT, 0, Time[0], Min);
      ObjectSet(obj_name, OBJPROP_COLOR, Green);
      ObjectSetText(obj_name,"open",5);
   } else {
      ObjectDelete(obj_name);
      ObjectCreate(obj_name, OBJ_TEXT, 0, Time[0], Min);
      ObjectSet(obj_name, OBJPROP_COLOR, Green);
      ObjectSetText(obj_name,"Min",8);
   }


//----
   return(0);
  }
//+------------------------------------------------------------------+
Comments