TEMA_RLH_v1
Download script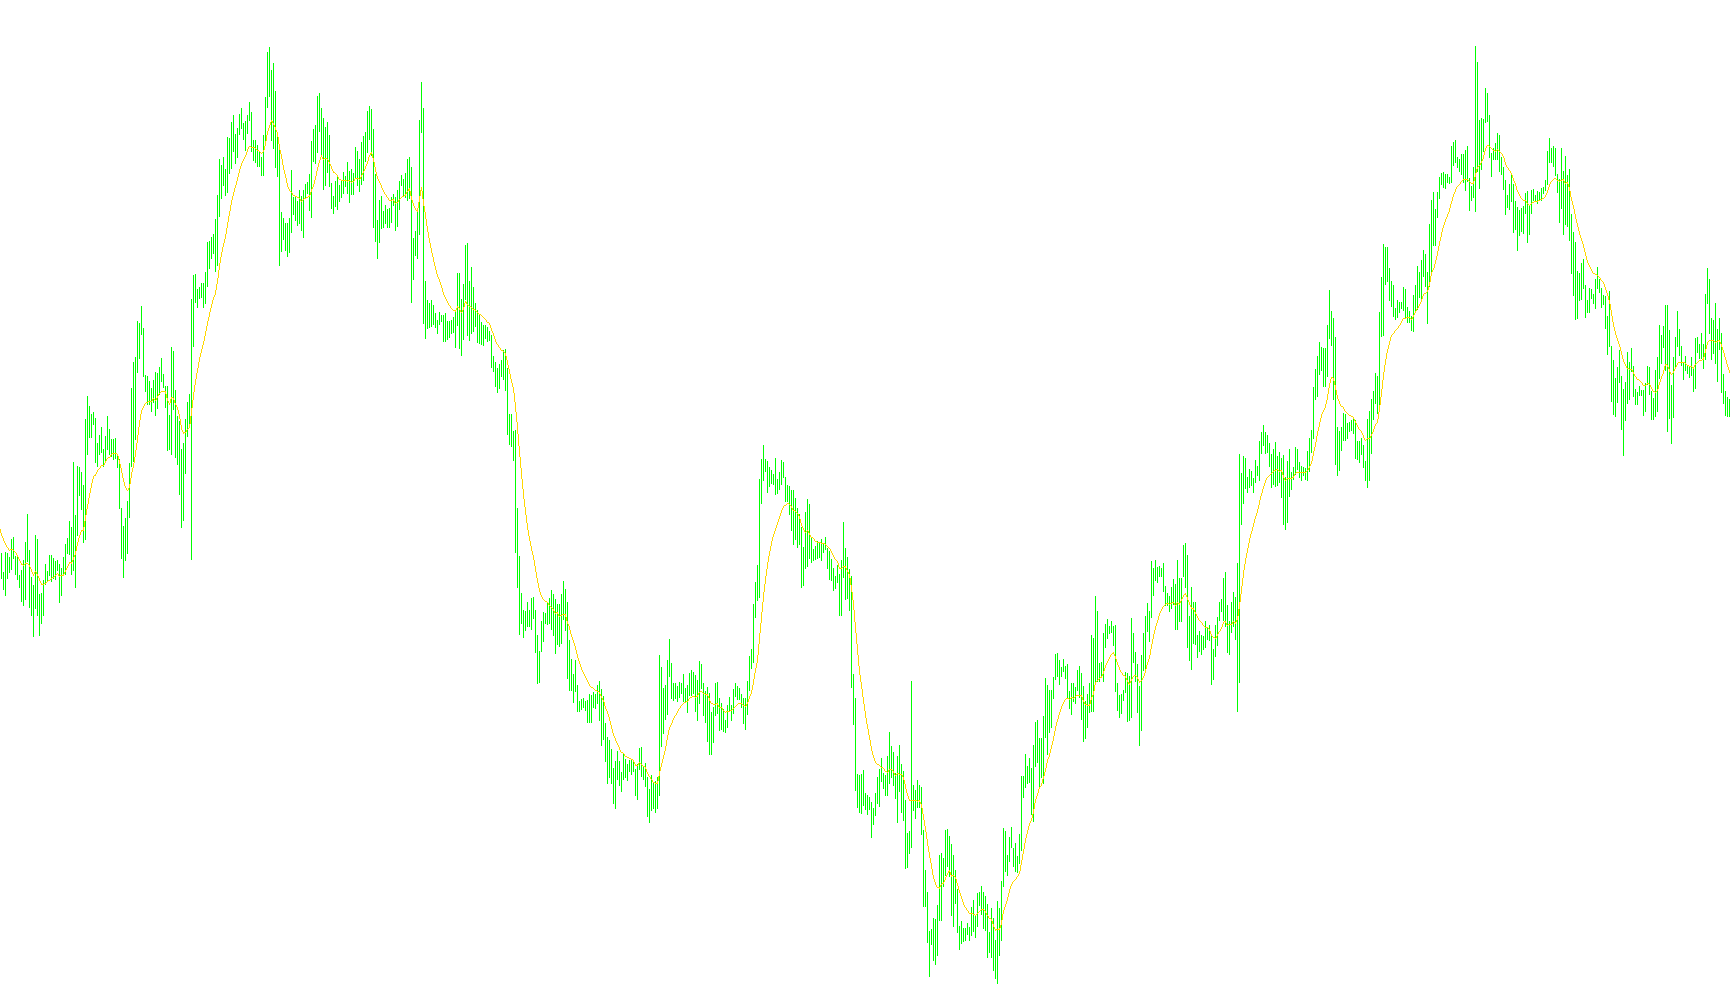
This tool is designed to provide a high-performance, smoothed view of price action by utilizing a specialized calculation known as the Triple Exponential Moving Average (TEMA). While standard moving averages often suffer from "lag"—the delay between a price movement occurring and the indicator reflecting that change—this script aims to minimize that delay while still maintaining a smooth, readable line.
How the Logic Works
The core logic of this script follows a multi-layered smoothing process. Instead of looking at the price in isolation, it creates a hierarchy of averages:
- The Primary Average: The script first calculates a standard Exponential Moving Average (EMA). This is the base layer that tracks the general direction of the price.
- The Secondary Average: It then takes the result of that first average and calculates an average of that average.
- The Tertiary Average: It repeats the process one more time, calculating an average of the secondary average.
By layering these calculations, the script captures different "depths" of price momentum.
The Final Calculation
The unique "Triple" logic comes from a specific mathematical formula that combines these three layers. It multiplies the first layer by three, subtracts the second layer multiplied by three, and adds the third layer back in.
This specific combination creates the final TEMA line. The goal of this interaction is to cancel out the sluggishness usually found in traditional moving averages. It allows the indicator to react more quickly to sudden price shifts while filtering out the "noise" of minor, insignificant fluctuations.
Visual Interpretation
The script provides four distinct visual components on your chart:
- Red Line: Represents the primary Exponential Moving Average (the base trend).
- Green Line: Shows the second layer of smoothing.
- Yellow Line: Shows the third layer of smoothing.
- Aqua Line: This is the final TEMA. It is the primary indicator you should watch, as it represents the optimized balance of all three previous layers, providing a responsive and smoothed trend line for your analysis.
//+------------------------------------------------------------------+
//|                                                       TEMA_RLH   |
//|                                    Copyright © 2006, Robert Hill |
//|                                       http://www.metaquotes.net/ |
//|                                                                  |
//| Based on the formula developed by Patrick Mulloy                 |
//|                                                                  |
//| It can be used in place of EMA or to smooth other indicators.    |
//|                                                                  |
//| TEMA = 3 * EMA - 3 * (EMA of EMA) + EMA of EMA of EMA            |
//|                                                                  |
//|  Red is EMA, Green is EMA of EMA, Yellow is Ema of Ema of Ema    |
//|  Aqua is TEMA                                                    |
//|                                                                  |
//+------------------------------------------------------------------+
#property  copyright "Copyright © 2006, Robert Hill "
#property  link      "http://www.metaquotes.net/"

//---- indicator settings
#property  indicator_chart_window
#property  indicator_buffers 4
#property  indicator_color1  Red
#property  indicator_color2  Green
#property  indicator_color3  Yellow
#property  indicator_color4  Aqua
#property  indicator_width1  1
#property  indicator_width2  1
#property  indicator_width3  1
#property  indicator_width4  2

extern int EMA_Period = 14;

//---- buffers
double Ema[];
double EmaOfEma[];
double EmaOfEmaOfEma[];
double Tema[];


//+------------------------------------------------------------------+
//| Custom indicator initialization function                         |
//+------------------------------------------------------------------+
int init()
  {

//---- drawing settings
   SetIndexStyle(0,DRAW_LINE);
   SetIndexStyle(1,DRAW_LINE);
   SetIndexStyle(2,DRAW_LINE);
   SetIndexStyle(3,DRAW_LINE);
   SetIndexDrawBegin(0,EMA_Period);
   IndicatorDigits(MarketInfo(Symbol(),MODE_DIGITS)+2);

//---- 3 indicator buffers mapping
   if(!SetIndexBuffer(0,Ema) &&
      !SetIndexBuffer(1,EmaOfEma) &&
      !SetIndexBuffer(2,EmaOfEmaOfEma) &&
      !SetIndexBuffer(3,Tema))
      Print("cannot set indicator buffers!");
//   if(!SetIndexBuffer(0,Tema) )
//      Print("cannot set indicator buffers!");
//---- name for DataWindow and indicator subwindow label
   IndicatorShortName("TEMA("+EMA_Period+")");
//---- initialization done
   return(0);
  }

int start()
{
   int i, limit;
   int    counted_bars=IndicatorCounted();
   if(counted_bars>0) counted_bars--;
   limit=Bars-counted_bars;


   for(i = limit; i >= 0; i--)
       Ema[i] = iMA(NULL,0,EMA_Period,0,MODE_EMA,PRICE_CLOSE,i);
   for(i = limit; i >=0; i--)
       EmaOfEma[i] = iMAOnArray(Ema,Bars,EMA_Period,0,MODE_EMA,i);

   for(i = limit; i >=0; i--)
       EmaOfEmaOfEma[i] = iMAOnArray(EmaOfEma,Bars,EMA_Period,0,MODE_EMA,i);

//========== COLOR CODING ===========================================

   for(i = limit; i >=0; i--)
       Tema[i] = 3 * Ema[i] - 3 * EmaOfEma[i] + EmaOfEmaOfEma[i];

      return(0);
  }
//+------------------------------------------------------------------+
Comments