Support and Resistance (Barry)
Indicator

Support and Resistance (Barry)

iFractals

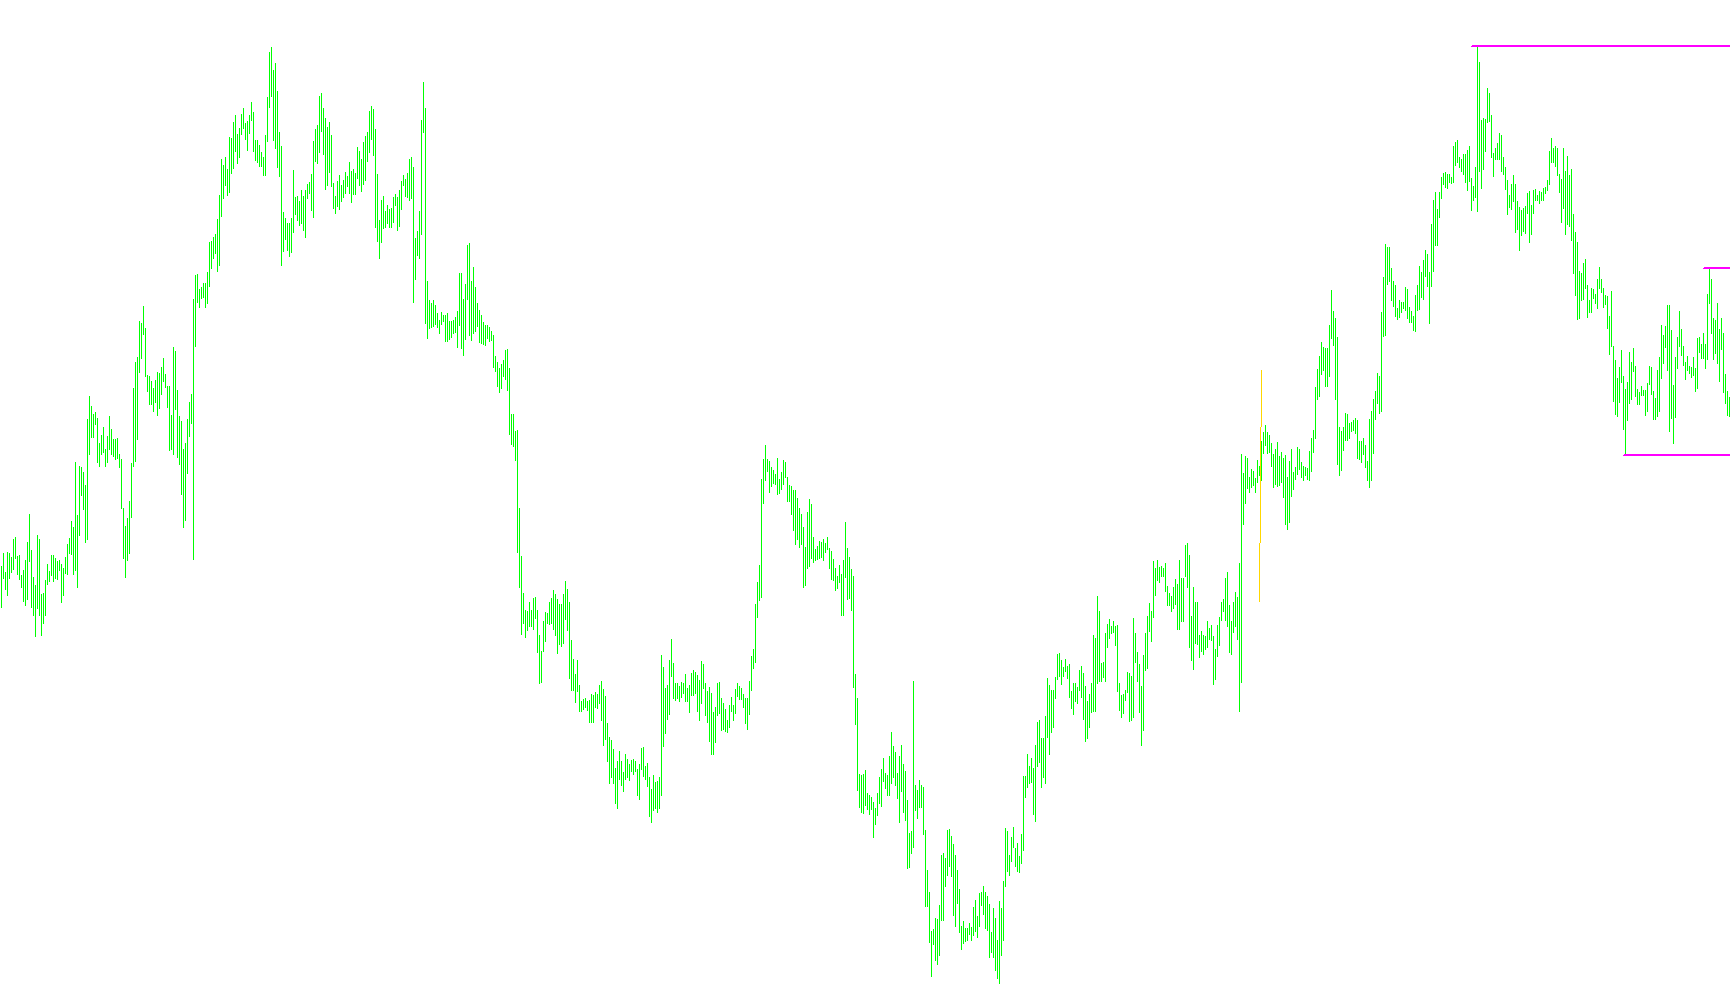
Identifies structural price extremes by recursively propagating upper and lower fractal values to map continuous zones of supply and demand.

Support and Resistance (Barry)_001
Indicator

Support and Resistance (Barry)_001

iFractals

The algorithm identifies and projects historical structural turning points by iterating through upper and lower fractal extremes to map continuous price ceilings and floors.

Support and Resistance (Barry)_002
Indicator

Support and Resistance (Barry)_002

iFractals

This indicator identifies key price pivot points by recursively propagating historical upper and lower fractal extremes across the chart.

Support and Resistance (Barry)_003
Indicator

Support and Resistance (Barry)_003

iFractals

This indicator identifies structural market extremes by propagating the most recent upper and lower fractal highs and lows as persistent horizontal price levels.

Support and Resistance (Barry)_004
Indicator

Support and Resistance (Barry)_004

iFractals

Identifies structural price ceilings and floors by mapping historical fractal extremes across the chart timeline.

Support and Resistance (Barry)_005
Indicator

Support and Resistance (Barry)_005

iFractals

This indicator identifies historical price extremes by detecting local highs and lows via fractal patterns to project continuous horizontal zones.

Indicator

Support and Resistance (Barry)_MTF

Support and Resistance (Barry)_v1
Indicator

Support and Resistance (Barry)_v1

iFractals

Identifies structural price ceilings and floors by persisting historical fractal extrema across the chart timeline.

Support and Resistance WITH FIBONACCI  LA
Indicator

Support and Resistance WITH FIBONACCI LA

iMA

This indicator identifies structural price extremes by detecting momentum shifts relative to a Simple Moving Average and dynamically projecting Fibonacci-style zones between local highs and lows.

Support and Resistance WITH FIBONACCI  LA    _001
Indicator

Support and Resistance WITH FIBONACCI LA _001

iMA

This indicator identifies structural price levels by detecting Moving Average crossovers and dynamically projects Fibonacci retracement zones based on historical high and low extremes.

Support and Resistance
Indicator

Support and Resistance

iFractals

This indicator identifies key structural price boundaries by propagating historical upper and lower fractal peaks into continuous visual zones.

Support and Resistance_001
Indicator

Support and Resistance_001

iFractals

This indicator identifies and projects horizontal price levels by tracking consecutive local maxima and minima detected via the fractal geometry algorithm.

Indicator

Support and Resistance_002

Support and Resistance_v1
Indicator

Support and Resistance_v1

iMA

Identifies historical price extremes by detecting SMA crossover events and projects Fibonacci-based zones between detected support and resistance levels.

Support and Resistance_v2
Indicator

Support and Resistance_v2

iFractals

The algorithm identifies structural price extremes by propagating local fractal highs and lows across the chart to visualize continuous supply and demand zones.

Support and Resistance_v3
Indicator

Support and Resistance_v3

iFractals

Identifies structural price ceilings and floors by propagating historical upper and lower fractal peak values across the chart history.

Support and Resistance_v4
Indicator

Support and Resistance_v4

iFractals

The indicator identifies historical price extremes by tracking successive fractal highs and lows to project continuous horizontal supply and demand zones.

Support Resistance
Indicator

Support Resistance

This indicator identifies and projects historical pivot points as horizontal supply and demand zones by analyzing multi-period extrema and filtering for significant price structural breaks.

Support Resistance_v1
Indicator

Support Resistance_v1

This indicator identifies and plots historical price levels by scanning multiple timeframes to project continuous trend lines based on peak and trough deviations.

Support Resistance_v2
Indicator

Support Resistance_v2

This indicator identifies significant price pivots across multiple timeframes by filtering historical extremes and projecting them as dynamic horizontal trendlines to highlight key structural zones.

Indicator

Support-Resistance Indicator

Support_and_Resistance
Indicator

Support_and_Resistance

This indicator projects chronological daily highs and lows onto the chart to visualize significant price boundaries and historical structural zones.

Support_and_Resistance_FOREX
Indicator

Support_and_Resistance_FOREX

This indicator dynamically plots historical daily high and low extremes to visualize multi-day price boundaries and current intraday volatility limits.

Support_Resistance v1
Indicator

Support_Resistance v1

This indicator identifies and projects significant historical supply and demand zones by dynamically filtering local extrema across multiple timeframes to establish structural price boundaries.

Support_Resistance
Indicator

Support_Resistance

This indicator identifies significant historical support and resistance levels by filtering nested highs and lows across specific timeframes to project dynamic price boundaries.

Support_Resistance_RD 240m thin
Indicator

Support_Resistance_RD 240m thin

This indicator identifies and plots significant price pivots by calculating localized highs and lows across multiple timeframes while dynamically pruning non-extreme structural levels.

Support_Resistance_v1
Indicator

Support_Resistance_v1

This indicator identifies significant price structural levels by dynamically mapping historical high and low pivot points across multiple timeframes to project persistent support and resistance zones.

Sv2
Indicator

Sv2

This indicator identifies directional shifts by calculating price expansion limits relative to historical highs and lows over a sliding window to generate momentum-based signals.

SvmPower
Indicator

SvmPower

This indicator visualizes real-time multi-source signal power by retrieving and plotting external global variables onto a dynamic shifting buffer system.

SvmPower_002
Indicator

SvmPower_002

This indicator visualizes real-time signal strength and auxiliary power metrics retrieved from external global variables into a dynamic, time-delimited visual buffer.

SVM_train_v01
Indicator

SVM_train_v01

iMA

This indicator utilizes a Support Vector Machine (SVM) machine learning model to process historical price action data and generate predictive output signals based on pre-defined risk parameters.

SVM_train_v02
Indicator

SVM_train_v02

iMA

This indicator leverages a Support Vector Machine (SVM) architecture to train on historical price action data and project future movement probabilities based on predefined risk parameters.

SVM_v01
Indicator

SVM_v01

This Expert Advisor utilizes a Support Vector Machine (SVM) algorithm to perform binary classification by training on local data files and predicting market outcomes through scaled feature analysis.

svs_trend
Indicator

svs_trend

iMA

The algorithm calculates and visualizes the divergence between dual-period weighted moving averages through recursive summation and variance offsets.

svs_trend_v2
Indicator

svs_trend_v2

The indicator analyzes the variance and mean reversion of multi-period average price pivots to isolate trend acceleration components.

swap
Indicator

swap

Retrieves and displays the overnight swap long and short interest rates directly on the trading chart.

swap_or_cost_point
Indicator

swap_or_cost_point

This script calculates and displays the real-time financial overhead, including swap costs and weighted lot values, for a diversified basket of major currency pairs.

Sweet Spot Finder v3.4
Indicator

Sweet Spot Finder v3.4

This indicator identifies price reversal points by detecting local extrema across four distinct temporal horizons using a variable-sensitivity fractal algorithm.

SweetSpots GOLD
Indicator

SweetSpots GOLD

Dynamically projects a hierarchical network of horizontal price boundaries based on modular arithmetic to identify recurring liquidity zones and structural milestones.

SweetSpots
Indicator

SweetSpots

Dynamically projects a multi-tiered hierarchy of horizontal price levels based on fixed pip intervals and nested frequency scaling.

SweetSpotsGOLD
Indicator

SweetSpotsGOLD

Automatically plots a multi-layered grid of horizontal price levels based on modular arithmetic to identify key liquidity zones and structural milestones.

Swing_Point
Indicator

Swing_Point

This indicator identifies structural trend reversals by monitoring price breaches against dynamic high and low extremes filtered by a user-defined point offset.

Swing_Point_v1
Indicator

Swing_Point_v1

This indicator identifies structural trend shifts by monitoring price breaches of previous high and low extremes relative to a user-defined reversal point threshold.

Swing_Point_v2
Indicator

Swing_Point_v2

This indicator identifies structural trend shifts by detecting price action breaches of historical extrema modified by a specific reversal point threshold.

Swing_Point_v3
Indicator

Swing_Point_v3

This indicator identifies structural trend shifts by detecting price breaches of significant swing extremes following a predefined point-based exhaustion threshold.

Swing_ZZ
Indicator

Swing_ZZ

This indicator identifies structural market pivots by tracking consecutive price breaches to define trend reversals and significant swing points.

Swing_ZZ_001
Indicator

Swing_ZZ_001

This algorithm identifies structural trend reversals by monitoring sequential price expansions and filtering out internal noise to mark significant high and low pivot points.

Swing_ZZ_with_alert
Indicator

Swing_ZZ_with_alert

This indicator identifies structural trend reversals by monitoring consecutive bar price movements to plot significant high and low swing points.

SymbolInfo
Indicator

SymbolInfo

This script parses real-time market data for a predefined list of currency pairs and exports swap rates, spreads, stop levels, and calculated margin requirements into a structured CSV file.

SymbolList
Indicator

SymbolList

This script exhaustively generates and validates all possible market instrument names based on predefined character sets to export comprehensive trading specifications to a CSV file.