Support_Resistance
Download script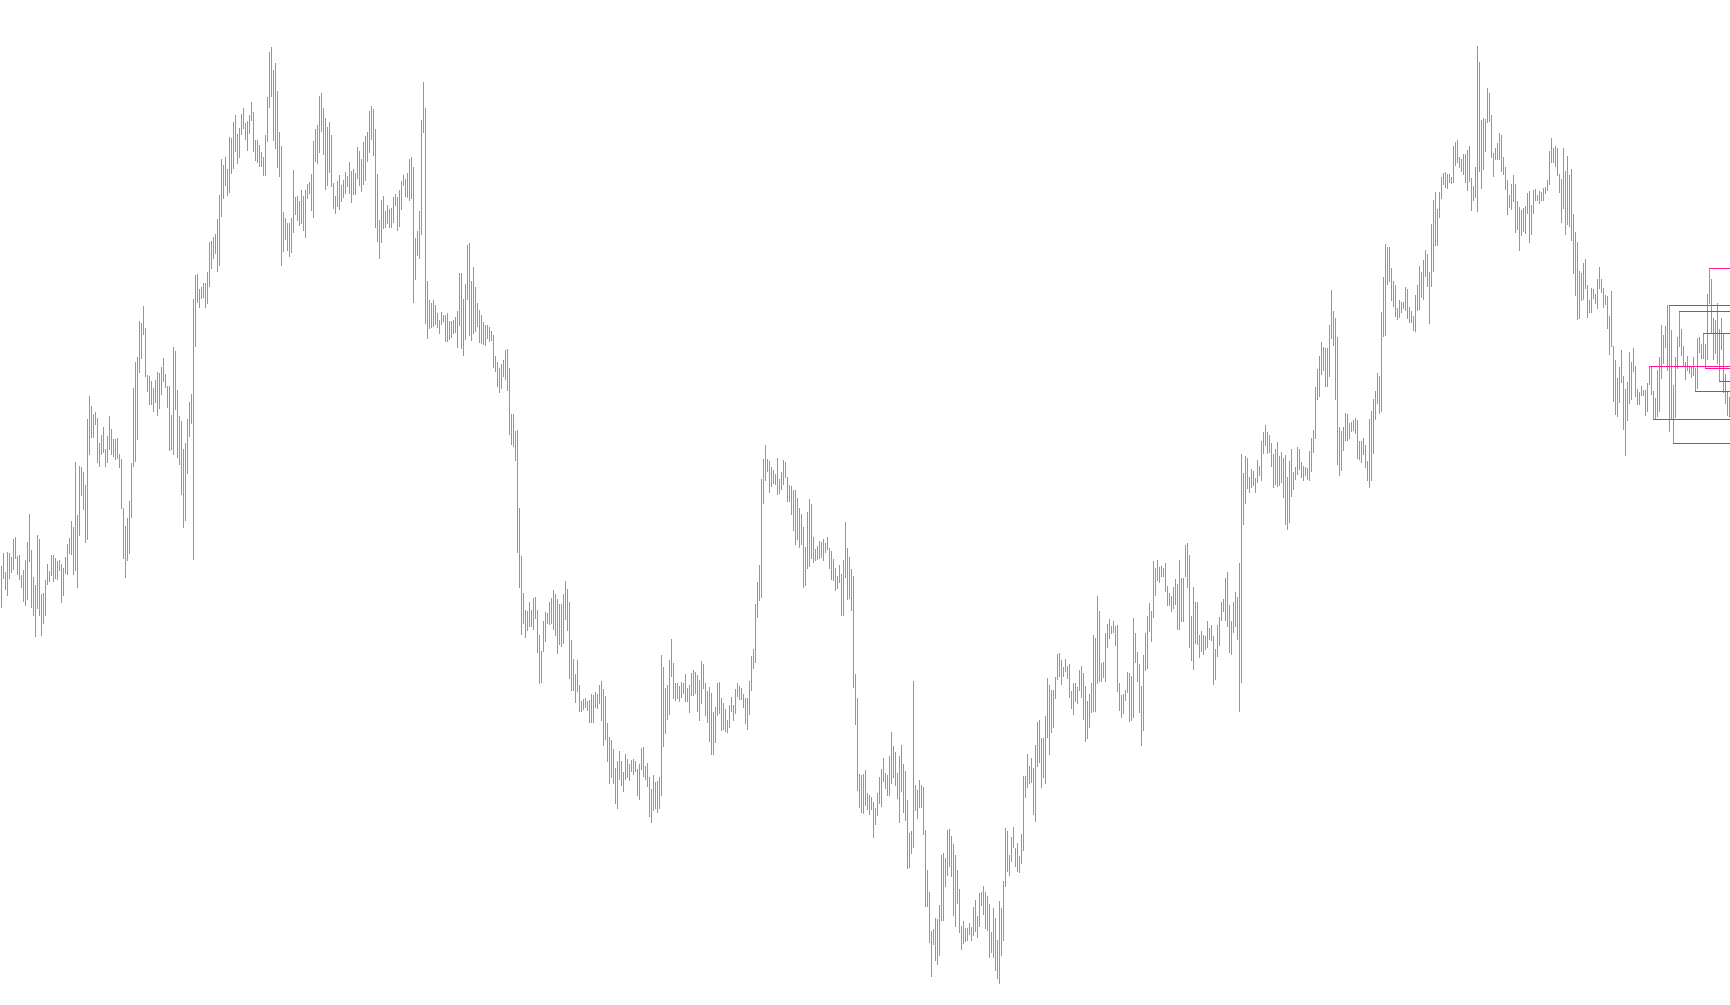
This script is designed to automatically identify and plot key Support and Resistance (S/R) levels on your trading charts. Unlike standard indicators that might clutter your screen with every minor price fluctuation, this tool uses a multi-frame logic to find significant price "ceilings" and "floors" based on historical data.
Core Functionality
Multi-Timeframe Analysis The script is capable of looking at specific timeframes (such as 15-minute, 1-hour, or daily charts). It identifies the highest highs and lowest lows over a set period to determine where the market has historically struggled to move past. Depending on which timeframe you select, the script changes its color scheme to help you visually distinguish between different time scales at a glance.
Smart Level Detection The logic works by scanning back through history to find significant price peaks and valleys. It doesn't just pick every high point; it filters them based on "depth" (how far back it looks) and "deviation" (ensuring the price movement is significant enough to be considered a real structural level).
Dynamic Conflict Resolution One of the more sophisticated aspects of this script is how it handles overlapping data. The logic includes a "cutting" process:
- Resistance Management: If two high points are detected near each other, the script intelligently decides which one is the primary resistance. If a new, higher price peak is found that "overtakes" an older one, it can adjust the visual layout to ensure the chart remains clean and readable.
- Support Management: Similarly, for price floors, it ensures that only the most relevant support levels are prioritized.
Visual Cleanup & Organization To prevent your chart from becoming messy, the script includes several automated "housekeeping" features:
- Auto-Deletion: When you remove the script or close the chart, it can automatically clean up the lines it drew so they don't stay behind.
- Object Management: It identifies its own drawn lines and manages them dynamically. It ensures that only the most relevant recent levels are kept visible, deleting older "pending" objects to keep your workspace organized.
- Trend Lines: The levels are plotted as horizontal trend lines with "rays," allowing you to see where these price boundaries might extend into future trading sessions.
Summary for the Trader
Essentially, this tool acts as an automated technical analyst. It scans the history of a specific timeframe, filters out the "noise," identifies the most mathematically significant support and resistance zones, and draws them clearly on your chart. This allows you to see where major price battles are likely to occur without having to manually draw lines on every historical candle.
//+------------------------------------------------------------------+
//|                                             SUPRESMultiFrame.mq4 |
//|                                                                  |
//|                                                            RD    |
//+------------------------------------------------------------------+
#property copyright "RD"
#property link      "marynarz15@wp.pl"
#property indicator_chart_window
#define MaxObject    1000
//---- indicator parameters
extern int TimeFrame=15;
extern int BarsMax=144;
extern int ExtDepth=13;
extern int ExtDeviation=1;
extern int ExtBackstep=5;
extern bool DeleteObjectsOnExit=true;
extern color LineColor1=RosyBrown;
extern color LineColor5=Aqua;
extern color LineColor15=DeepPink;
extern color LineColor30=PaleVioletRed;
extern color LineColor60=Red;
extern color LineColor240=DarkOrange;
extern color LineColor1440=DeepSkyBlue;
extern color LineColor10080=Lime;
//-----------------------
double ExtMapBuffer[];
double ExtMapBuffer2[];
int SUPRESCount=0;
int linewidth;
string NamePattern;
color LineColor;


//+------------------------------------------------------------------+
//|                           Delete objects                         |
//+------------------------------------------------------------------+
int DeleteSupRes()
   {
      int ObjectCount=ObjectsTotal();
      string names[MaxObject];
      for (int i=0; i<ObjectCount;i++)
         names[i]=ObjectName(i);
      for (i=0; i<ObjectCount;i++)
      {
         string objname=names[i];
         objname=StringSubstr(objname,0,StringLen(NamePattern));
         if (objname!=NamePattern || ObjectType(names[i])!=OBJ_TREND)
               names[i]="";
      }
      for (i=0; i<ObjectCount;i++)
      {
         if (names[i]!="") {
         ObjectDelete(names[i]);}
      }
      return(0);
   }

//+------------------------------------------------------------------+
//| Custom indicator initialization function                         |
//+------------------------------------------------------------------+
int init()
  {
   IndicatorBuffers(2);
   SetIndexBuffer(0,ExtMapBuffer);
   SetIndexBuffer(1,ExtMapBuffer2);
   SetIndexEmptyValue(0,0.0);
   ArraySetAsSeries(ExtMapBuffer,true);
   ArraySetAsSeries(ExtMapBuffer2,true);
   switch (TimeFrame)
     {
        case 1: linewidth=1; LineColor=LineColor1; break;
        case 5: linewidth=1; LineColor=LineColor5; break;
        case 15: linewidth=1; LineColor=LineColor15; break;
        case 30: linewidth=1; LineColor=LineColor30; break;
        case 60: linewidth=1; LineColor=LineColor60; break;
        case 240: linewidth=1; LineColor=LineColor240; break;
        case 1440: linewidth=1; LineColor=LineColor1440; break;
        case 10080: linewidth=1; LineColor=LineColor10080; break;
        default: linewidth=1; TimeFrame=Period(); break;
     }
   NamePattern=DoubleToStr(TimeFrame,0)+" SUPRES ";
   if (BarsMax<55) BarsMax=55;

   DeleteSupRes();
   return(0);
  }

//+------------------------------------------------------------------+
//| Custom indicator deinitialization function                       |
//+------------------------------------------------------------------+
int deinit()
  {
      if (DeleteObjectsOnExit) DeleteSupRes();
      return(0);
  }

//+------------------------------------------------------------------+
//|                                                                  |
//+------------------------------------------------------------------+
int start()
  {
   int    shift, back,lasthighpos,lastlowpos;
   double val,res;
   double curlow,curhigh,lasthigh,lastlow;
   string objectname;

   if(BarsMax==0) {BarsMax=Bars/2;}// return(0);
   for(shift=iBars(NULL,TimeFrame)-ExtDepth; shift>=0; shift--)
     {
      val=iLow(NULL,TimeFrame,Lowest(NULL,TimeFrame,MODE_LOW,ExtDepth,shift));
      if(val==lastlow) val=0.0;
      else
        {
         lastlow=val;
         if((iLow(NULL,TimeFrame,shift)-val)>(ExtDeviation*Point)) val=0.0;
         else
           {
            for(back=1; back<=ExtBackstep; back++)
              {
               res=ExtMapBuffer[shift+back];
               if((res!=0)&&(res>val)) ExtMapBuffer[shift+back]=0.0;
              }
           }
        }
      ExtMapBuffer[shift]=val;
      //--- high
      val=iHigh(NULL,TimeFrame,Highest(NULL,TimeFrame,MODE_HIGH,ExtDepth,shift));
      if(val==lasthigh) val=0.0;
      else
        {
         lasthigh=val;
         if((val-iHigh(NULL,TimeFrame,shift))>(ExtDeviation*Point)) val=0.0;
         else
           {
            for(back=1; back<=ExtBackstep; back++)
              {
               res=ExtMapBuffer2[shift+back];
               if((res!=0)&&(res<val)) ExtMapBuffer2[shift+back]=0.0;
              }
           }
        }
      ExtMapBuffer2[shift]=val;
     }

   // final cutting
   lasthigh=-1; lasthighpos=-1;
   lastlow=-1;  lastlowpos=-1;

   for(shift=iBars(NULL,TimeFrame)-ExtDepth; shift>=0; shift--)
     {
      curlow=ExtMapBuffer[shift];
      curhigh=ExtMapBuffer2[shift];
      if((curlow==0)&&(curhigh==0)) continue;
      //---
      if(curhigh!=0)
        {
         if(lasthigh>0)
           {
            if(lasthigh<curhigh) ExtMapBuffer2[lasthighpos]=0;
            else ExtMapBuffer2[shift]=0;
           }
         //---
         if(lasthigh<curhigh || lasthigh<0)
           {
            lasthigh=curhigh;
            lasthighpos=shift;
           }
         lastlow=-1;
        }
      //----
      if(curlow!=0)
        {
         if(lastlow>0)
           {
            if(lastlow>curlow) ExtMapBuffer[lastlowpos]=0;
            else ExtMapBuffer[shift]=0;
           }
         //---
         if((curlow<lastlow)||(lastlow<0))
           {
            lastlow=curlow;
            lastlowpos=shift;
           }
         lasthigh=-1;
        }
     }

   for(shift=iBars(NULL,TimeFrame)-1; shift>=0; shift--)
     {
      if(shift>=iBars(NULL,TimeFrame)-ExtDepth) ExtMapBuffer[shift]=0.0;
      else
        {
         res=ExtMapBuffer2[shift];
         if(res!=0.0) ExtMapBuffer[shift]=res;
        }
     }
 ///////////////////////// Lines creation /////////////////
   int count=0;
   double TempBufferPrice[MaxObject];
   int TempBufferBar[MaxObject];
   string ObjectNames[MaxObject];
 //////////////////////// lists of lines //////////////////
   for(shift=BarsMax; shift>0; shift--)
       if (ExtMapBuffer[shift]>0)
         {
            count++;
            TempBufferPrice[count-1]=ExtMapBuffer[shift];
            TempBufferBar[count-1]=shift;
         }
   for(int i=0; i<count; i++)
         ObjectNames[i]=/*TimeFrame+"m S/R("+i+")"+DoubleToStr(TempBufferPrice[i],Digits)+" "+*/
                        TimeToStr(iTime(NULL,TimeFrame,TempBufferBar[i]),TIME_DATE|TIME_MINUTES);

 /////// deleting pending objects ///////////////
   int ObjectForDeleteCount=0;
   string ObjectsForDelete[MaxObject];
   for(i=0; i<ObjectsTotal(); i++)
      {
         objectname=ObjectName(i);
         if (StringSubstr(objectname,0,StringLen(NamePattern))==NamePattern)
            {
               ObjectForDeleteCount++;
               ObjectsForDelete[ObjectForDeleteCount-1]=objectname;
            }
      }
   for(i=0; i<count-2; i++)
      {
         objectname=ObjectNames[i];
            for(int j=0; j<ObjectForDeleteCount; j++)
                 if(ObjectsForDelete[j]==objectname)
                  {
                      ObjectsForDelete[j]="";
                      break;
                  }
      }
   for(j=0; j<ObjectForDeleteCount; j++)
      if (ObjectsForDelete[j]!="")
      {
         ObjectDelete(ObjectsForDelete[j]);
      }
 ////////////// objects plotting /////////////////
   for(i=0; i<count; i++)
      {
         if (ObjectFind(ObjectNames[i])==-1)
            {
                ObjectCreate(ObjectNames[i],OBJ_TREND,0,iTime(NULL,TimeFrame,TempBufferBar[i]),TempBufferPrice[i],
                                 iTime(NULL,TimeFrame,TempBufferBar[i])+10080*60,TempBufferPrice[i]);
                ObjectSet(ObjectNames[i],OBJPROP_WIDTH,linewidth);
                ObjectSet(ObjectNames[i],OBJPROP_COLOR,LineColor);
                ObjectSet(ObjectNames[i],OBJPROP_RAY,True);
                ObjectSetText(ObjectNames[i],ObjectNames[i]/*+" "+DoubleToStr(TempBufferPrice[i],Digits),8,"Courier",LightSteelBlue*/);
            }
      }
}
Comments