Support and Resistance_001
Download script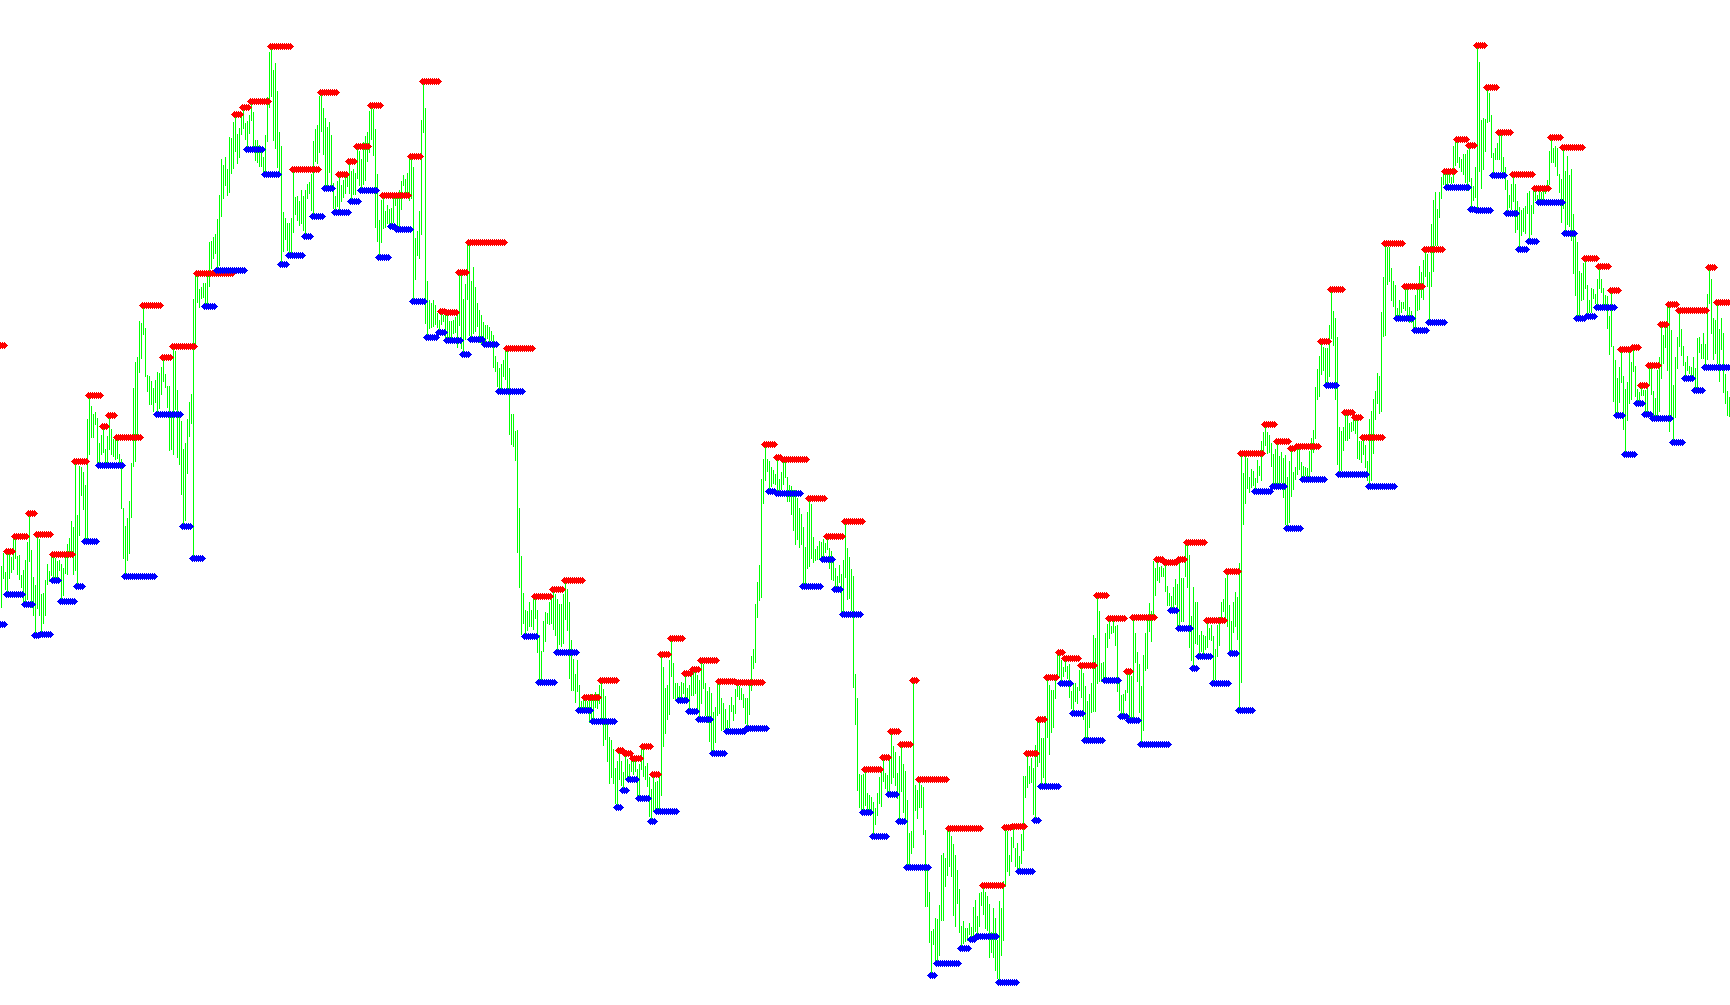
This tool is designed to automatically identify and visualize key price levels on your trading chart, specifically focusing on "Support" and "Resistance" zones. In trading, these represent areas where the market has historically struggled to move past—think of resistance as a "ceiling" that prevents prices from rising easily, and support as a "floor" that prevents prices from falling further.
How the Logic Works
The script functions by scanning the historical price data of your selected asset to find specific structural turning points. It achieves this through the following process:
- Identifying Peaks and Troughs: The logic looks for "Fractals," which are distinct geometric patterns in the price movement. Specifically, it hunts for local highs (peaks) and local lows (troughs) where the price reverses direction.
- Defining Resistance (The Ceiling): When the script detects a significant upper peak, it marks that price level as a point of resistance. It displays this on your chart in Red, helping you see where sellers have historically stepped in to push prices down.
- Defining Support (The Floor): Simultaneously, the script looks for significant lower troughs. When identified, these are marked in Blue, highlighting areas where buyers have historically entered the market to prop up the price.
- Continuous Mapping: Rather than just showing a single point, the logic carries these values forward across the chart. If a new peak or trough isn't found at a specific moment, the script "remembers" the previous level and maintains it, creating a continuous visual line of historical significance.
Visual Representation
Instead of cluttering your screen with complex data, the tool places small dots on the chart to pinpoint these levels:
- Red Dots signify Resistance zones.
- Blue Dots signify Support zones.
By providing these visual cues, the script allows you to see at a glance where the "battle lines" are drawn in the market, helping you anticipate potential price reactions based on historical behavior.
//+------------------------------------------------------------------+
//|                Support and Resistance                            |
//|                Copyright © 2004/5     Barry Stander              |
//|                http://www.4Africa.net/4meta/                     |
//+------------------------------------------------------------------+

#property copyright "Support and Resistance             Barry_Stander_4@yahoo.com"
#property link      "http://www.4Africa.net/4meta/"
#property indicator_chart_window
#property indicator_buffers 2
#property indicator_color1 Red
#property indicator_color2 Blue

//---- buffers
double v1[];
double v2[];
double val1;
double val2;
int i;

int init()
  {

  IndicatorBuffers(2);

   SetIndexArrow(0, 119);
   SetIndexStyle(0,DRAW_ARROW,STYLE_DOT,1,Red);
   SetIndexDrawBegin(0,i-1);
   SetIndexBuffer(0, v1);
   SetIndexLabel(0,"Resistance");

   SetIndexArrow(1, 119);
   SetIndexStyle(1,DRAW_ARROW,STYLE_DOT,1,Blue);
   SetIndexDrawBegin(1,i-1);
   SetIndexBuffer(1, v2);
   SetIndexLabel(1,"Support");

   return(0);
  }

int start()
  {

  i=Bars;
while(i>=0)
 {

   val1 = iFractals(NULL, 0, MODE_UPPER,i);
    if (val1 > 0)
     v1[i]=High[i];
    else
     v1[i] = v1[i+1];

   val2 = iFractals(NULL, 0, MODE_LOWER,i);
    if (val2 > 0)
     v2[i]=Low[i];
    else
     v2[i] = v2[i+1];

     i--;
 }

 return(0);
}

//+------------------------------------------------------------------+
Comments