Support and Resistance (Barry)
Download script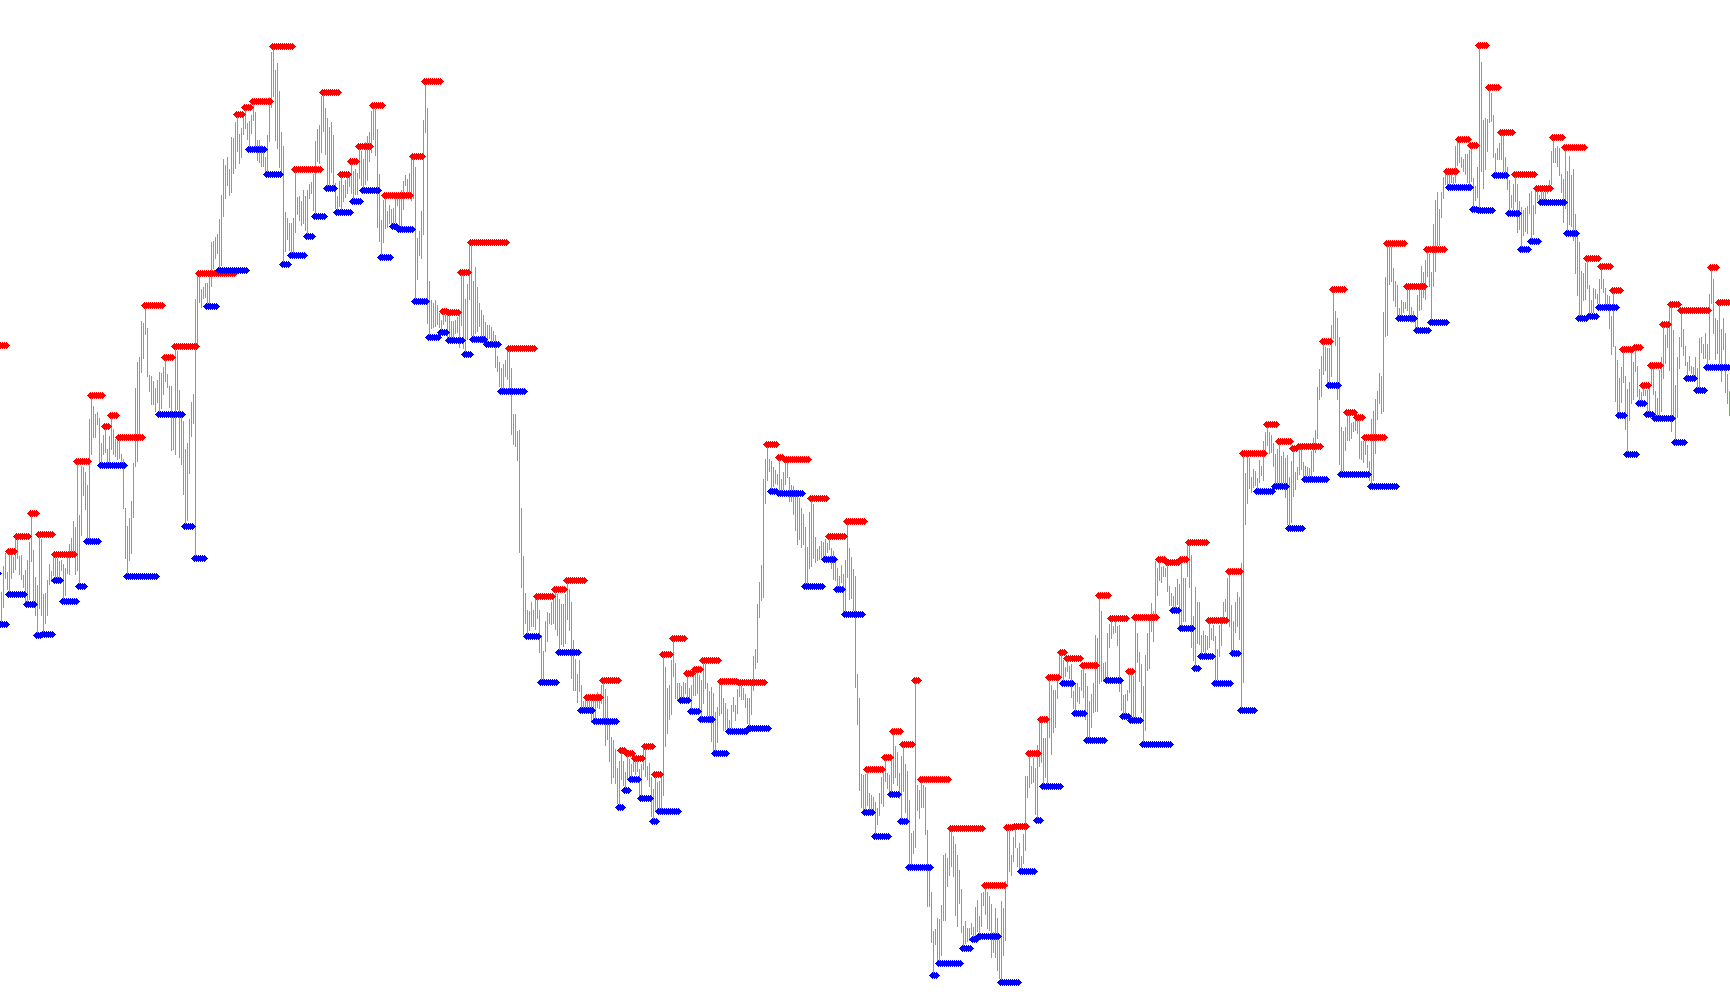
This script is designed to help traders visualize key price levels on a chart by identifying areas of "Support" and "Resistance." These are the invisible boundaries where the price historically struggles to move beyond, often signaling potential turning points in the market.
How it Works
The logic of this tool is based on identifying significant structural peaks and valleys in the market history. Instead of relying on arbitrary numbers, it automatically scans past price action to find specific price "fractals"—points where the price reached a local high or low relative to the bars surrounding it.
Key Features and Behavior
-
Resistance Identification (Red Dots): The script looks for upper "peaks" in the market history. When it detects a significant high point, it marks it as a Resistance level. These dots represent ceilings where the price has faced selling pressure in the past. If no new peak is found immediately, the script maintains the previous level's value to show you a continuous line of resistance.
-
Support Identification (Blue Dots): Simultaneously, the script scans for lower "valleys" in the market history to identify Support levels. These represent floors where buying interest has historically stepped in to prevent the price from falling further. Like the resistance logic, if a new valley isn't formed, it holds the previous level to provide a steady reference point for the trader.
-
Historical Continuity: The script doesn't just mark isolated points; it works backward through your entire chart history. This ensures that as you scroll back in time, you can see how these support and resistance levels have evolved, shifted, or remained constant over different market cycles.
Summary for the Trader
By using this script, you can quickly see where the "battle lines" are drawn on your chart. The Red dots highlight areas to watch for potential reversals downward (resistance), while the Blue dots highlight areas where the price might find a footing and bounce upward (support). It simplifies the process of technical analysis by automatically highlighting these critical structural zones based on actual historical price behavior.
//+------------------------------------------------------------------+
//|                Support and Resistance                            |
//|                Copyright © 2004  Barry Stander                   |
//|                http://myweb.absa.co.za/stander/4meta/            |
//+------------------------------------------------------------------+
#property copyright "Click here: Barry Stander"
#property link      "http://myweb.absa.co.za/stander/4meta/"

#property indicator_chart_window
#property indicator_buffers 2
#property indicator_color1 Blue
#property indicator_color2 Red

//---- buffers
double v1[];
double v2[];
double val1;
double val2;
int i;

int init()
  {

  IndicatorBuffers(2);

//---- drawing settings
 SetIndexArrow(0, 119);
 SetIndexArrow(1, 119);

   SetIndexStyle(0,DRAW_ARROW,STYLE_DOT,1,Red);
   SetIndexDrawBegin(0,i-1);
   SetIndexBuffer(0, v1);
   SetIndexLabel(0,"Resistance");


   SetIndexStyle(1,DRAW_ARROW,STYLE_DOT,1,Blue);
   SetIndexDrawBegin(1,i-1);
   SetIndexBuffer(1, v2);
   SetIndexLabel(1,"Support");

   return(0);
  }

int start()
  {

   i=Bars;
   while(i>=0)
     {

val1 = iFractals(NULL, 0, MODE_UPPER,i);
 if (val1 > 0)
   v1[i]=High[i];
    else
      v1[i] = v1[i+1];

val2 = iFractals(NULL, 0, MODE_LOWER,i);
 if (val2 > 0)
   v2[i]=Low[i];
      else
      v2[i] = v2[i+1];

      i--;
     }
   return(0);
  }

//+------------------------------------------------------------------+
Comments