Support and Resistance_v1
Download script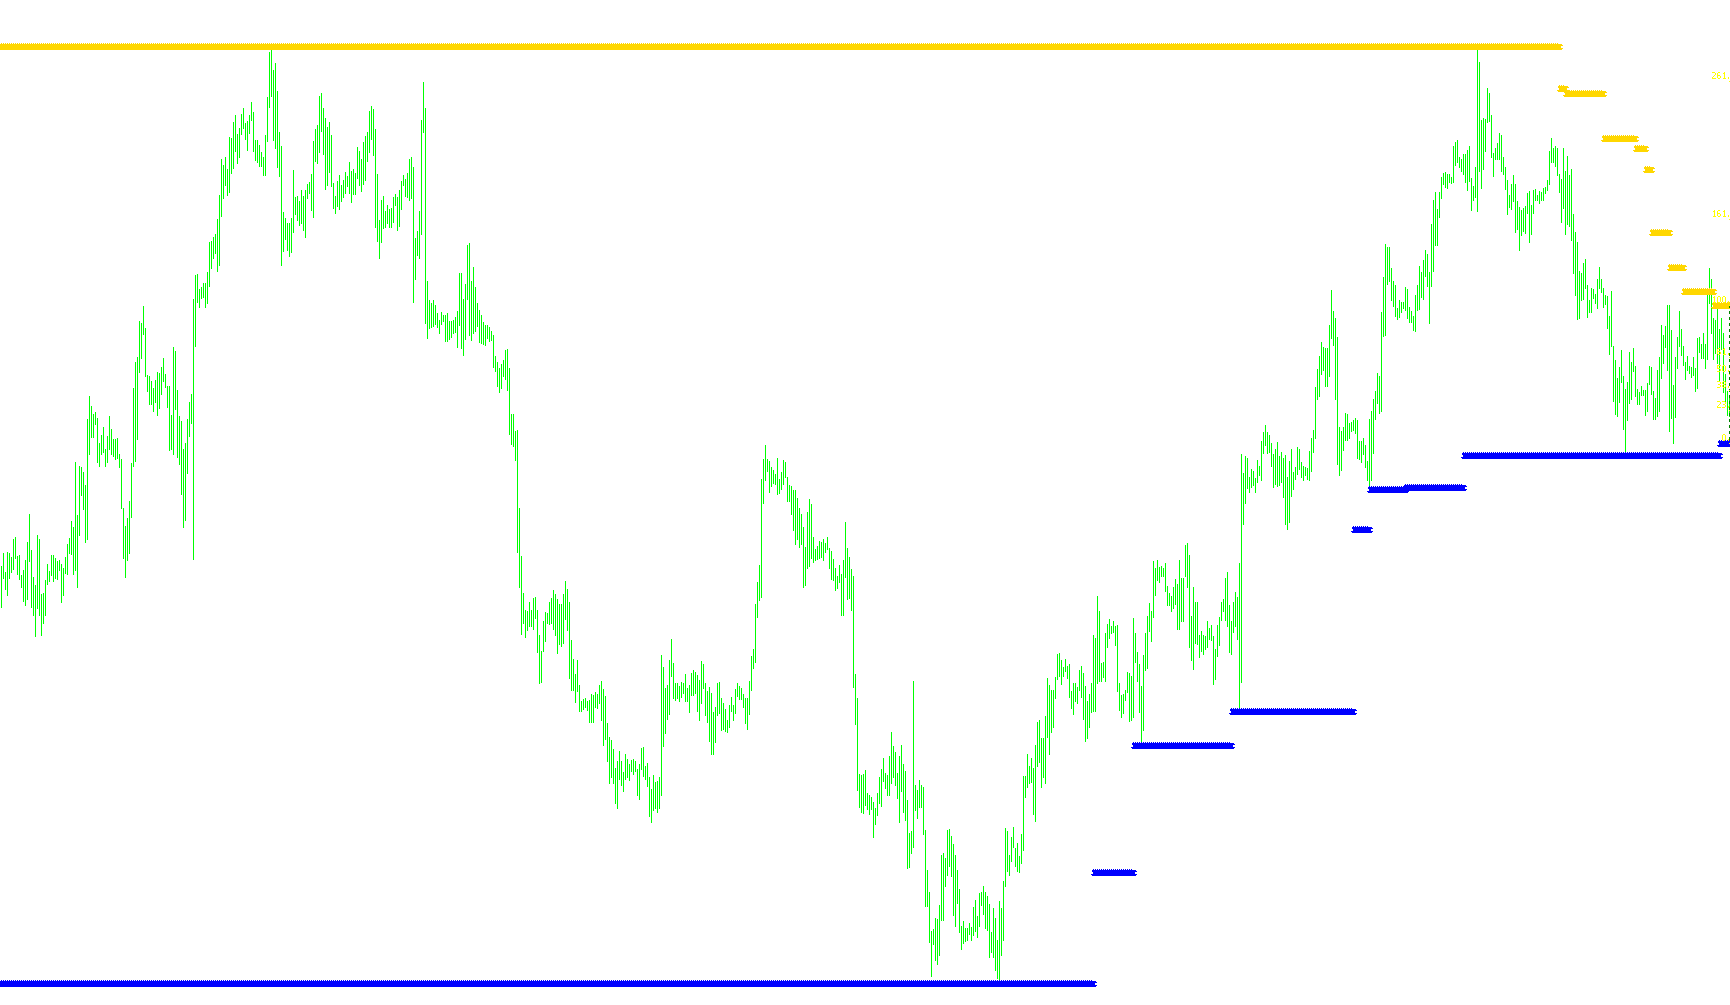
This script is designed to automatically identify and visualize key "Support" and "Resistance" levels on a trading chart. In technical analysis, these are the price points where an asset tends to stop moving—resistance acts as a ceiling that price struggles to break through, while support acts as a floor that prevents the price from falling further.
Core Logic and Behavior
The script operates by constantly scanning historical price data to find specific patterns of movement. It uses two primary methods to determine these levels:
1. Trend Reversal Detection The tool monitors the relationship between the current market price and a Simple Moving Average (SMA). It looks for specific "crossovers" where the price moves from one side of the average to the other:
- Resistance Identification: When the price drops from above the moving average to below it, the script identifies a potential ceiling. It then looks back at the preceding 20 bars of data to find the highest price point reached during that period and marks it as a resistance level.
- Support Identification: Conversely, when the price rises from below the moving average to above it, the script identifies a potential floor. It scans the preceding 20 bars to find the lowest price point reached and marks it as a support level.
2. Dynamic Visual Mapping Instead of just listing numbers, the script actively manages visual objects on your chart:
- Automatic Plotting: As the script detects these levels, it places them on the chart, allowing traders to see exactly where historical turning points occurred.
- Smart Object Movement: The logic includes a sophisticated "MoveObject" function. This ensures that if a specific trading zone is updated or refined by new price action, the visual markings (such as Fibonacci-style retracement lines) adjust their positions dynamically rather than cluttering the screen with overlapping graphics.
Summary for Traders
Essentially, this script automates the tedious task of manually looking back at charts to find where the "walls" are. It uses a combination of moving average crossovers and price extremes to highlight significant historical boundaries. When it detects a clear shift in momentum, it highlights the high and low points of that move, providing a visual guide for where the market might encounter friction in the future.
//+------------------------------------------------------------------+
//|                                      Support and Resistance .mq4 |
//|                                                                  |
//|                                                                  |
//|                                    Conversion: Dr_Richard_Gaines |
//|                                      dr_richard_gaines@yahoo.com |
//+------------------------------------------------------------------+

#property copyright " Copyright © 2004, MetaQuotes Software Corp."
#property link      " http://www.metaquotes.net/"
#include <stdlib.mqh>
#property indicator_chart_window
#property indicator_color1 Blue
#property indicator_buffers 2
#property indicator_color2 Red

//+------------------------------------------------------------------+
//| Common External variables                                        |
//+------------------------------------------------------------------+

//+------------------------------------------------------------------+
//| External variables                                               |
//+------------------------------------------------------------------+

//+------------------------------------------------------------------+
//| Special Convertion Functions                                     |
//+------------------------------------------------------------------+

int LastTradeTime;
double ExtHistoBuffer[];
double ExtHistoBuffer2[];

void SetLoopCount(int loops)
{
}

void SetIndexValue(int shift, double value)
{
  ExtHistoBuffer[shift] = value;
}

void SetIndexValue2(int shift, double value)
{
  ExtHistoBuffer2[shift] = value;
}

bool MoveObject(string name, int type, datetime Atime, double Aprice, datetime Atime2 = 0, double Aprice2 = 0, color Acolor = CLR_NONE, int Aweight = 0, int Astyle = 0)
{
    if (ObjectFind(name) != -1)
    {
      int OType = ObjectType(name);

      if ((OType == OBJ_VLINE) ||
         (OType == OBJ_HLINE) ||
         (OType == OBJ_TRENDBYANGLE) ||
         (OType == OBJ_TEXT) ||
         (OType == OBJ_ARROW) ||
         (OType == OBJ_LABEL))
      {
        return(ObjectMove(name, 0, Atime, Aprice));
      }

      if ((OType == OBJ_GANNLINE) ||
         (OType == OBJ_GANNFAN) ||
         (OType == OBJ_GANNGRID) ||
         (OType == OBJ_FIBO) ||
         (OType == OBJ_FIBOTIMES) ||
         (OType == OBJ_FIBOFAN) ||
         (OType == OBJ_FIBOARC) ||
         (OType == OBJ_RECTANGLE) ||
         (OType == OBJ_ELLIPSE) ||
         (OType == OBJ_CYCLES) ||
         (OType == OBJ_TREND) ||
         (OType == OBJ_STDDEVCHANNEL) ||
         (OType == OBJ_REGRESSION))
      {
        return(ObjectMove(name, 0, Atime, Aprice) && ObjectMove(name, 1, Atime2, Aprice2));
      }

/*
          OBJ_CHANNEL,
          OBJ_EXPANSION,
          OBJ_FIBOCHANNEL,
          OBJ_TRIANGLE,
          OBJ_PITCHFORK
*/
    }
    else
    {
      return(ObjectCreate(name, type, 0, Atime, Aprice, Atime2, Aprice2, 0, 0) && ObjectSet(name, OBJPROP_COLOR, Acolor));
    }
}

//+------------------------------------------------------------------+
//| End                                                              |
//+------------------------------------------------------------------+

//+------------------------------------------------------------------+
//| Initialization                                                   |
//+------------------------------------------------------------------+

int init()
{
   SetIndexStyle(0, DRAW_ARROW, STYLE_SOLID);
   SetIndexBuffer(0, ExtHistoBuffer);
   SetIndexStyle(1, DRAW_ARROW, STYLE_SOLID);
   SetIndexBuffer(1, ExtHistoBuffer2);
   return(0);
}
int start()
{
//+------------------------------------------------------------------+
//| Local variables                                                  |
//+------------------------------------------------------------------+
int shift = 0;
double res = 0;
double sup = 0;

/*[[
	Name := sup_res
	Author := Copyright © 2004, MetaQuotes Software Corp.
	Link := http://www.metaquotes.net/
	Separate Window := No
	First Color := Blue
	First Draw Type := Symbol
	First Symbol := 119
	Use Second Data := Yes
	Second Color := Red
	Second Draw Type := Symbol
	Second Symbol := 119
]]*/


SetLoopCount(0);
// loop from first bar to current bar (with shift=0)
for(shift=Bars-1;shift>=0 ;shift--){
if( Close[shift+2]>= iMA(NULL, 0, 10, 0, MODE_SMA, PRICE_CLOSE, shift+2)&&
 Close[shift+1]< iMA(NULL, 0, 10, 0, MODE_SMA, PRICE_CLOSE, shift+1))
res=High[Highest(NULL, 0, MODE_HIGH,shift+20,20)];
if( Close[shift+2]<= iMA(NULL, 0, 10, 0, MODE_SMA, PRICE_CLOSE, shift+2)&&
Close[shift+1]> iMA(NULL, 0, 10, 0, MODE_SMA, PRICE_CLOSE, shift+1))
sup=Low[Lowest(NULL, 0, MODE_LOW,shift+20,20)];
	SetIndexValue(shift, res);
	SetIndexValue2(shift, sup);
	if( Close[shift+1]<sup )
	MoveObject("trade",OBJ_FIBO,Time[shift+1],sup,Time[shift+1],res,Green,1,STYLE_DASH); else
if( Close[shift+1]>res )
	MoveObject("trade",OBJ_FIBO,Time[shift+1],res,Time[shift+1],sup,Green,1,STYLE_DASH); else
if( Close[shift+1]<res && Close[shift+1]>sup   )
	MoveObject("trade",OBJ_FIBO,Time[shift+1],res,Time[shift+1],sup,Green,1,STYLE_DASH);
}


  return(0);
}
Comments