Swing_Point
Download script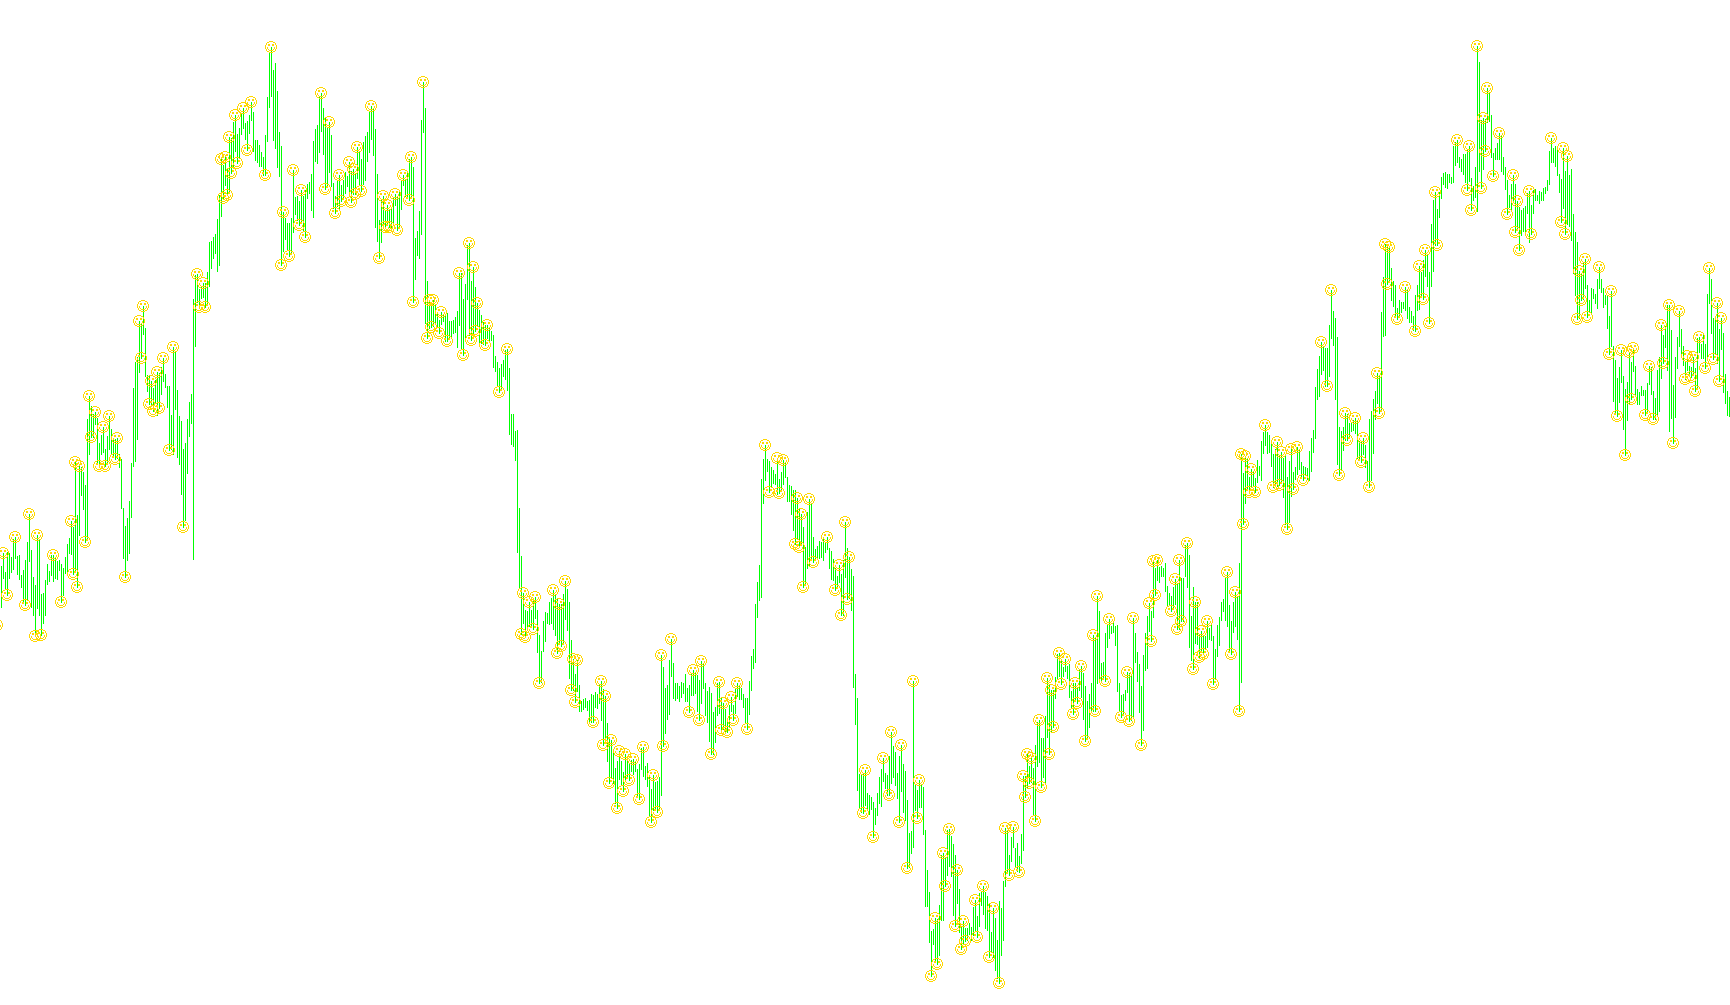
This indicator is designed to identify significant structural shifts in market price action by detecting "reversal points." Its primary purpose is to help traders visualize where a trend might be exhausted and flipping in the opposite direction based on specific price distance thresholds.
Core Operational Logic
The script functions by constantly monitoring the highest highs and lowest lows of the market as new price data arrives. It maintains an internal "memory" of these peaks and valleys to determine the current market direction (upward or downward).
Instead of reacting to every small price movement, the logic follows these specific steps:
1. Trend Tracking & Peak Detection The tool identifies whether the market is currently moving up or down by comparing the previous bar's high and low against established benchmarks. It continuously updates these benchmarks—saving the highest point reached during an uptrend and the lowest point reached during a downtrend.
2. The Reversal Condition (The "ReversPoint")
This is the most critical part of the logic. The script uses a user-defined parameter called the ReversPoint. Rather than declaring a trend change the moment a new high or low is touched, the script waits for a specific amount of price "retracement."
- In an Uptrend: If the price drops significantly below the previous high by a distance equal to the specified
ReversPoint, the script recognizes this as a potential exhaustion of buying momentum. - In a Downtrend: If the price rises significantly above the previous low by that same distance, it signals a potential exhaustion of selling pressure.
3. Visual Signaling Once these conditions are met—meaning the price has pulled back far enough to suggest the current trend is weakening—the script identifies the specific point where the move started. It then places a visual marker (an arrow) on the chart at that location. This allows you to see exactly where the "turning point" occurred relative to the recent price action.
Summary for the Trader
Essentially, this tool acts as a filter for market noise. It ignores minor fluctuations and only triggers a signal when the price moves backward against the current trend by a meaningful amount. By visualizing these reversal points, it helps you identify high-probability areas where the market sentiment may be shifting from bullish to bearish, or vice versa.
//+------------------------------------------------------------------+
//|                                                        RPoint.mq4 |
//|                               Copyright © 2004, Poul_Trade_Forum |
//|                                                         Aborigen |
//|                                          http://forex.kbpauk.ru/ |
//+------------------------------------------------------------------+
#property copyright "Poul Trade Forum"
#property link      "http://forex.kbpauk.ru/"
#property indicator_chart_window
#property indicator_buffers 1
#property indicator_color1 Green
#property indicator_width1 1

//---- input parameters
extern int ReversPoint=50;//34;//50;//
//---- buffers
double RBuffer[];
int Trend=1,InTrend,ttime;
double Points,Last_High, Last_Low;
//+------------------------------------------------------------------+
//| Custom indicator initialization function                         |
//+------------------------------------------------------------------+
int init()
  {
   string short_name;
   Points = MarketInfo (Symbol(), MODE_POINT);

//---- indicator line
   //SetIndexStyle(0,DRAW_SECTION,EMPTY,2,Blue);
   //SetIndexBuffer(0,RBuffer);
   //SetIndexEmptyValue(0,0);

   SetIndexStyle(0,DRAW_ARROW);
   SetIndexArrow(0,74);//218 234
   SetIndexBuffer(0,RBuffer);
   SetIndexEmptyValue(0,0.0);


//---- name for DataWindow and indicator subwindow label
   short_name="RPoint";
   IndicatorShortName(short_name);
   SetIndexLabel(0,short_name);

//----
   SetIndexDrawBegin(0,100);
   ArrayInitialize(RBuffer,0);
//----

   return(0);
  }
//+------------------------------------------------------------------+
//| Custor indicator deinitialization function                       |
//+------------------------------------------------------------------+
int deinit()
  {
//---- TODO: add your code here

//----
   return(0);
  }
//+------------------------------------------------------------------+
//| Custom indicator iteration function                              |
//+------------------------------------------------------------------+
int start()
  {
   int    counted_bars=IndicatorCounted(),i,shift;

//---- TODO: add your code here
i=(Bars-counted_bars)-1;

for (shift=i; shift>=0;shift--)
{

if (Time[shift]!=ttime) InTrend=InTrend+1;
ttime=Time[shift];
RBuffer[shift]=0;
if (High[shift+1]>Last_High && Trend==1)  InTrend=1;
if (Low[shift+1]<Last_Low   && Trend==0)   InTrend=1;
if (High[shift+1]>Last_High) Last_High=High[shift+1];
if (Low[shift+1]<Last_Low)   Last_Low=Low[shift+1];

if (Trend==1 && Low[shift+1]<Last_High-ReversPoint*Points && InTrend>1)
{
Trend=0;
RBuffer[shift+InTrend]=High[shift+InTrend];
Last_High=Low[shift+1];
Last_Low=Low[shift+1];
InTrend=1;
}

if (Trend==0 && High[shift+1]>Last_Low+ReversPoint*Points && InTrend>1)
{
Trend=1;
RBuffer[shift+InTrend]=Low[shift+InTrend];
Last_Low=High[shift+1];
Last_High=High[shift+1];
InTrend=1;
}
//----
}
   return(0);
  }
//+------------------------------------------------------------------+
Comments