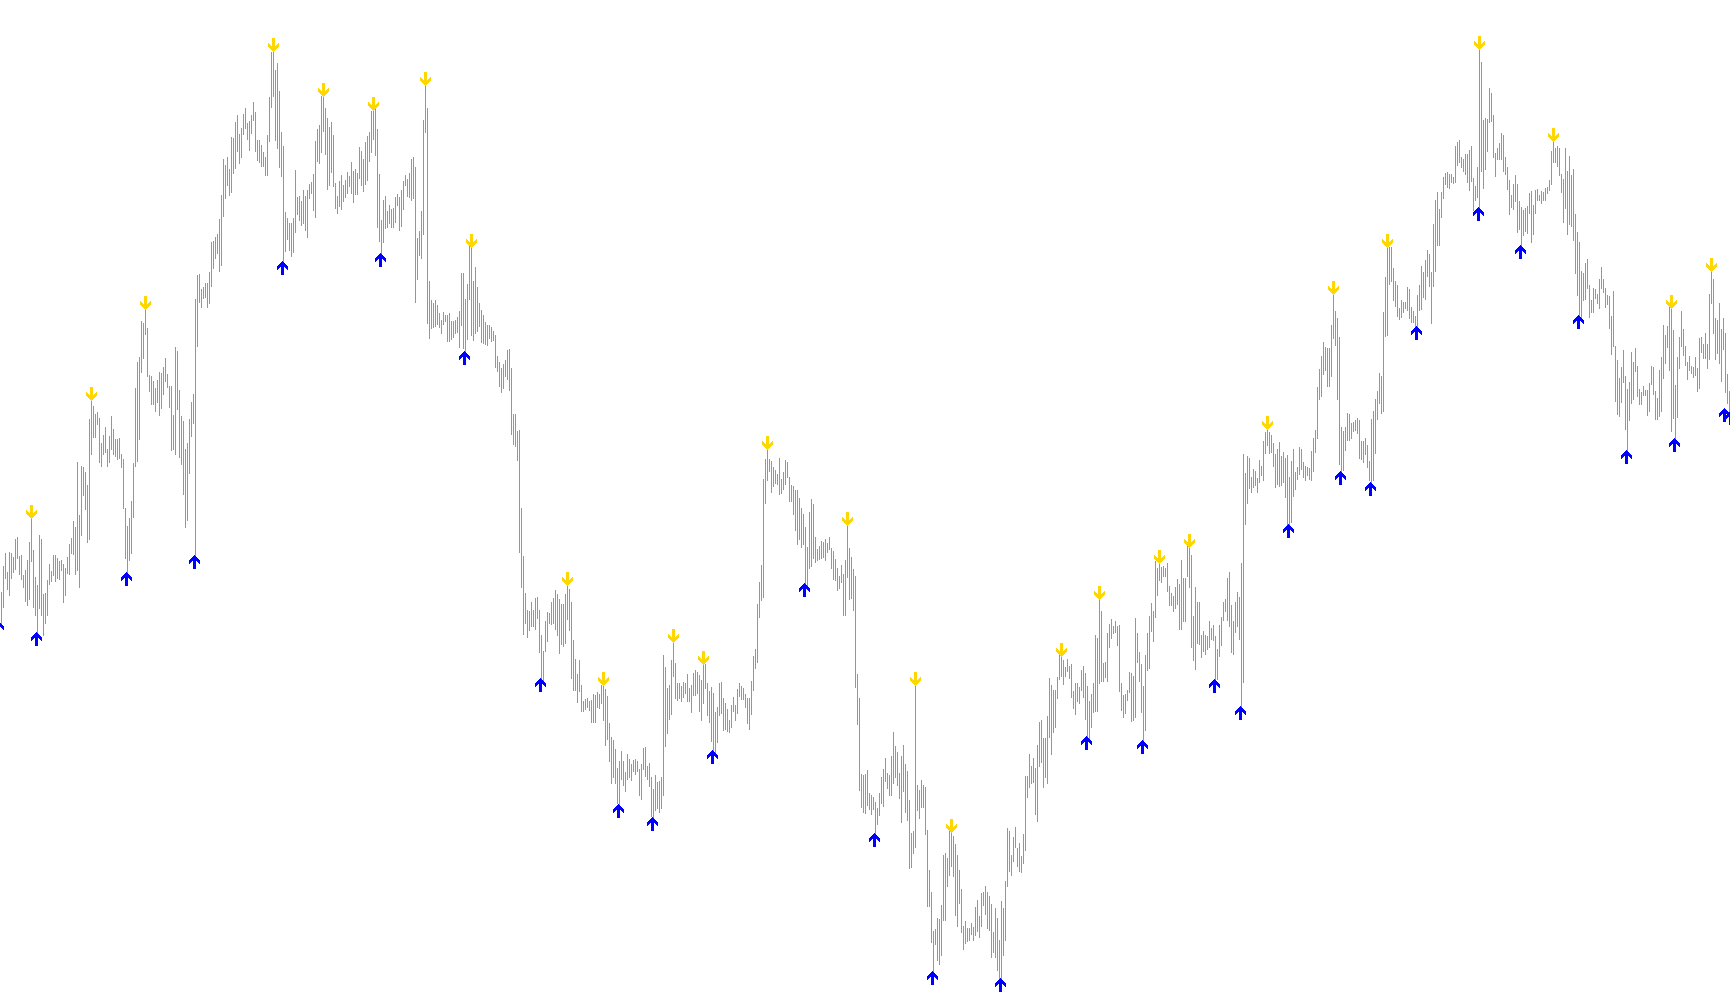
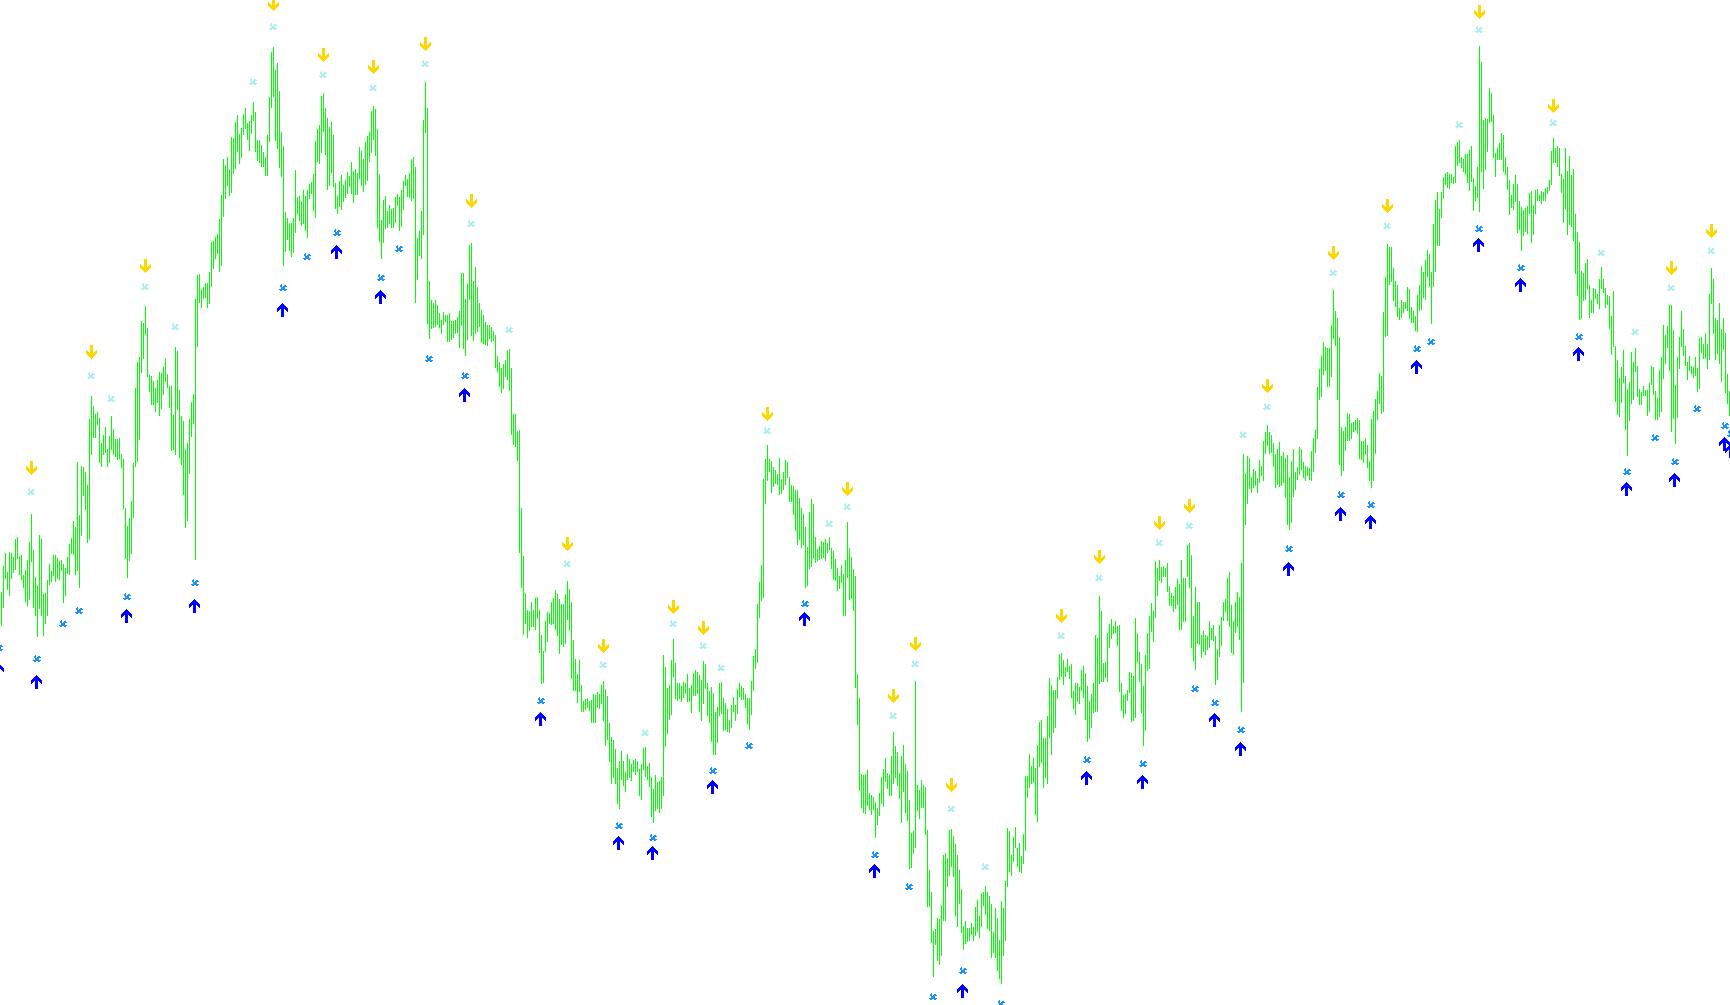
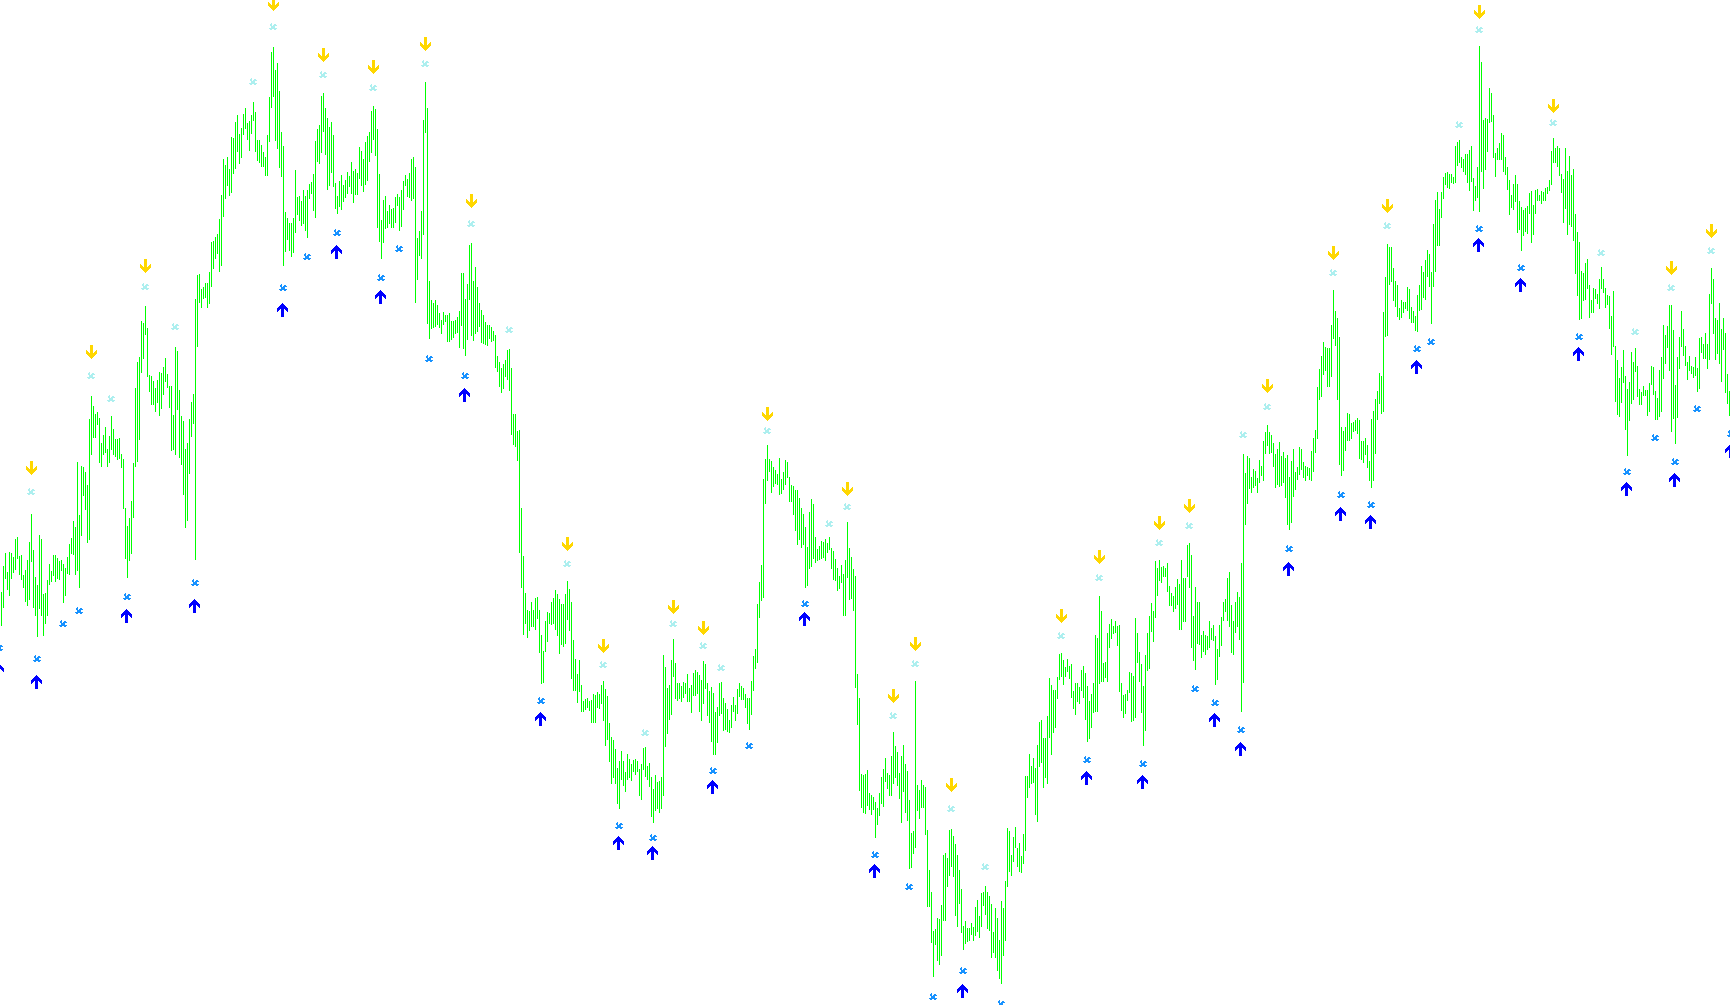
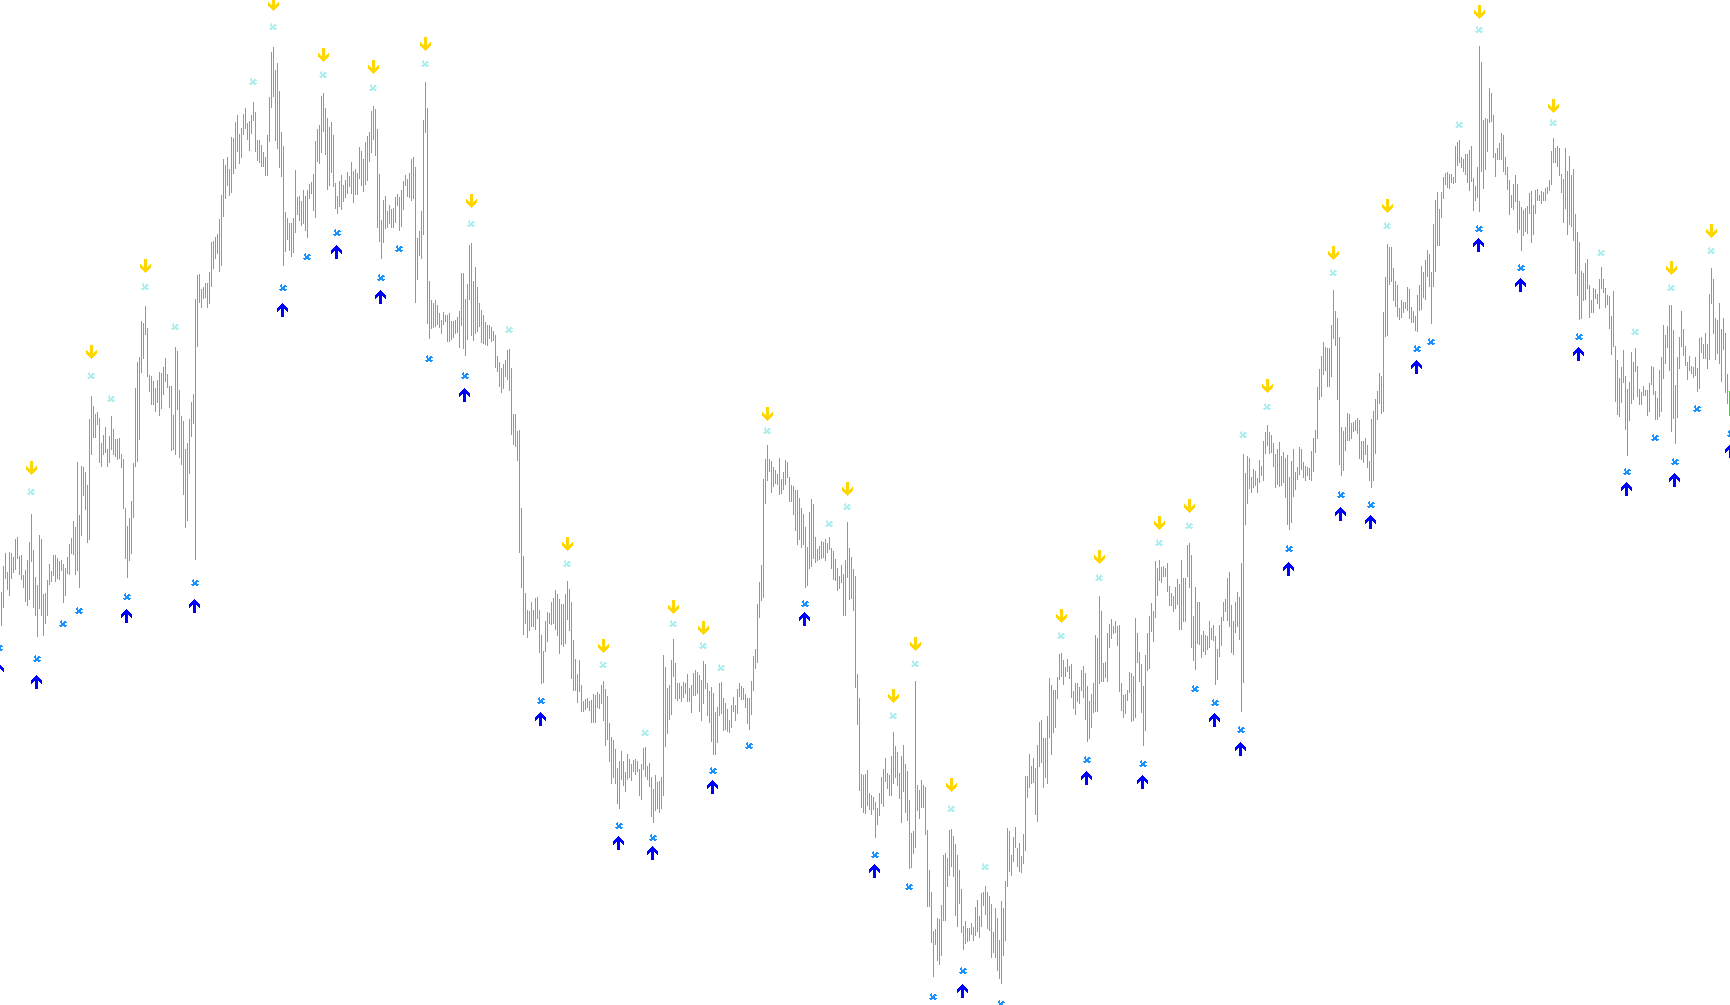
Stop_reversal_mod
Indicator

Stop_reversal_mod

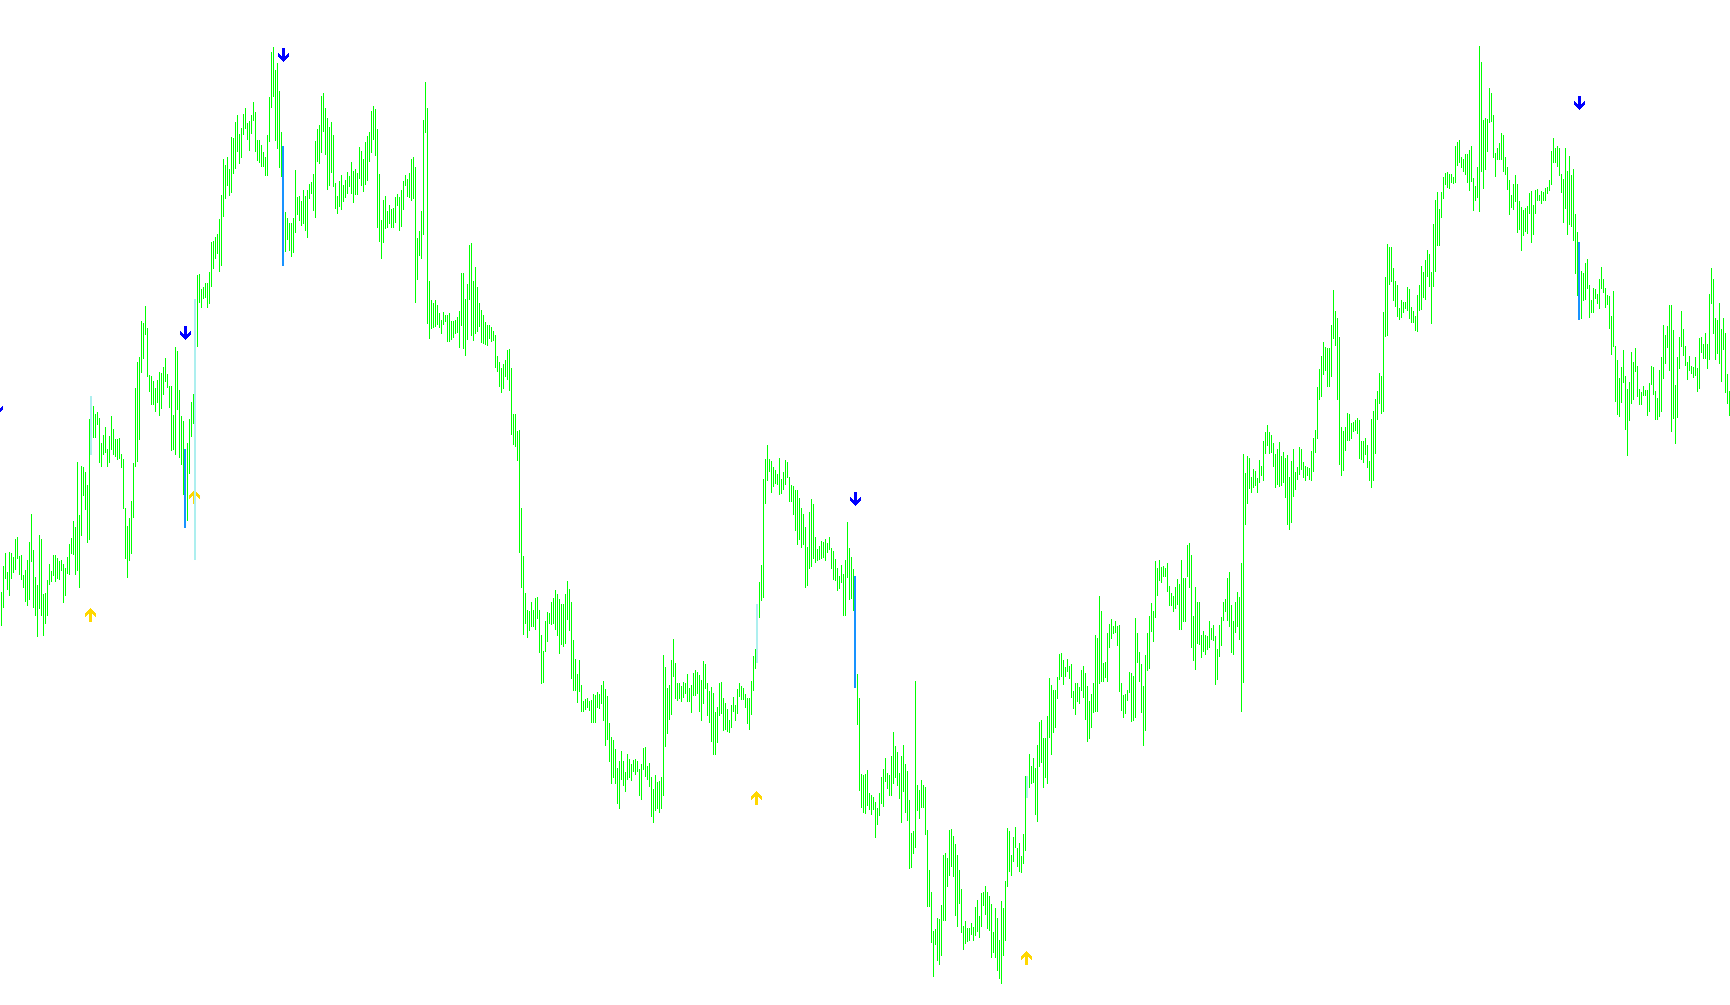
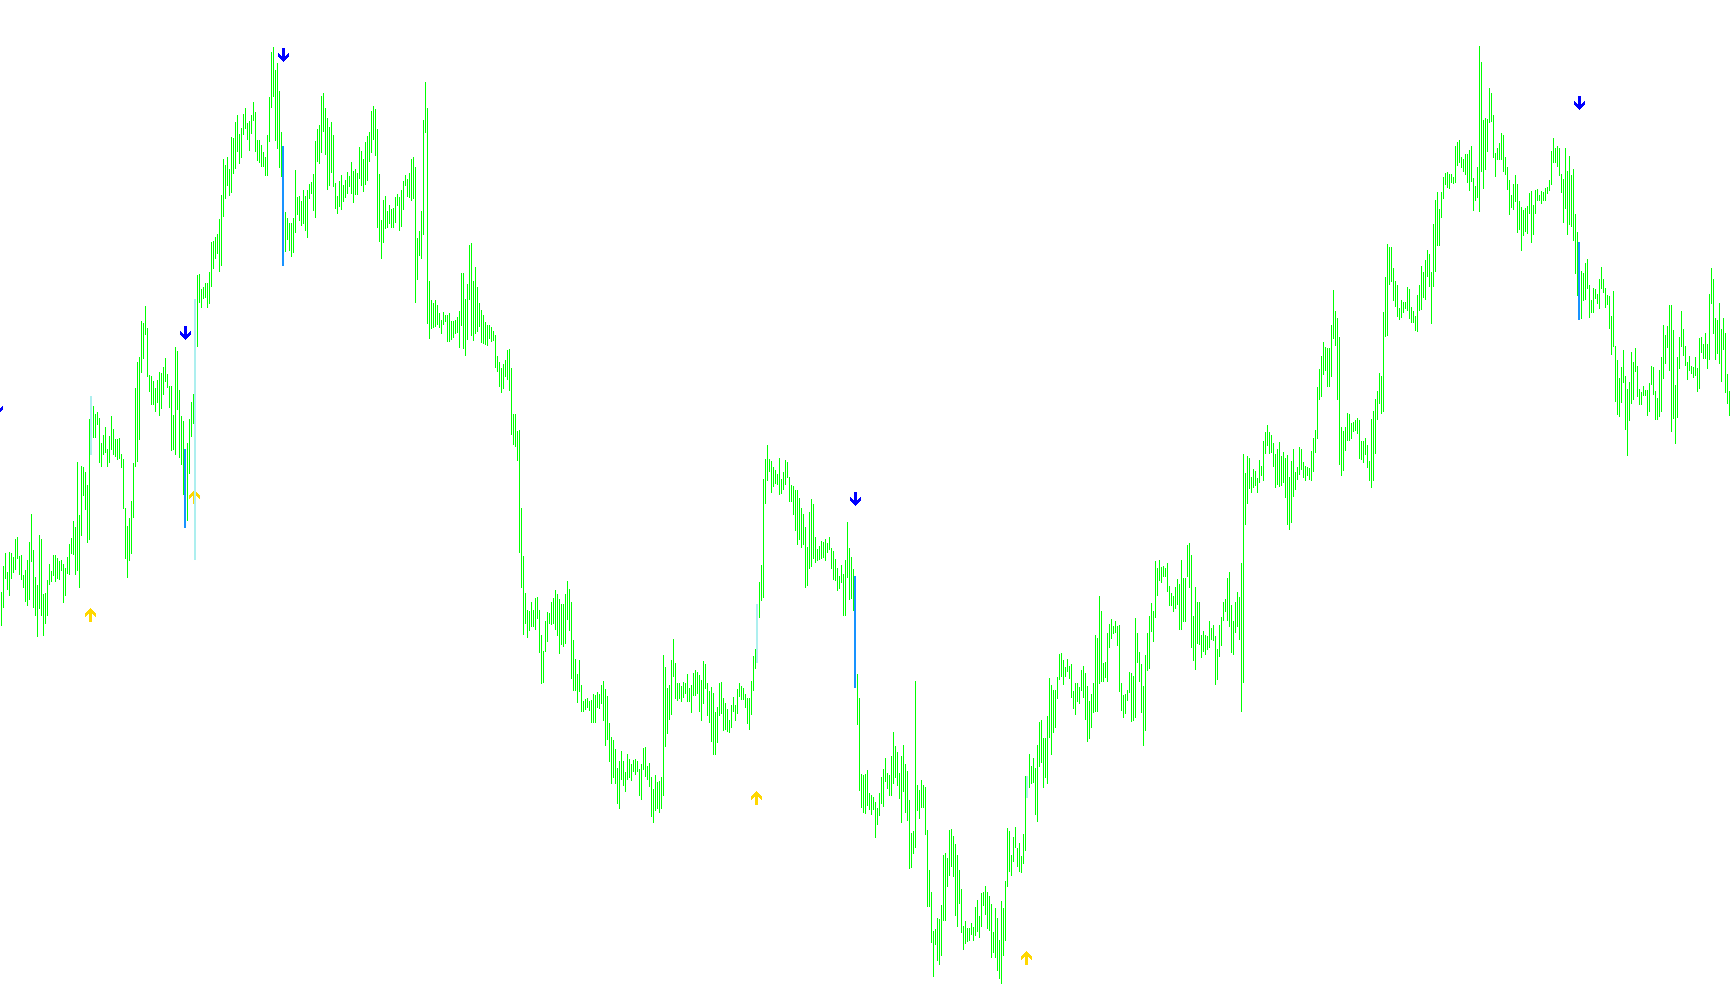
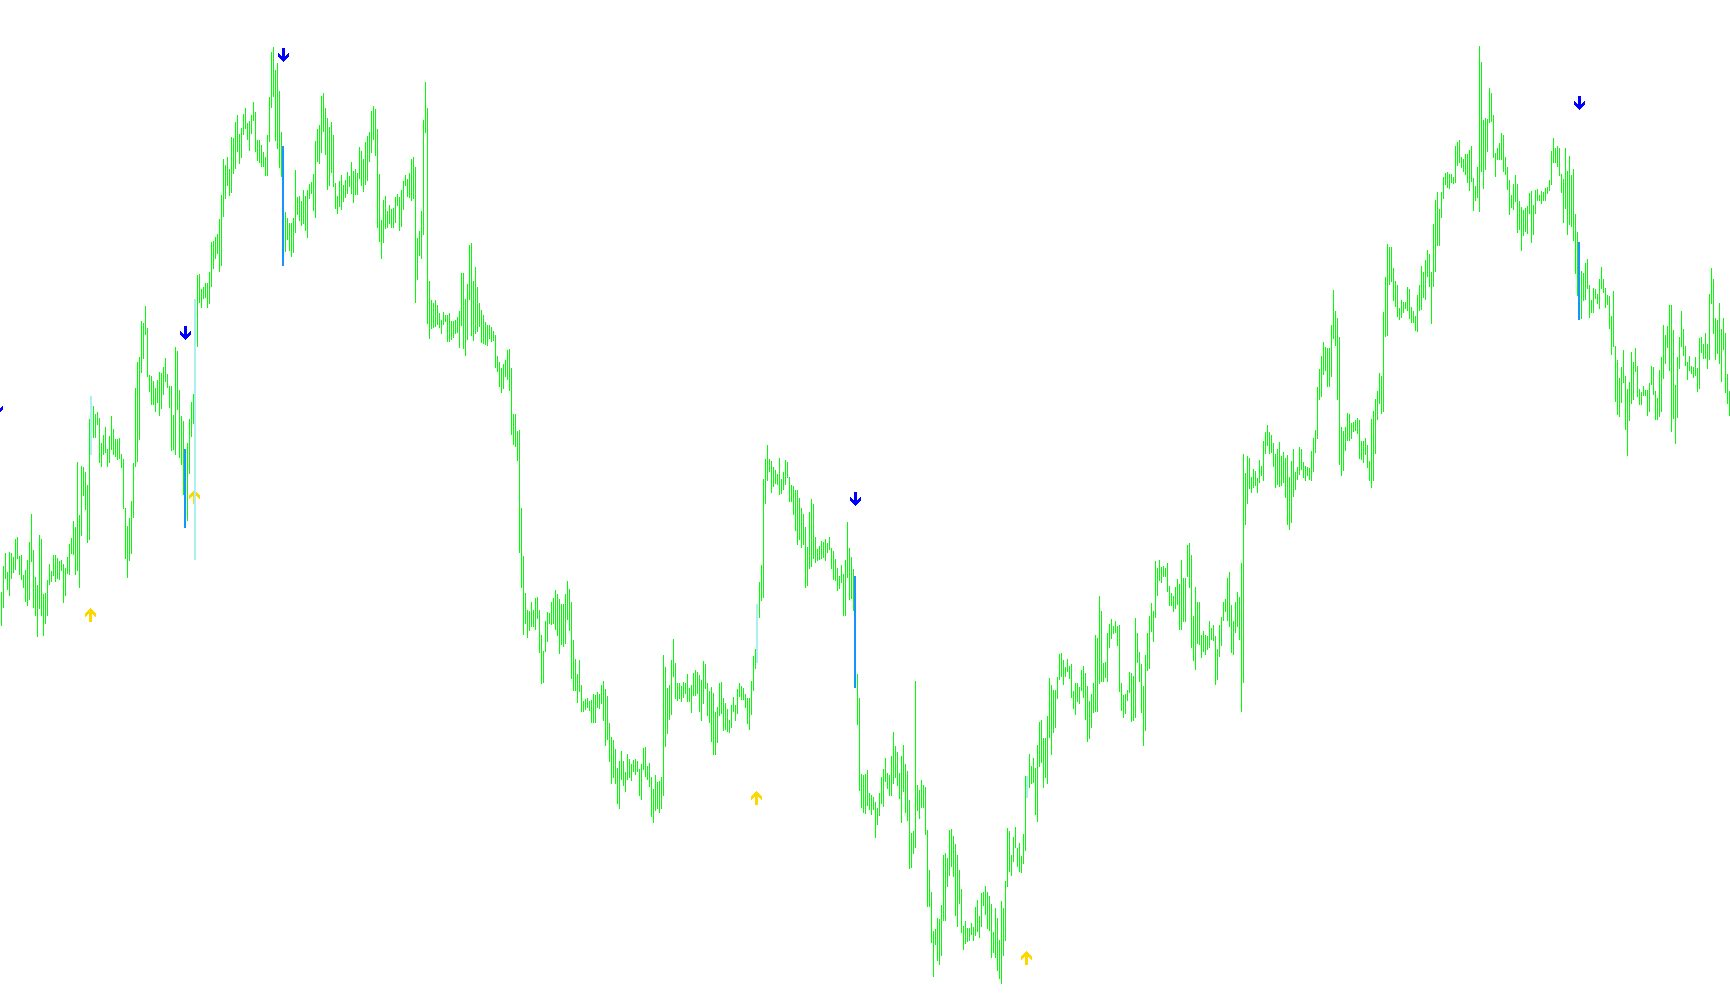
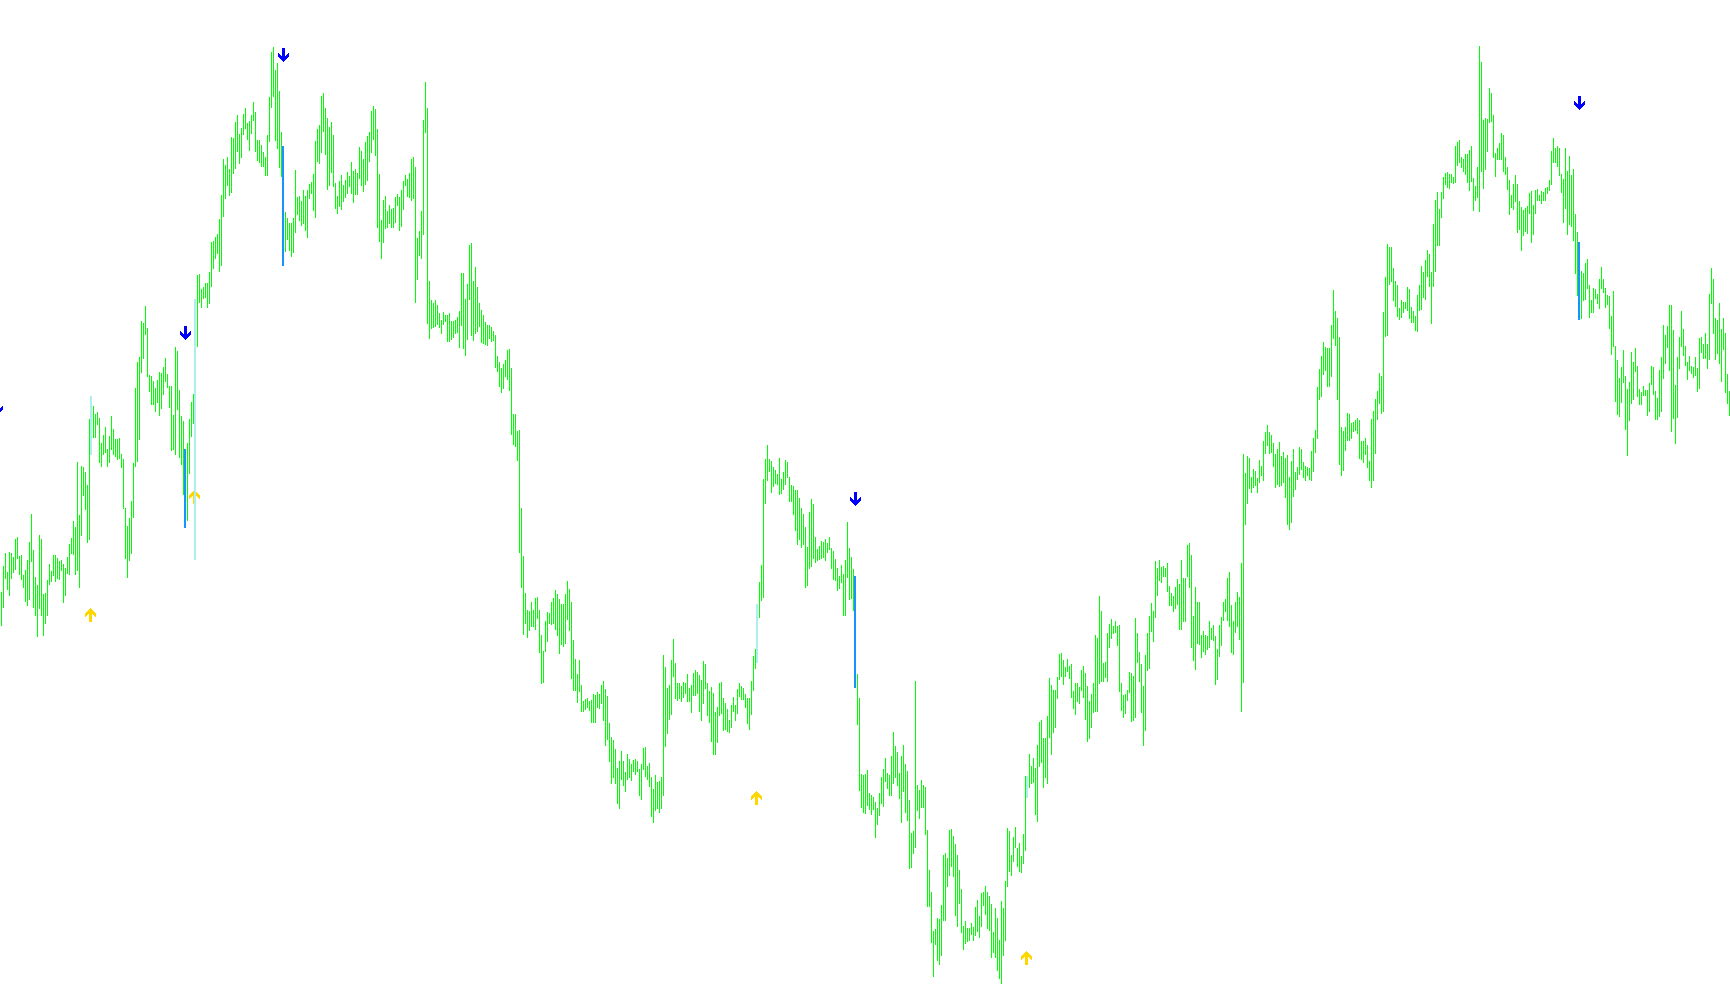
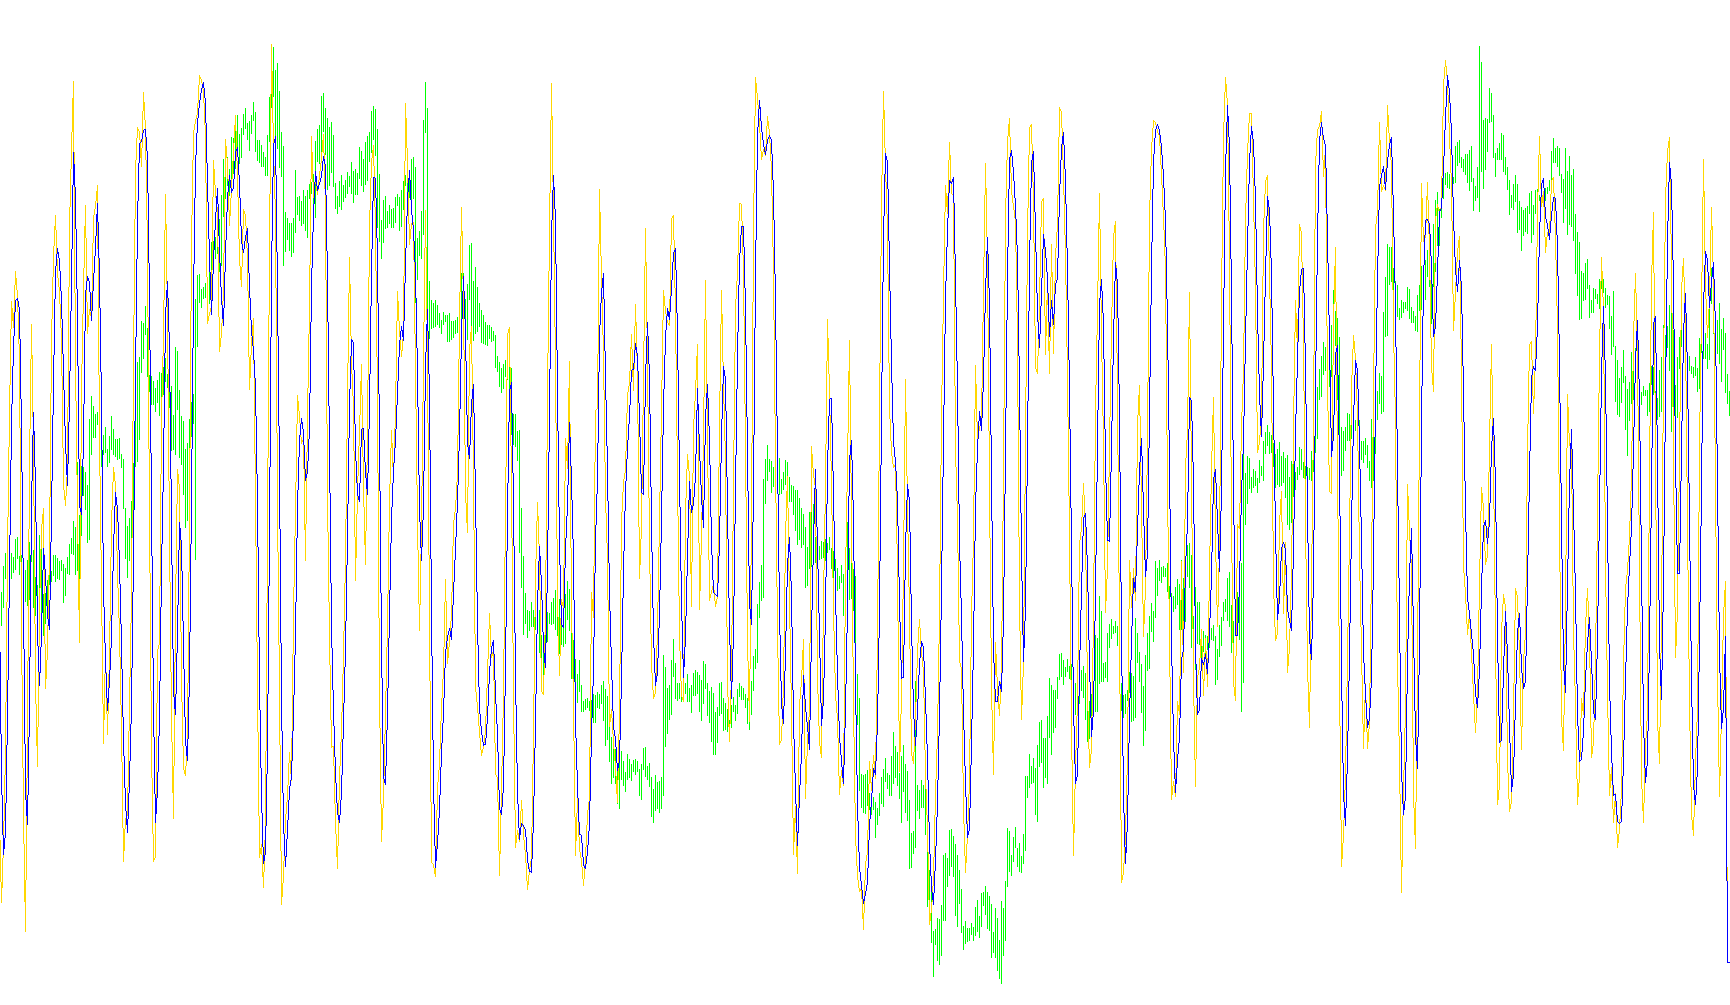
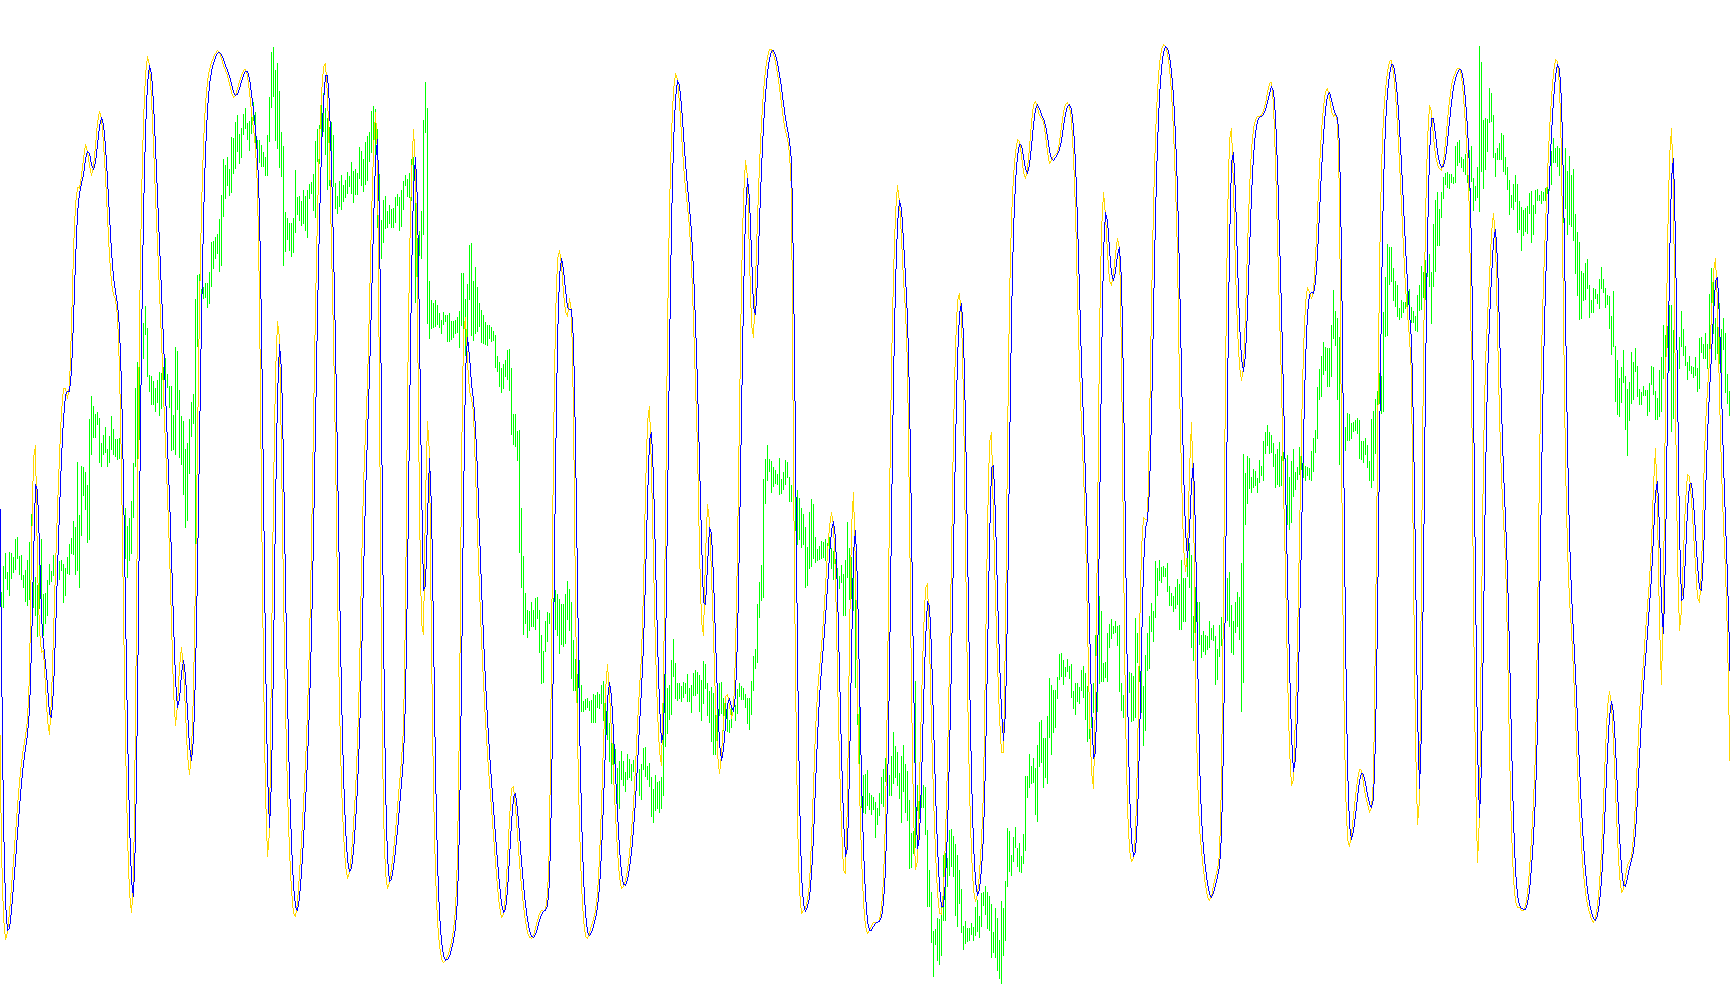
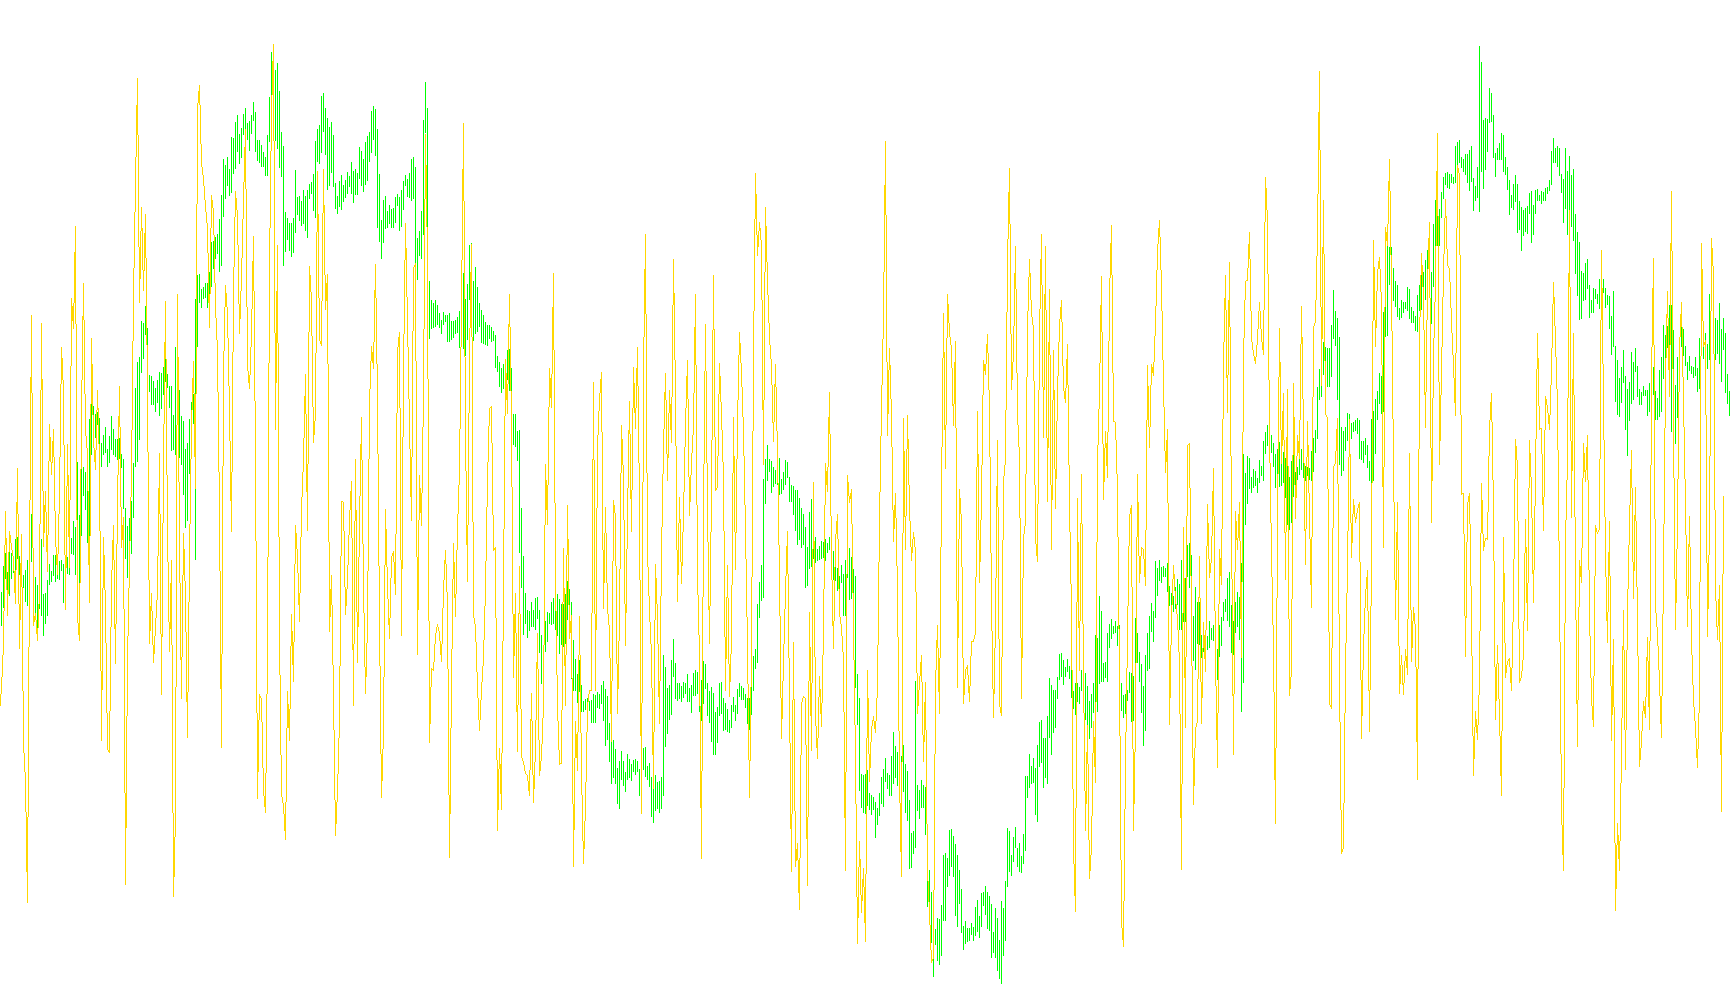
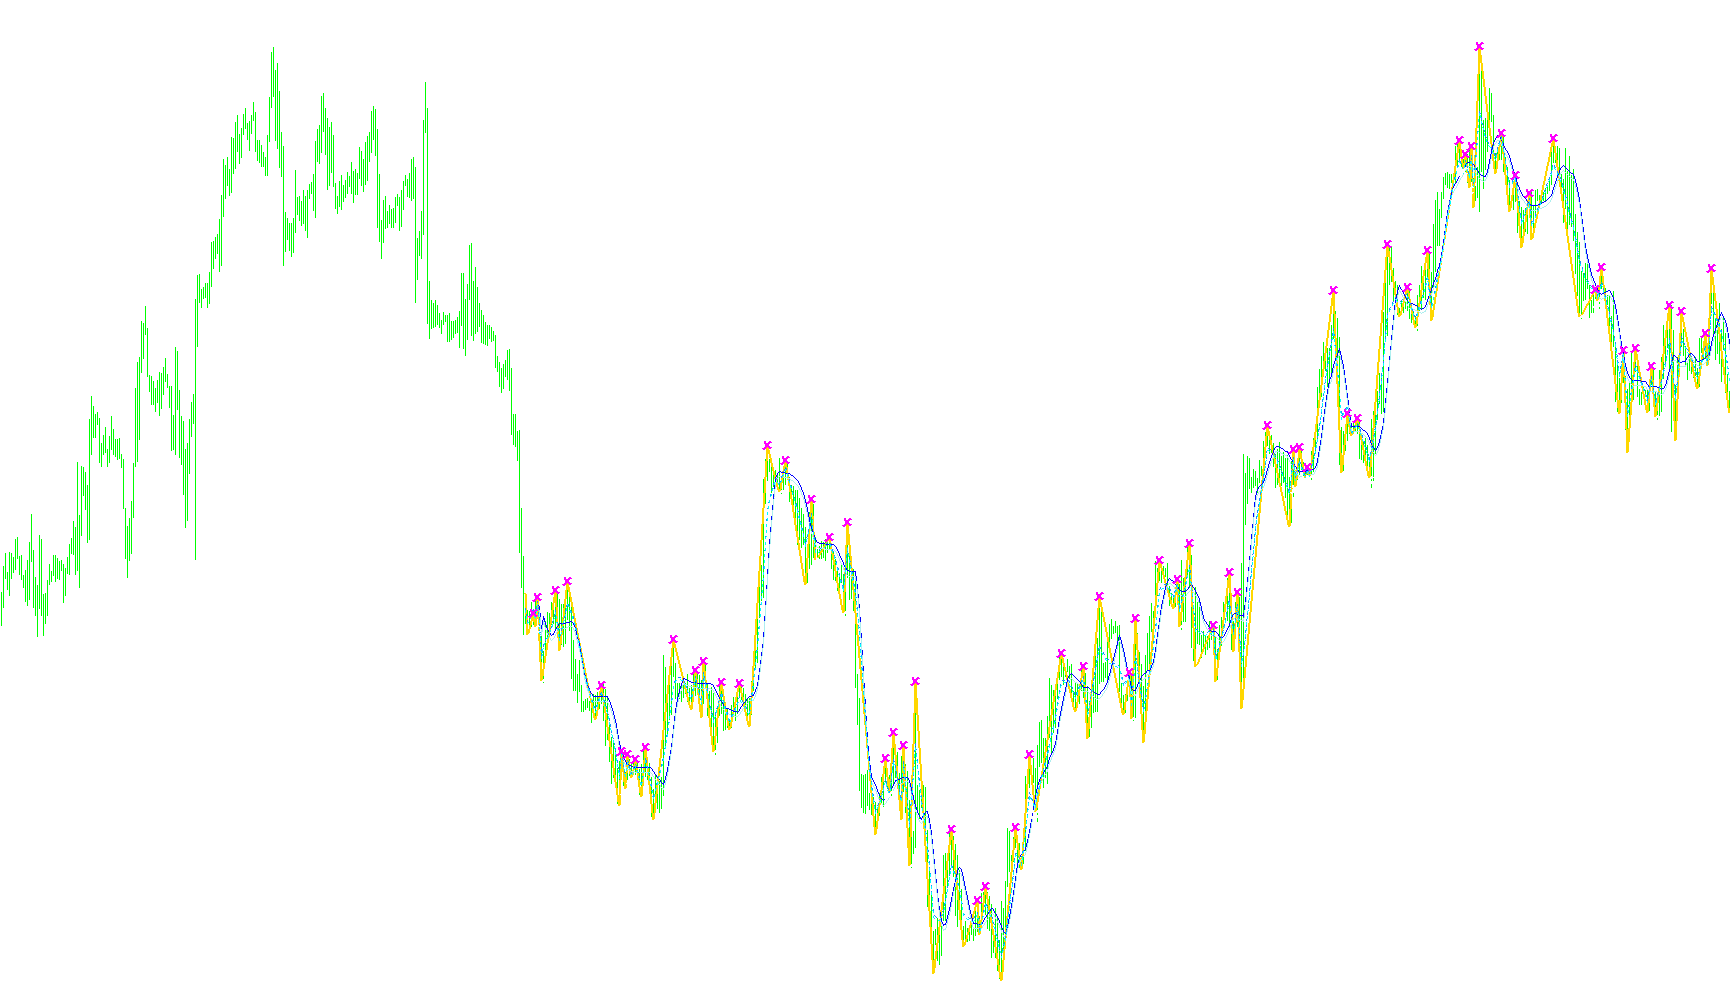
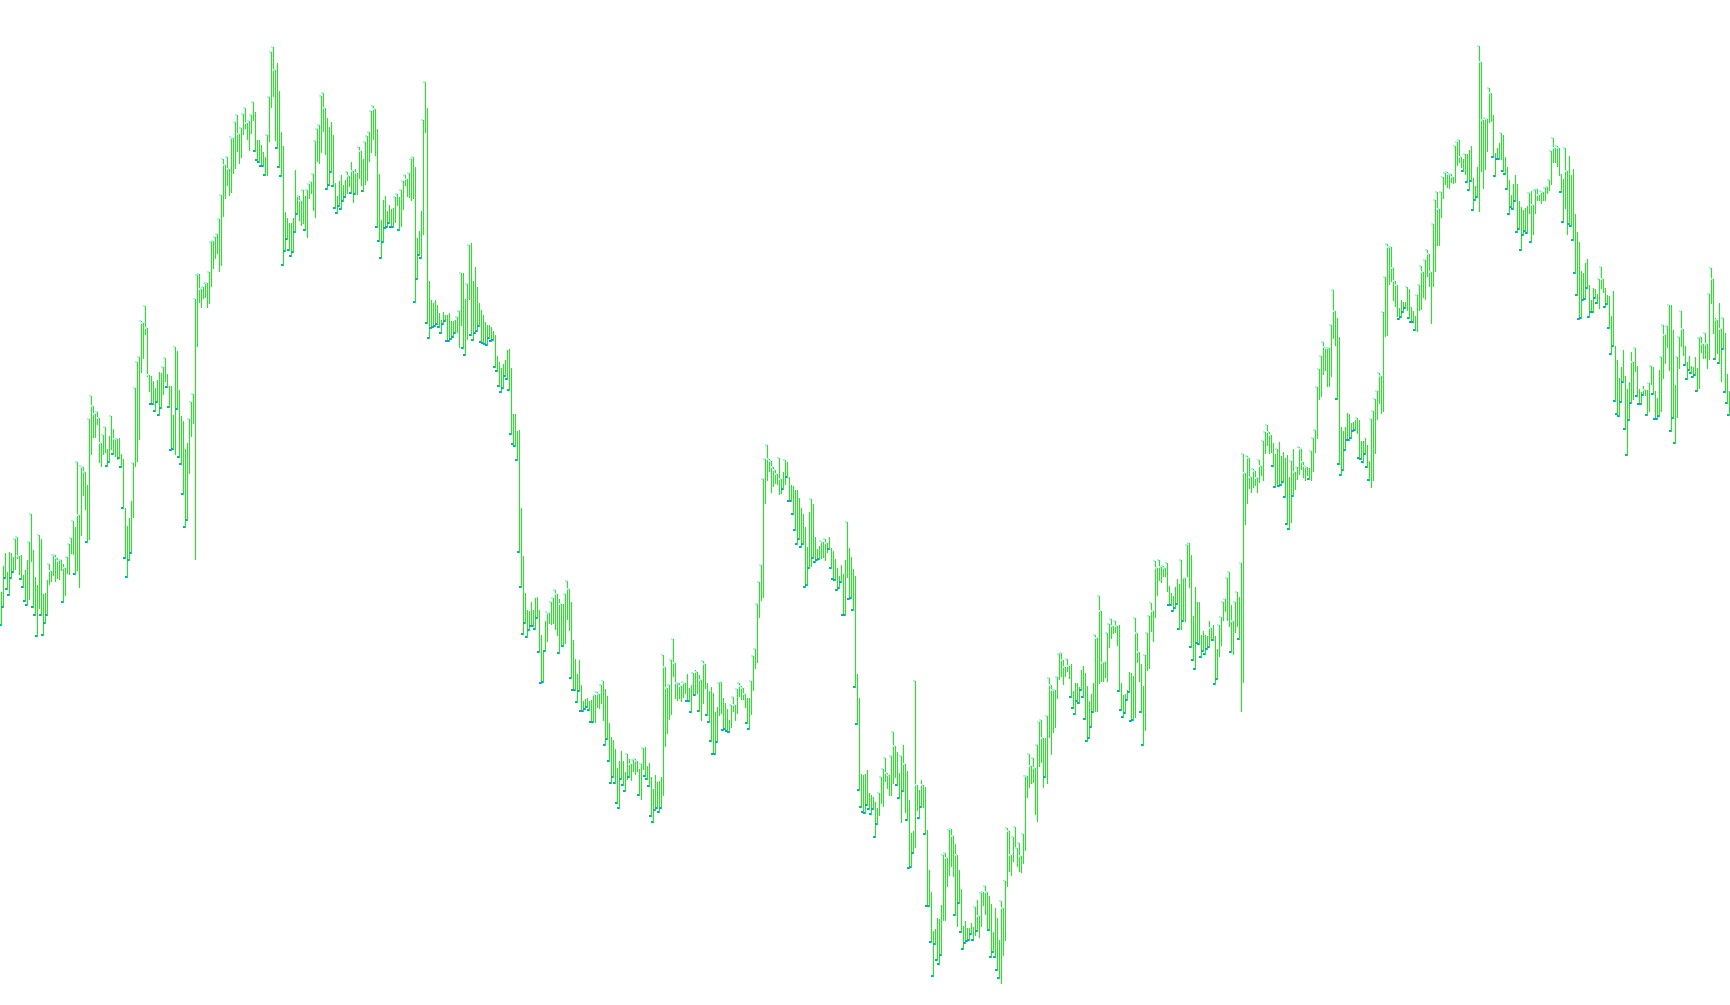
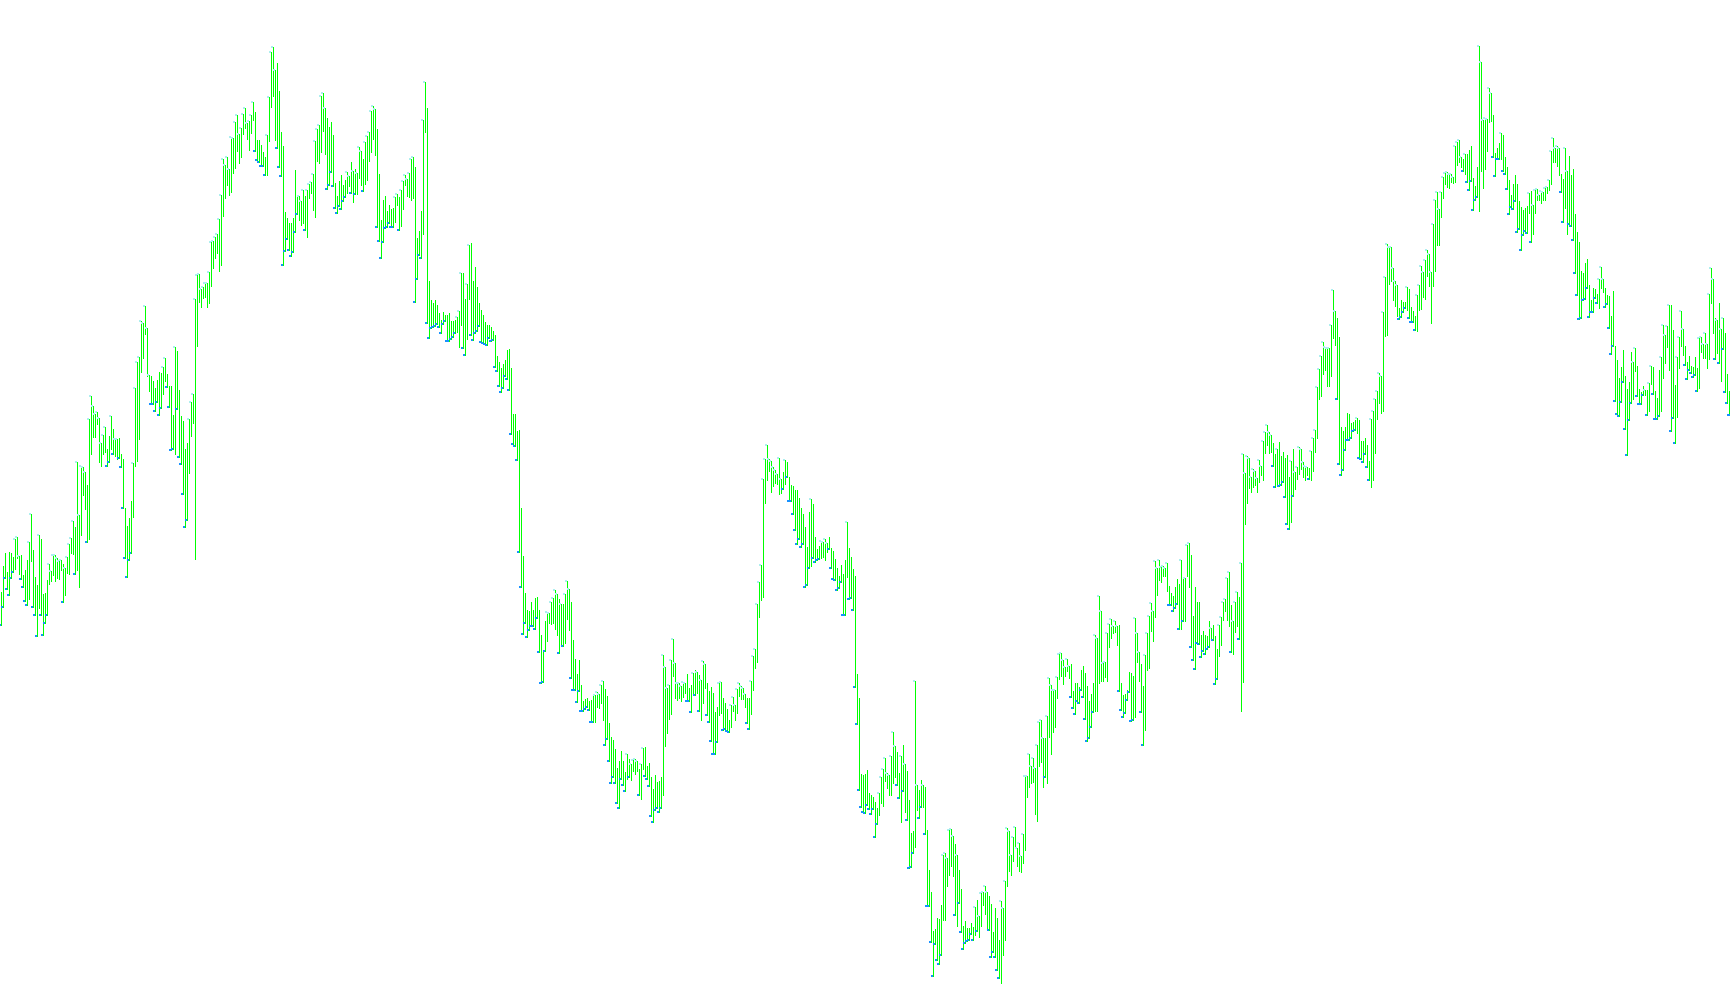
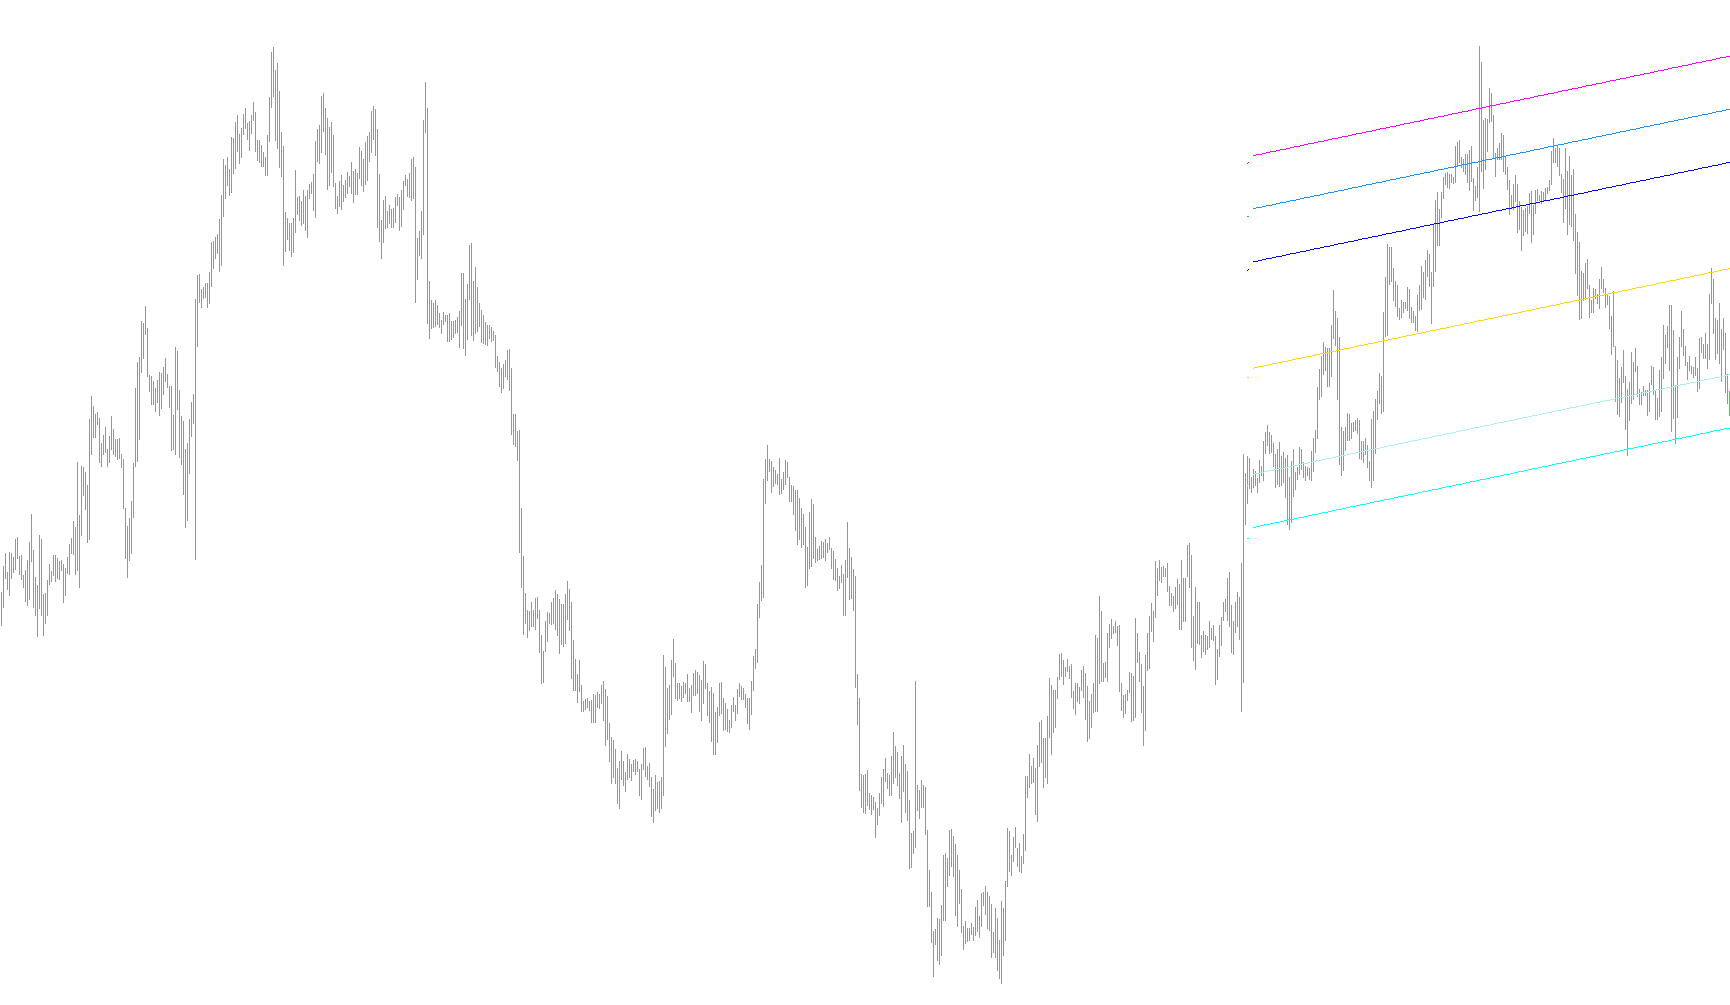
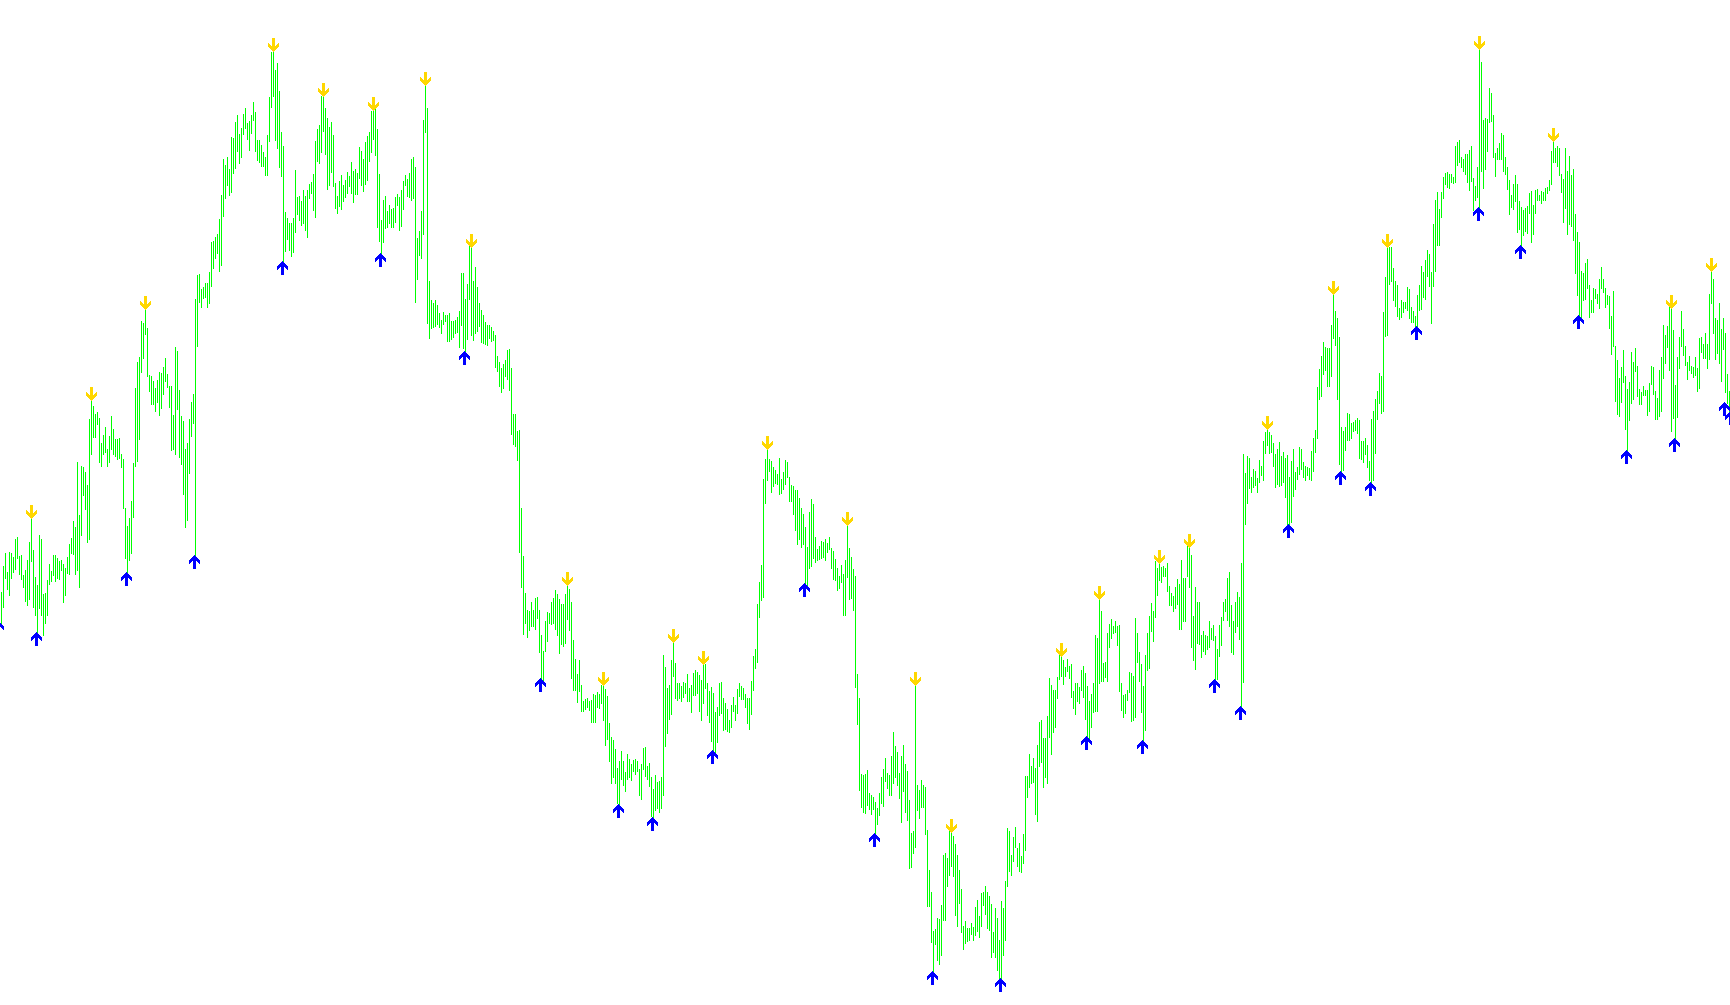
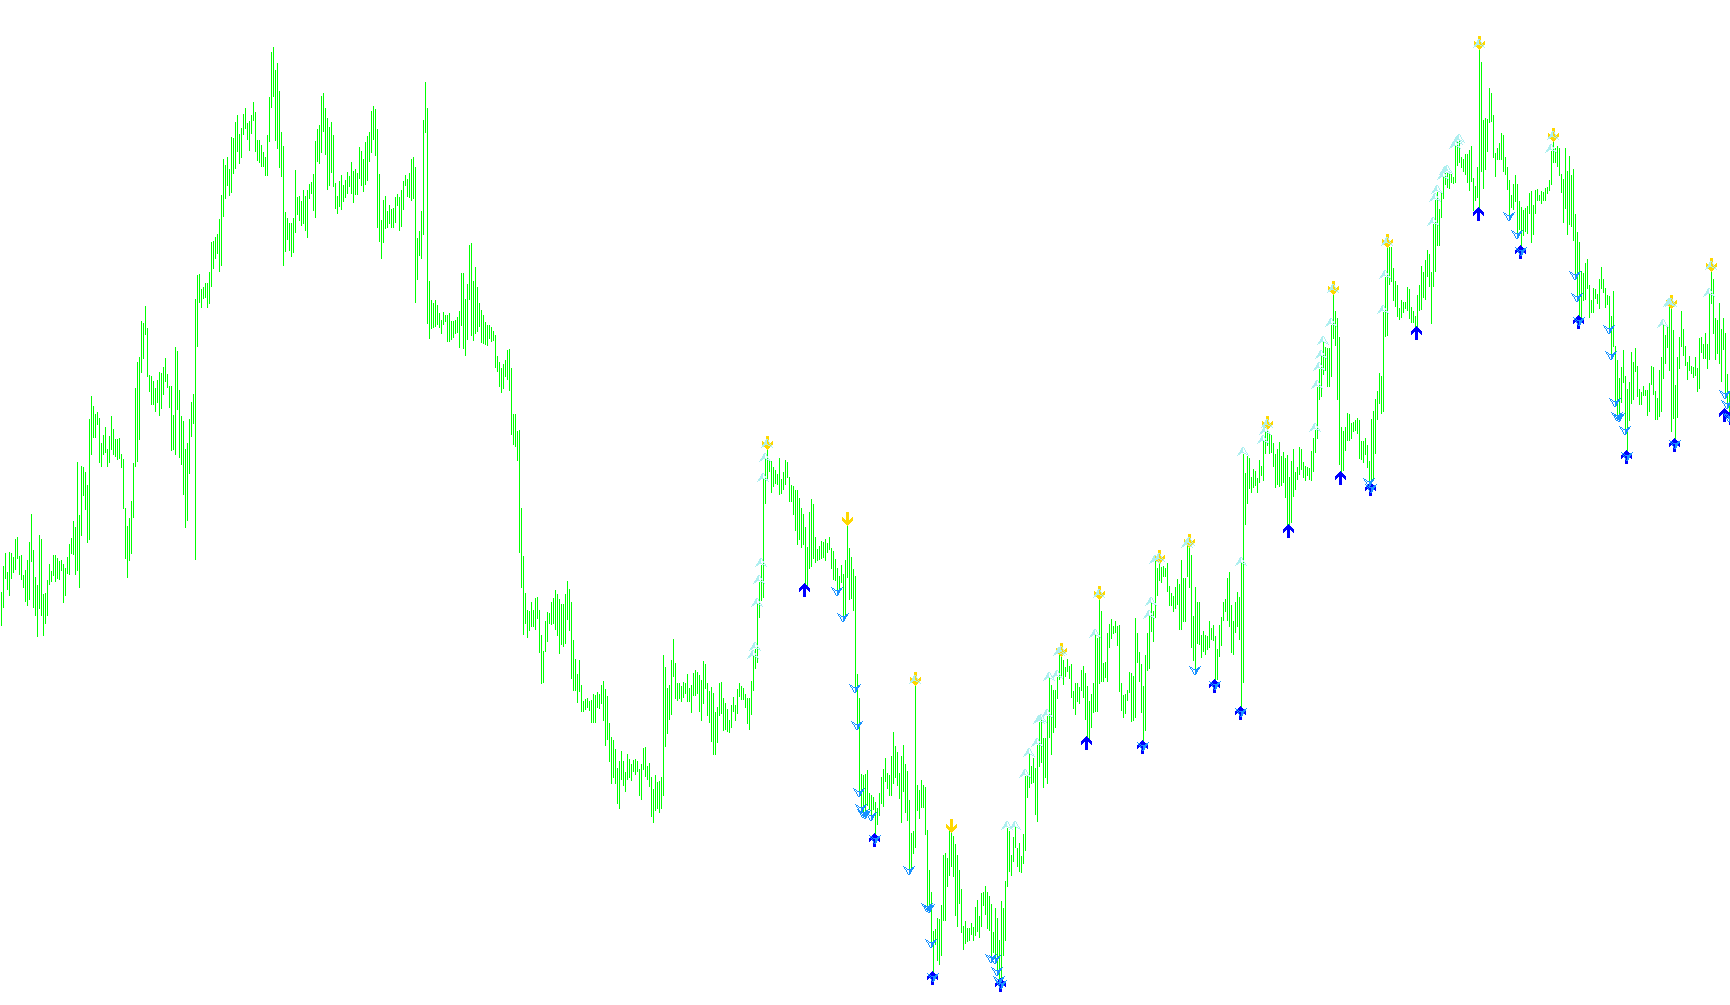
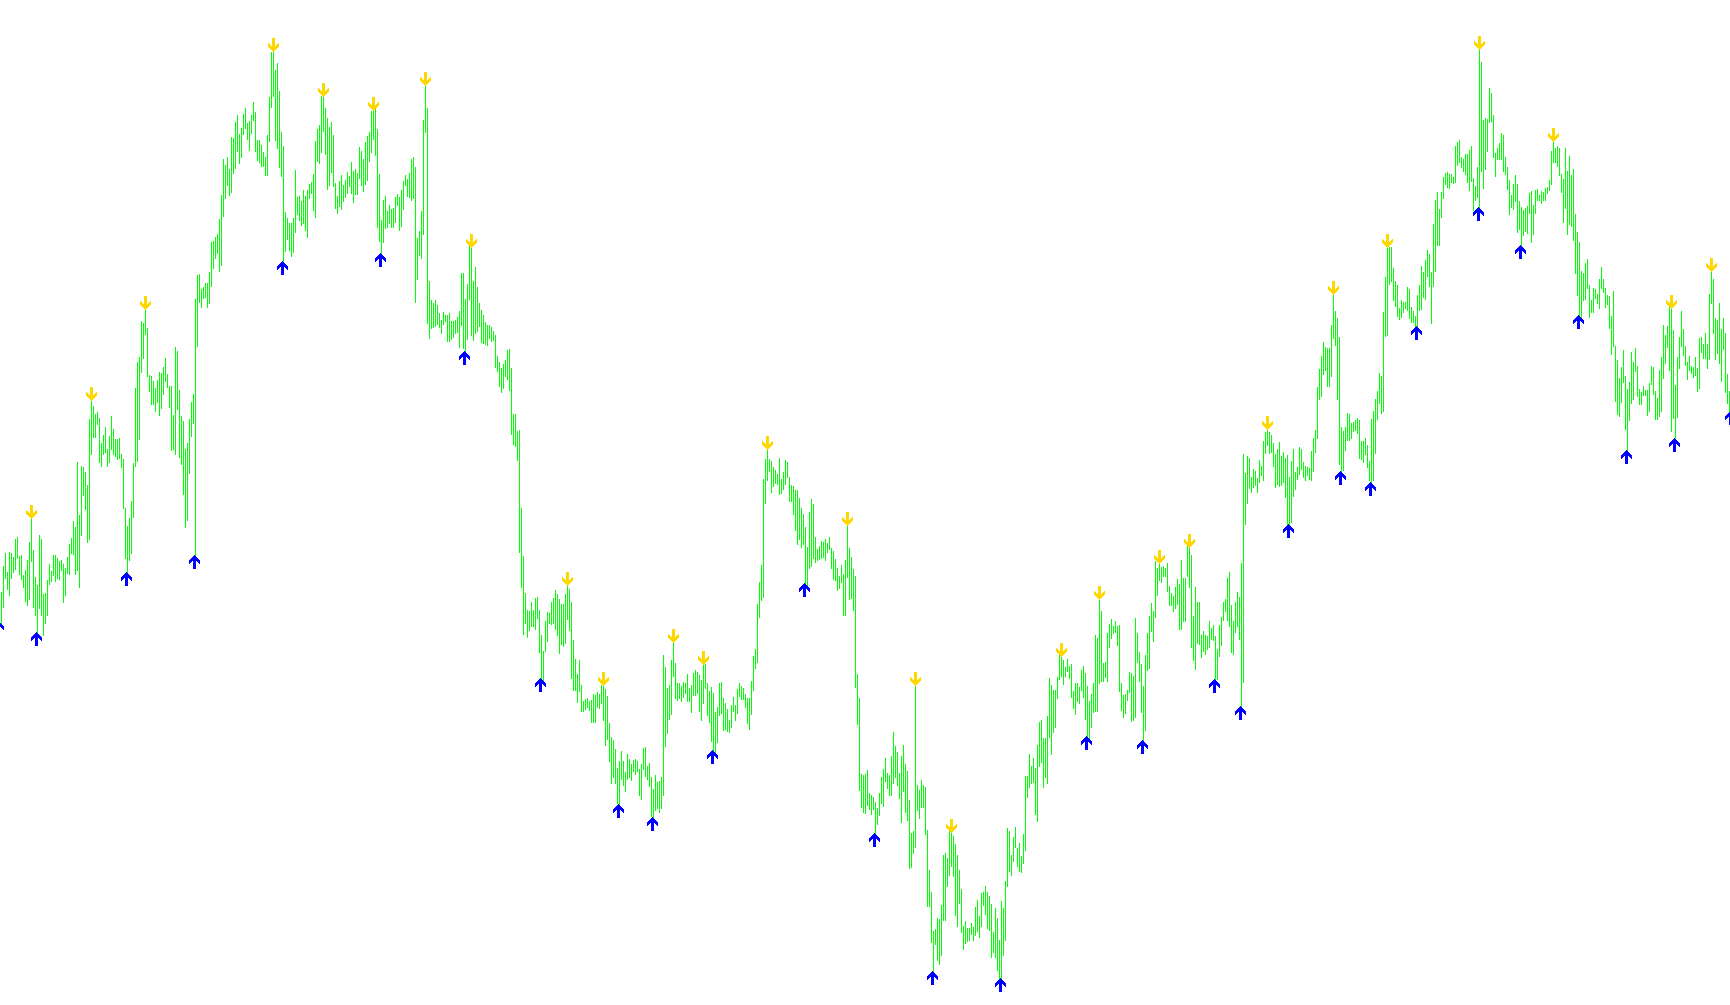
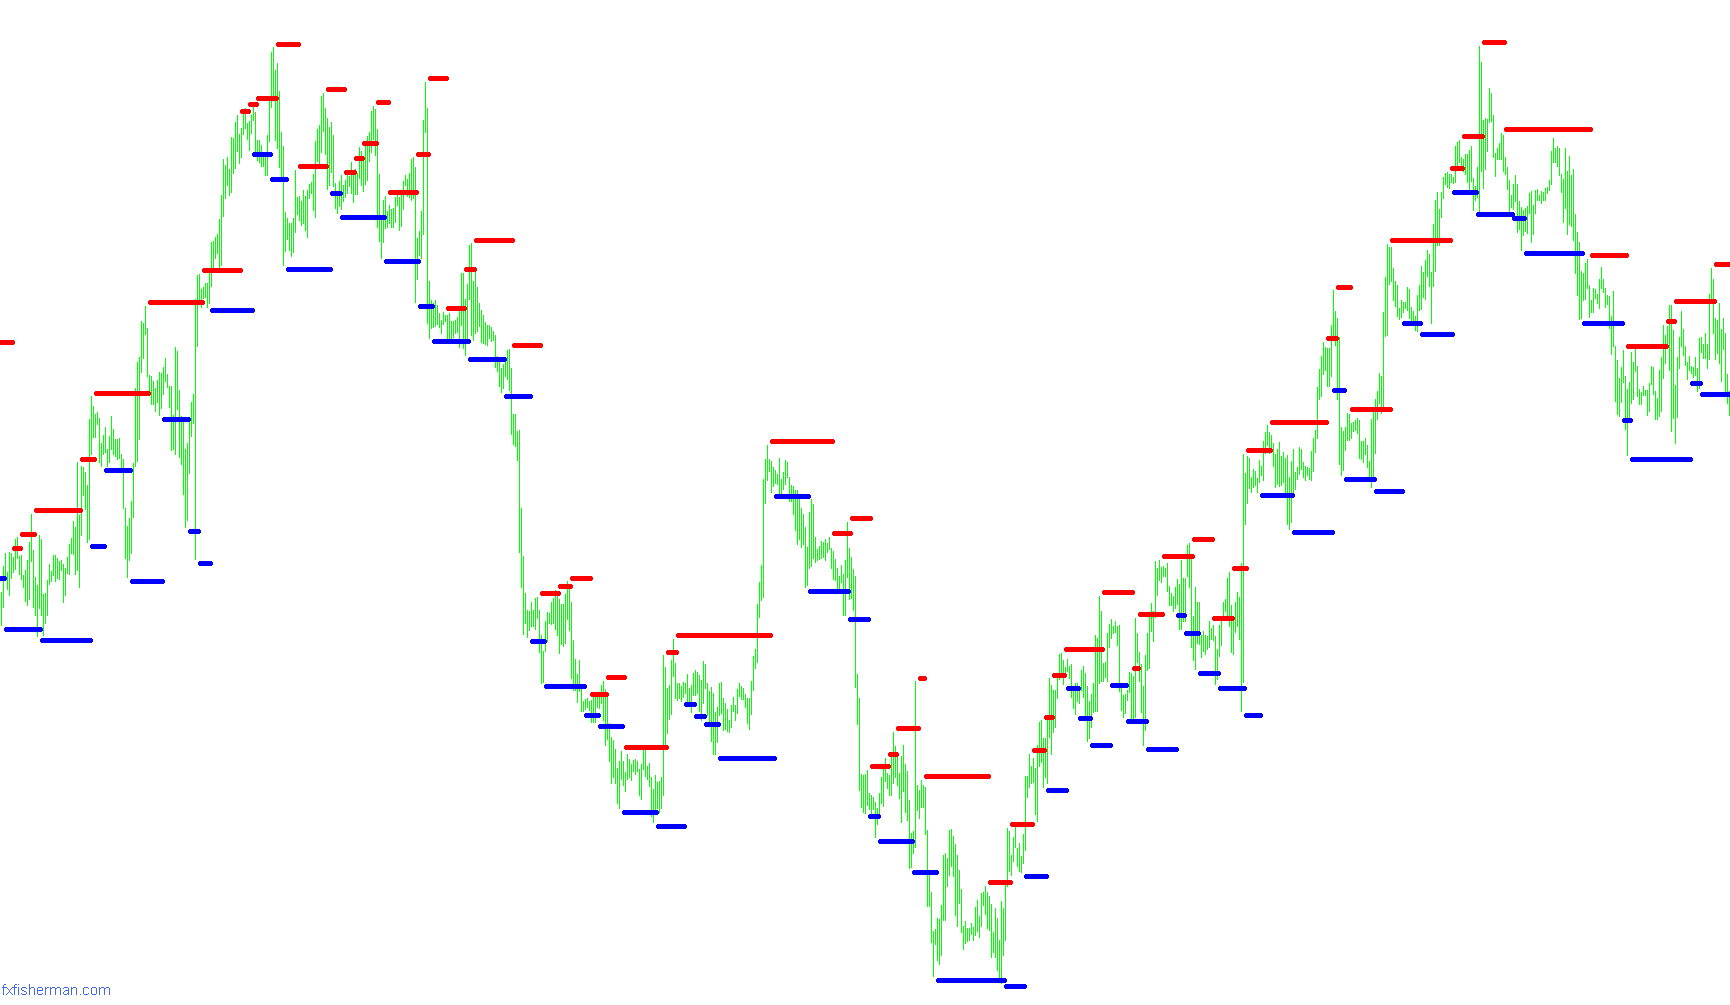
This indicator identifies potential trend exhaustion and price pivots by monitoring price breaches against a floating trailing stop level based on previous closing behaviors.
Stop_reversal_mod1
Indicator

Stop_reversal_mod1

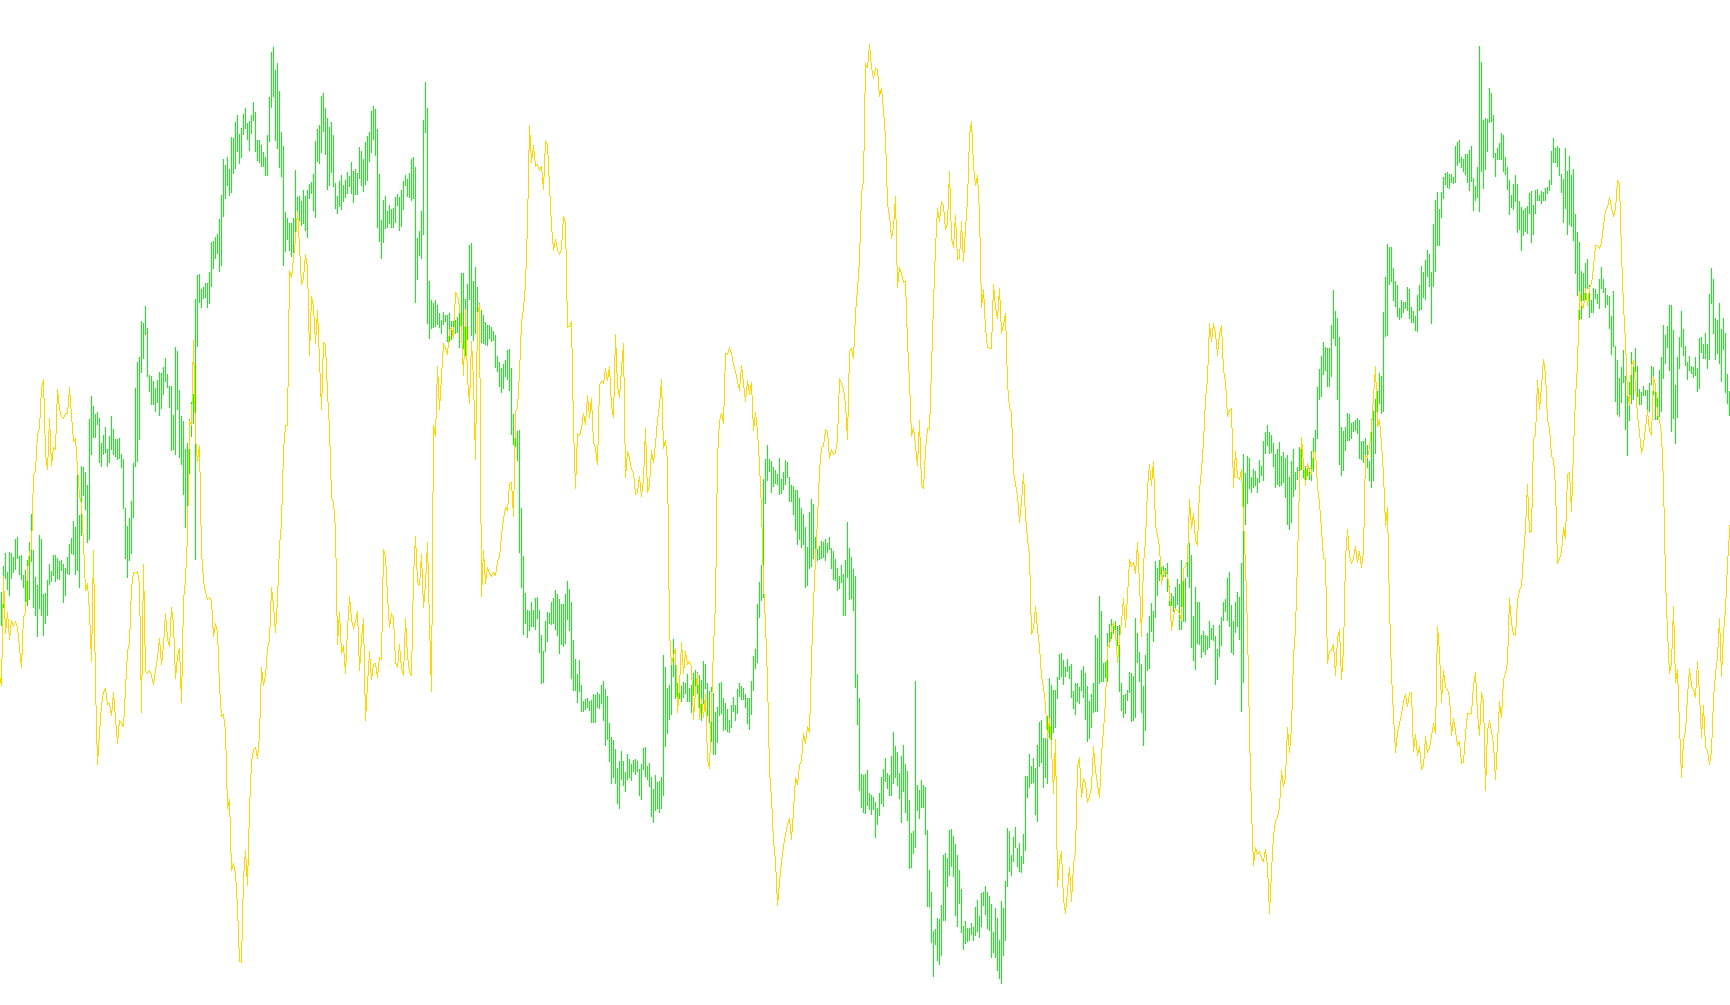
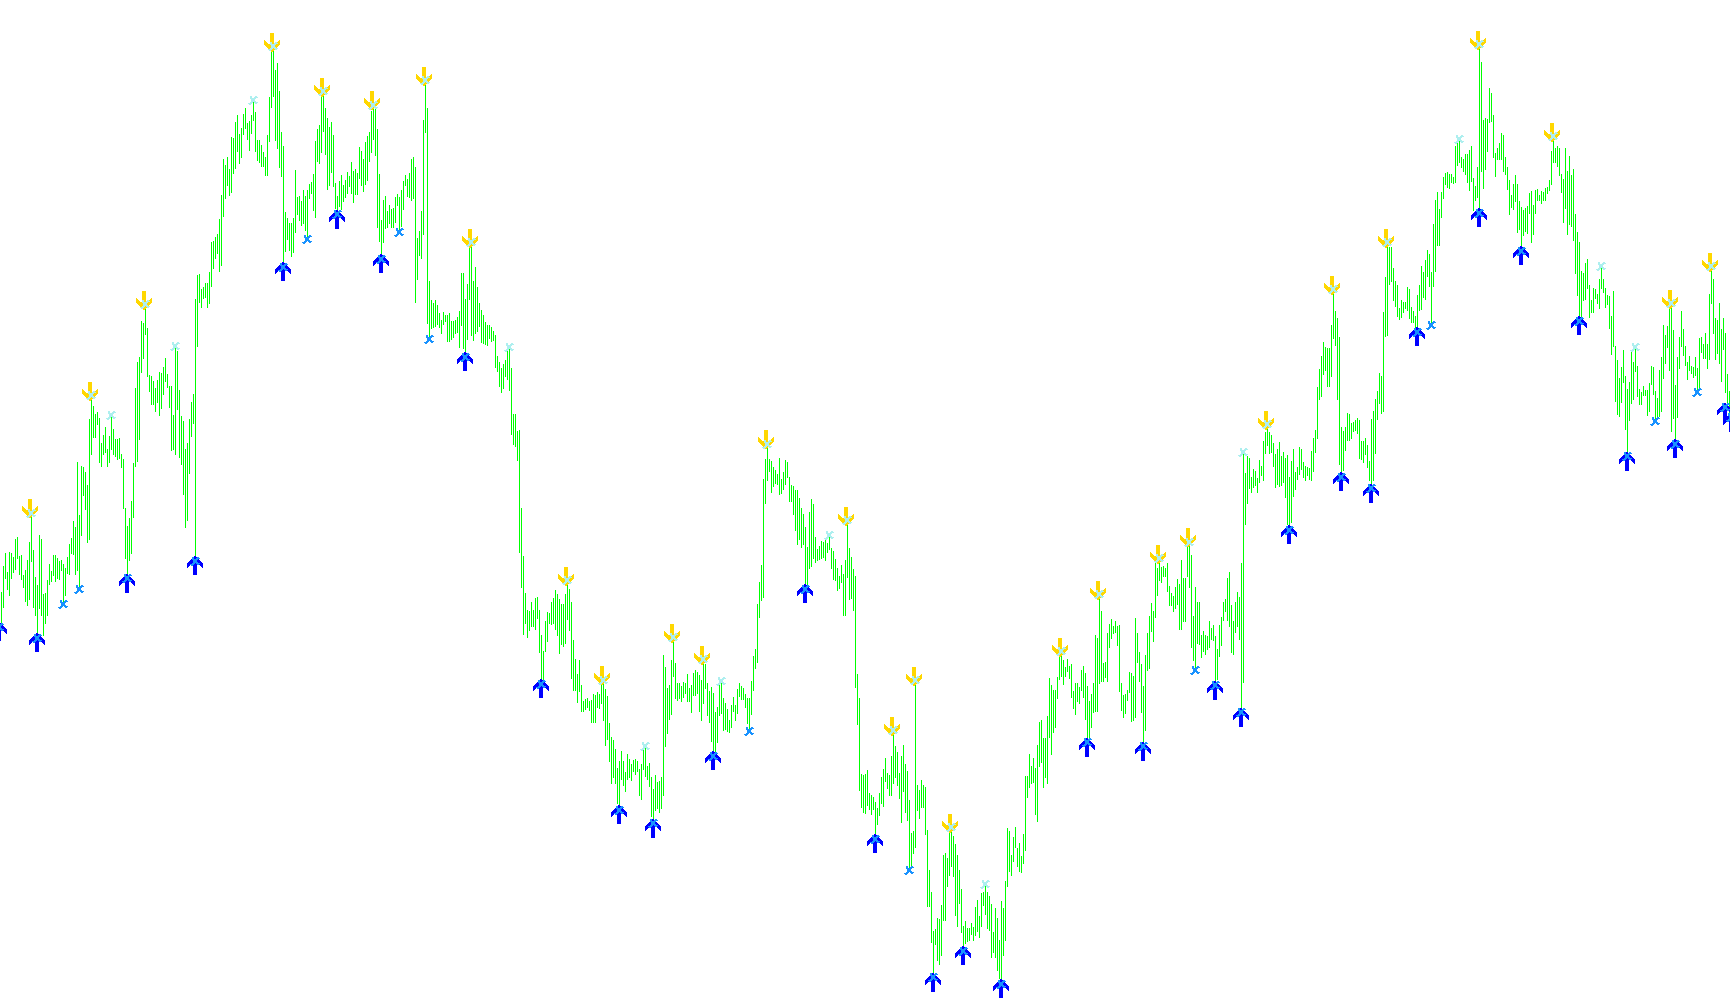
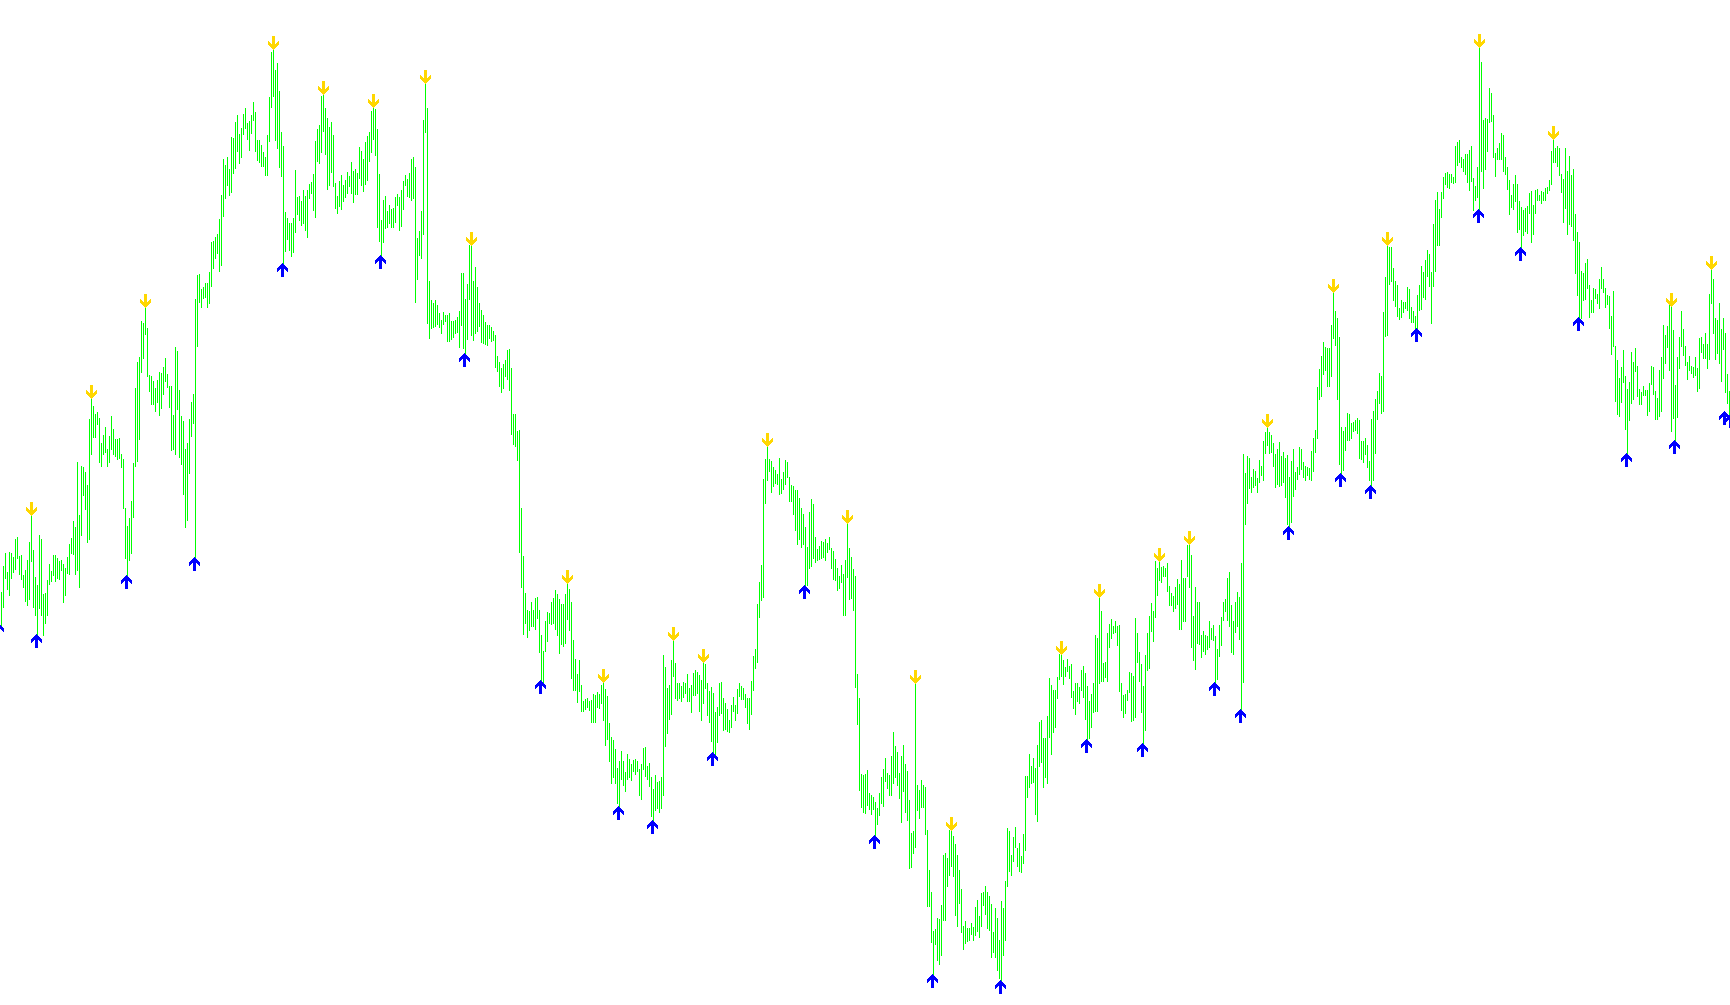
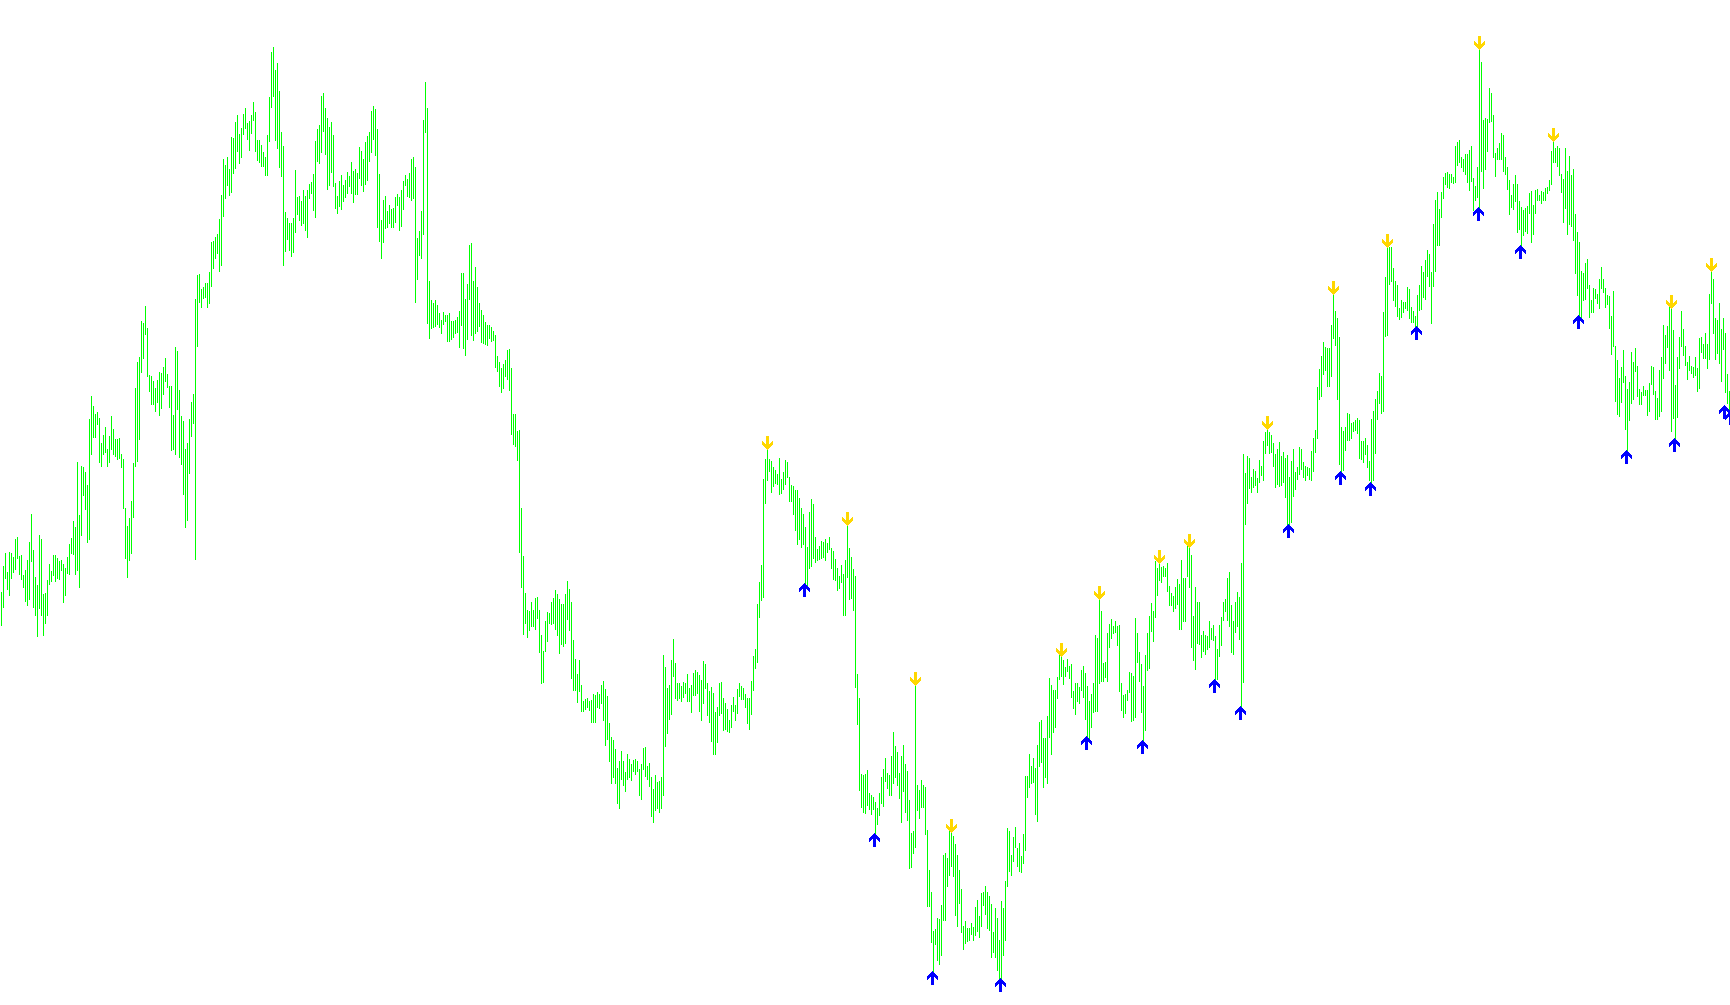
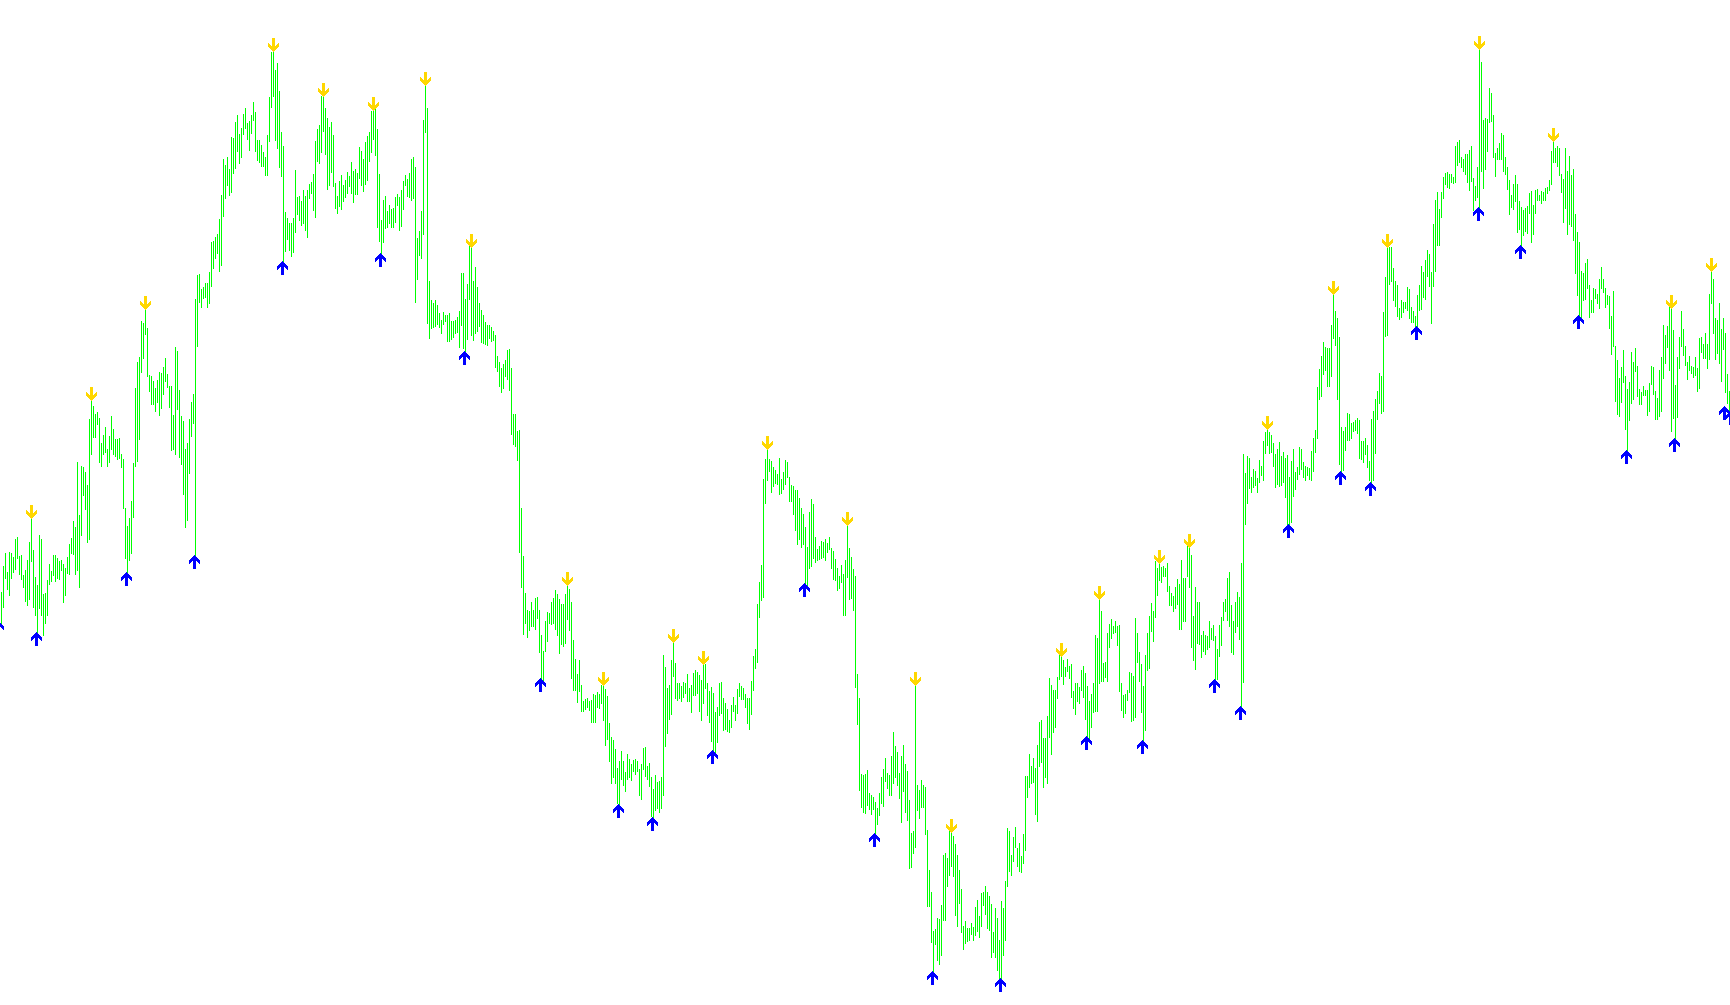
This indicator identifies potential trend exhaustion by tracking price breaches of a trailing stop level and signaling mean reversion opportunities when momentum shifts against the preceding structural trend.

Stop_reversal_mod1_v1
Indicator

Stop_reversal_mod1_v1

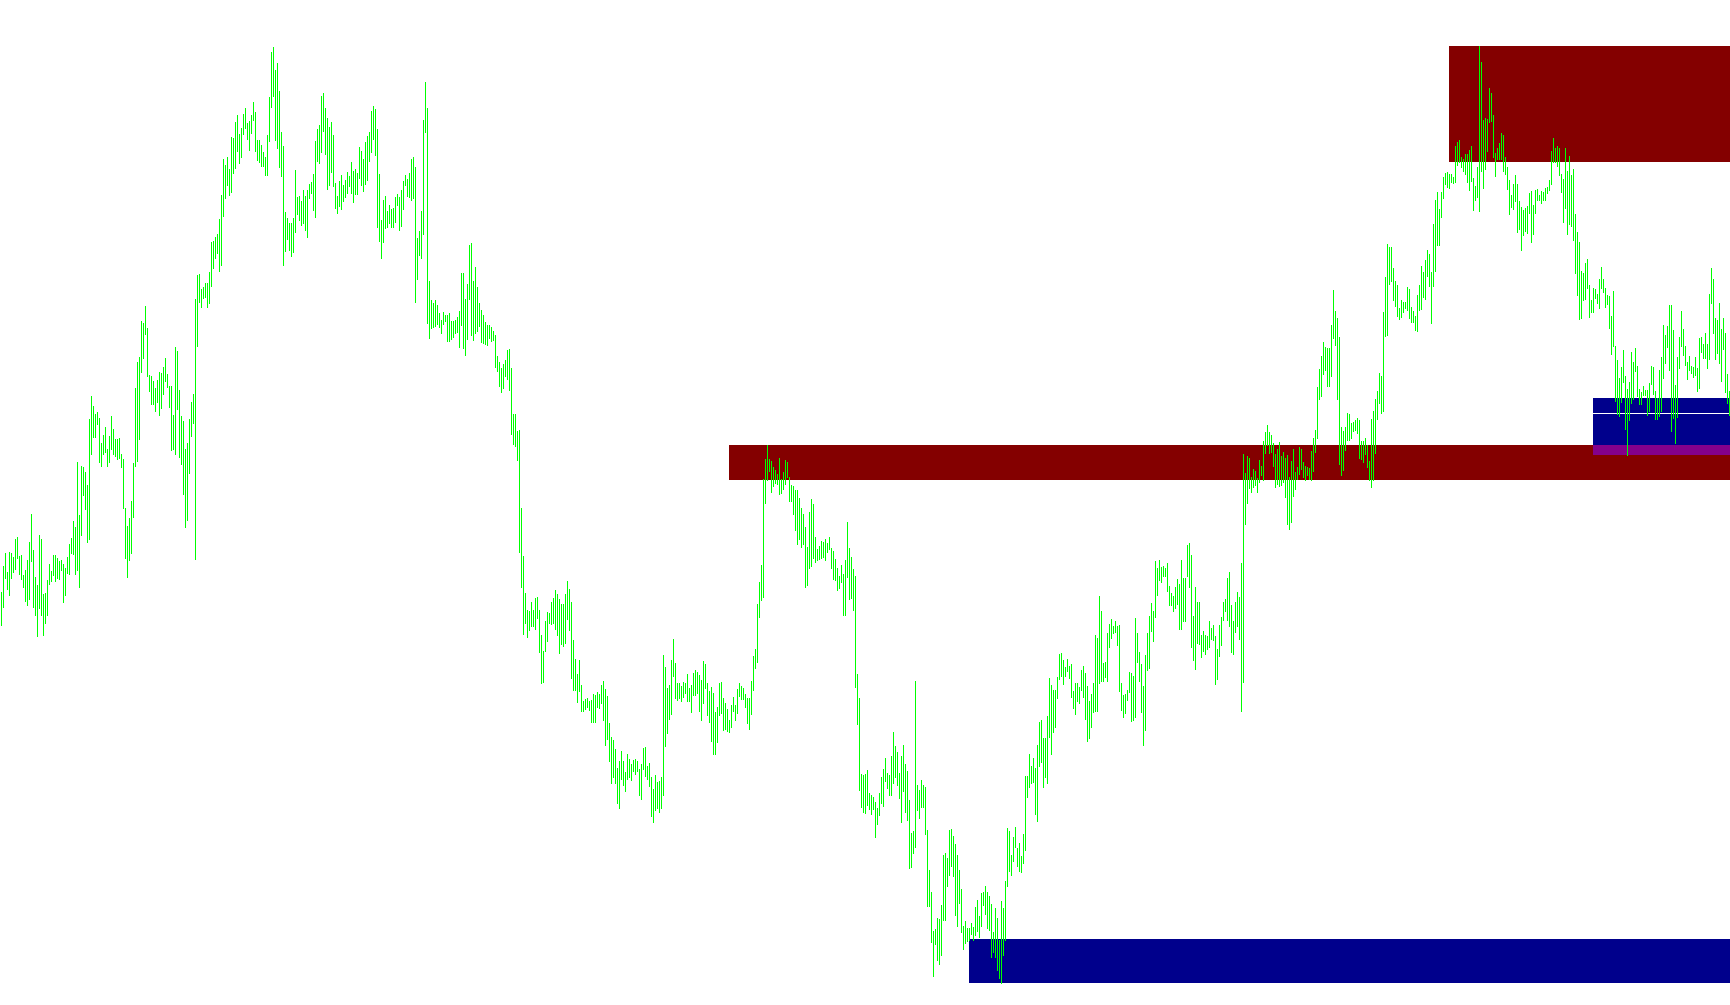
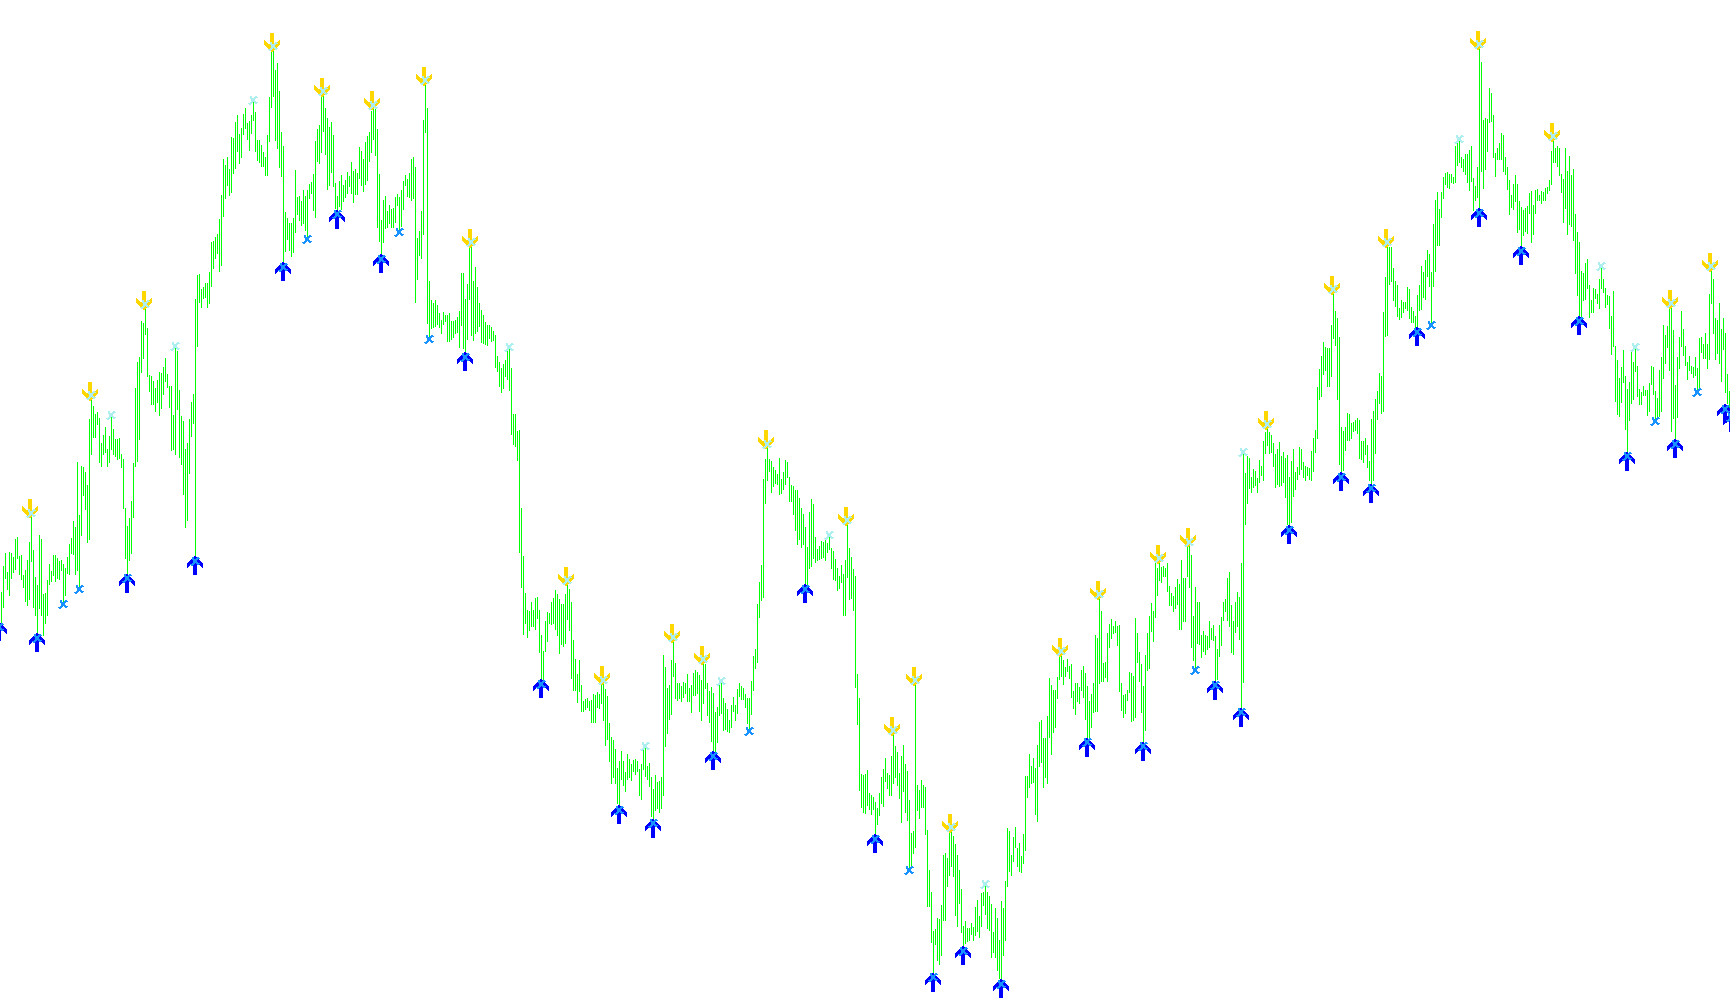
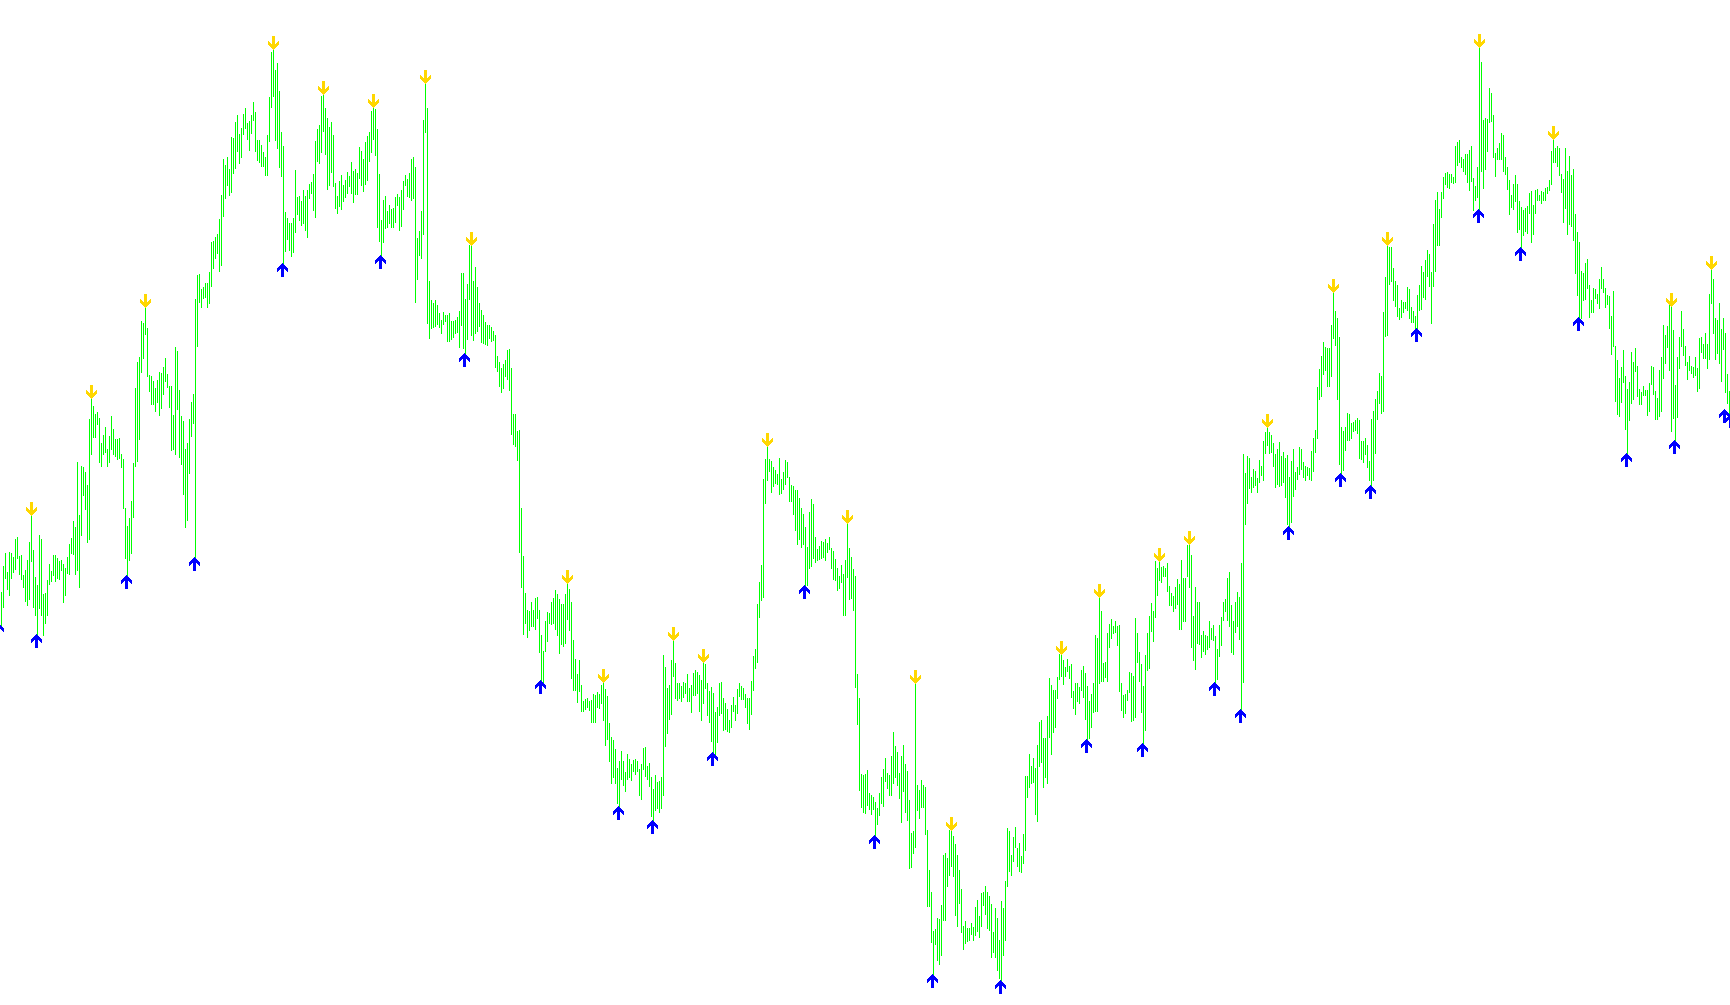
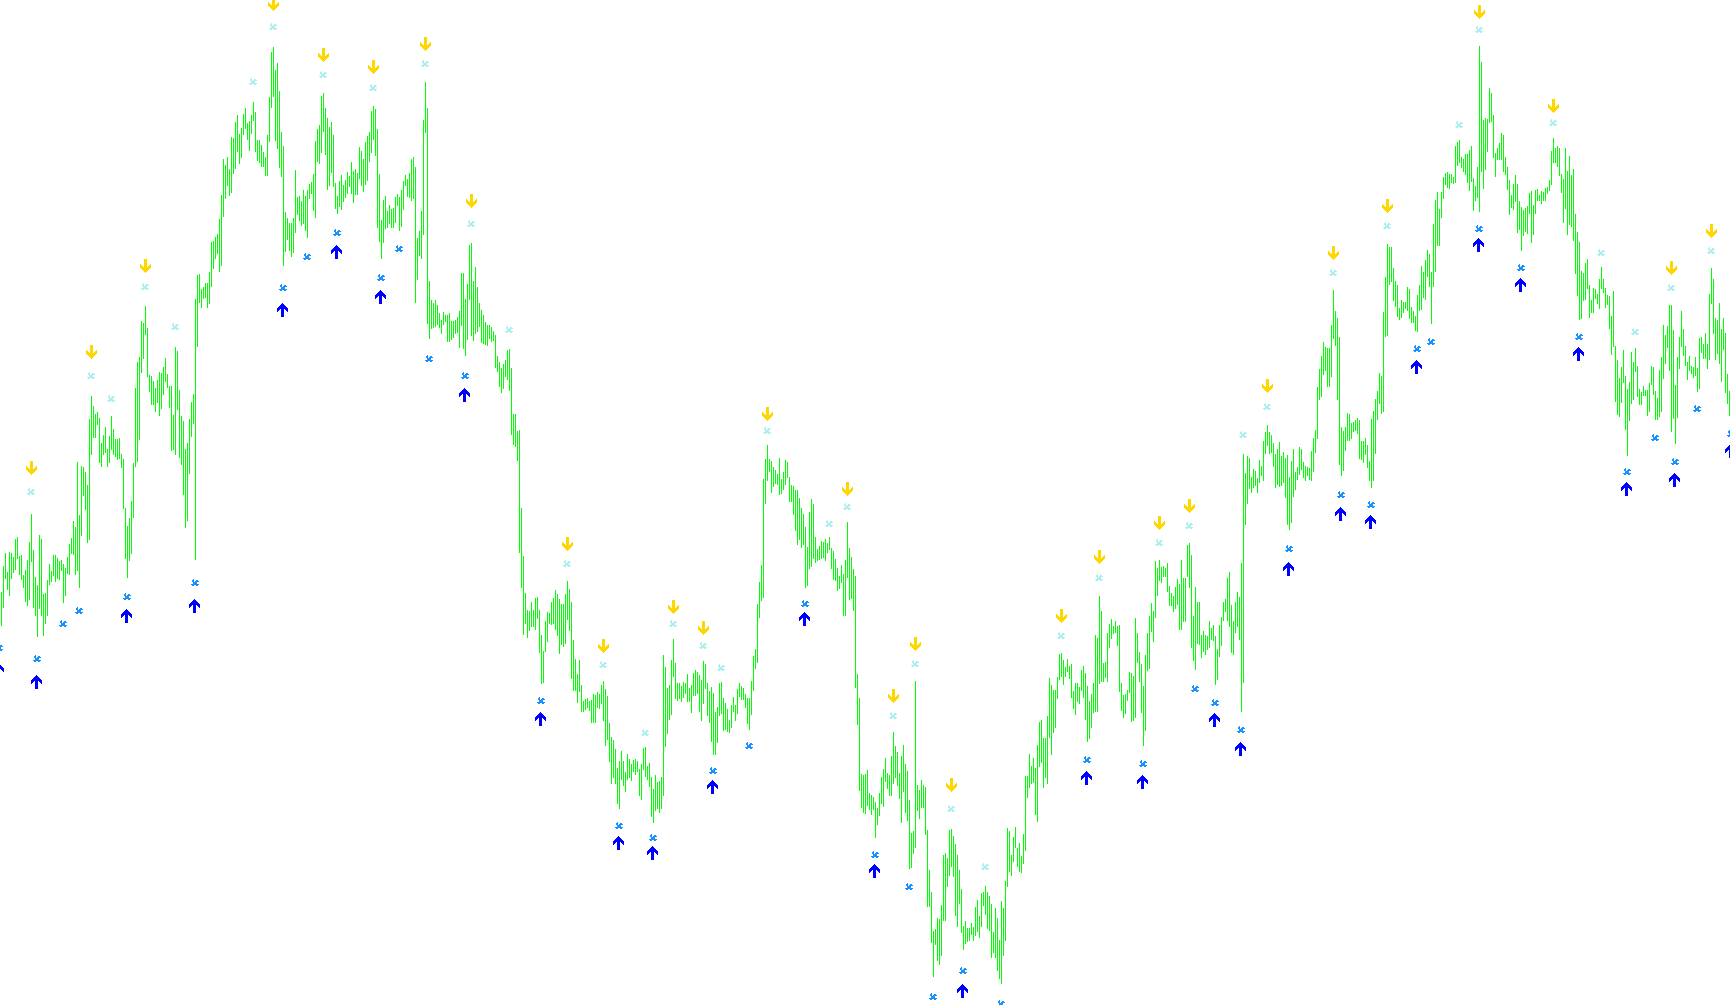
This indicator identifies potential trend shifts by tracking price breaches of dynamic stop levels and signaling momentum exhaustion through high/low histogram visual cues.

Stop_reversal_mod_v1
Indicator

Stop_reversal_mod_v1

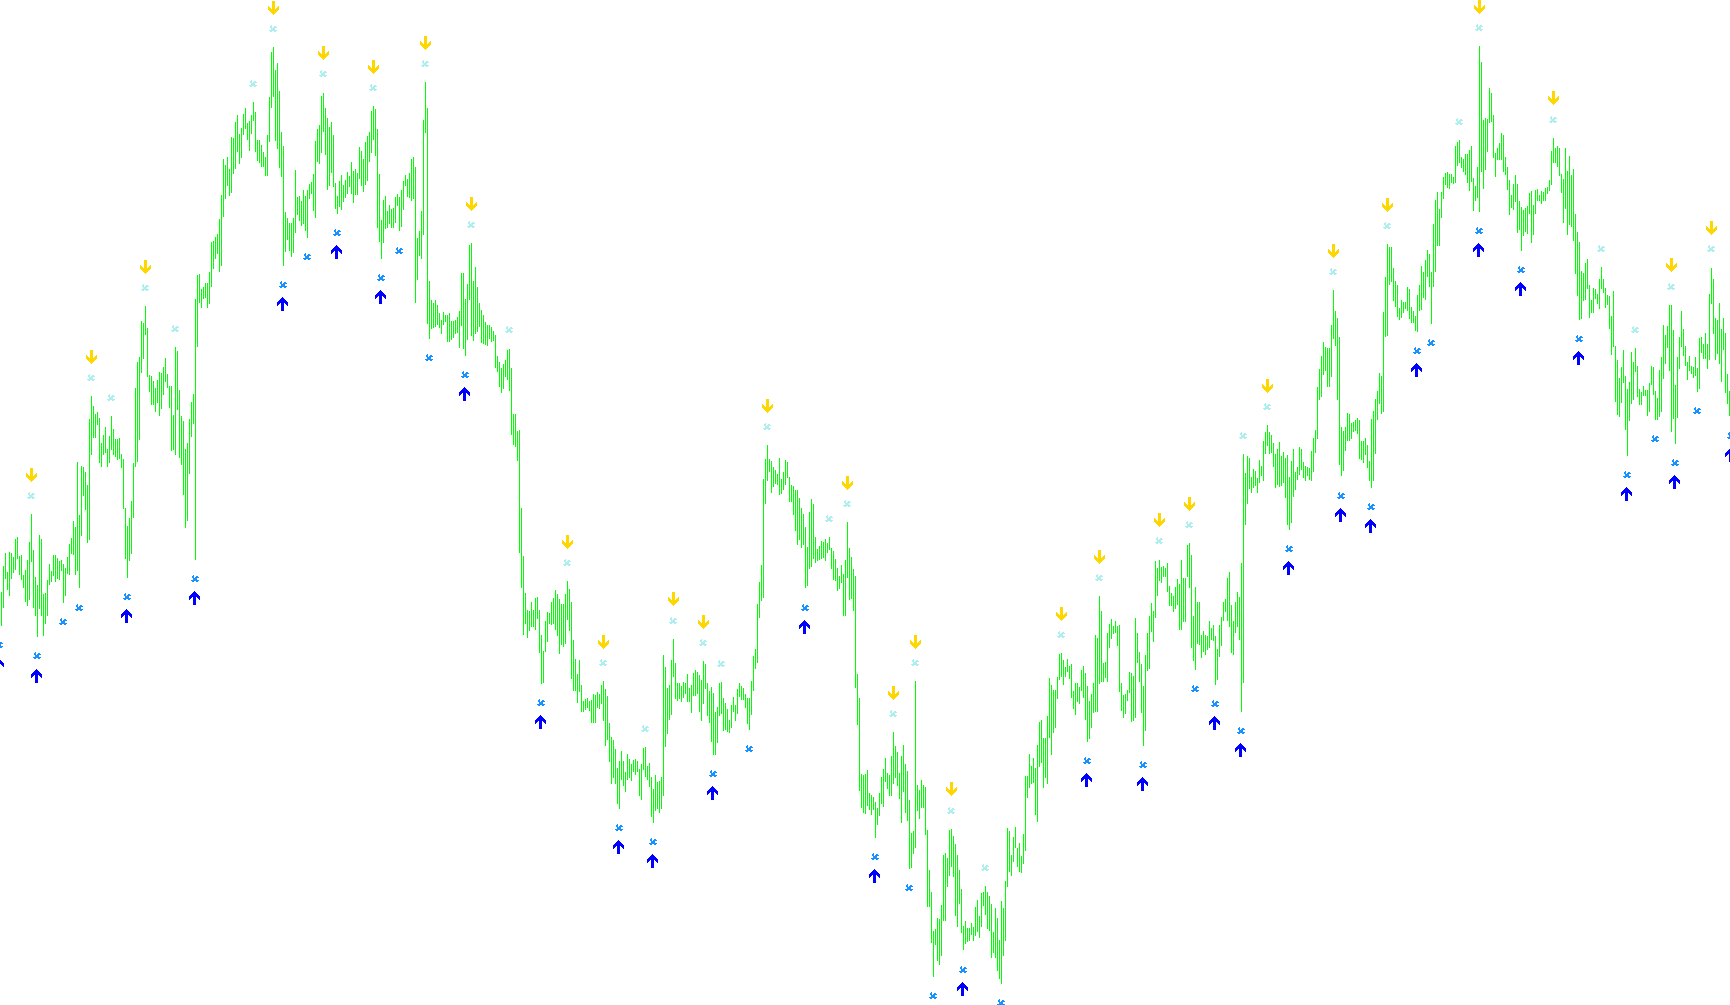
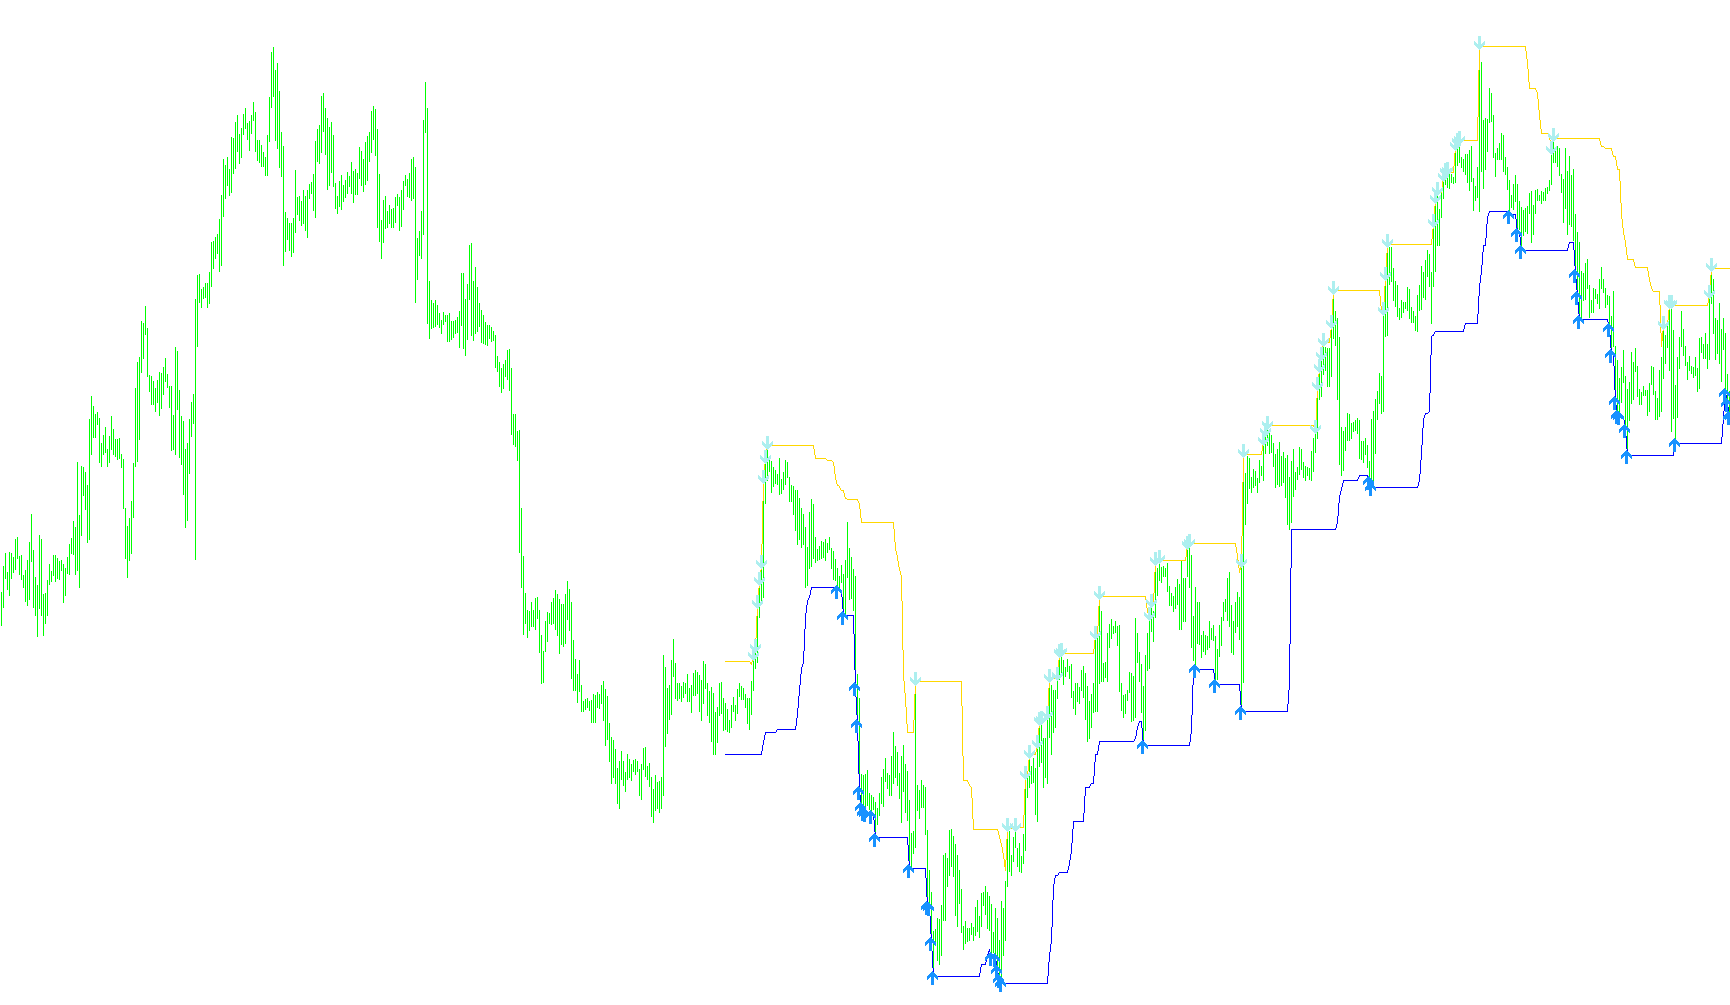
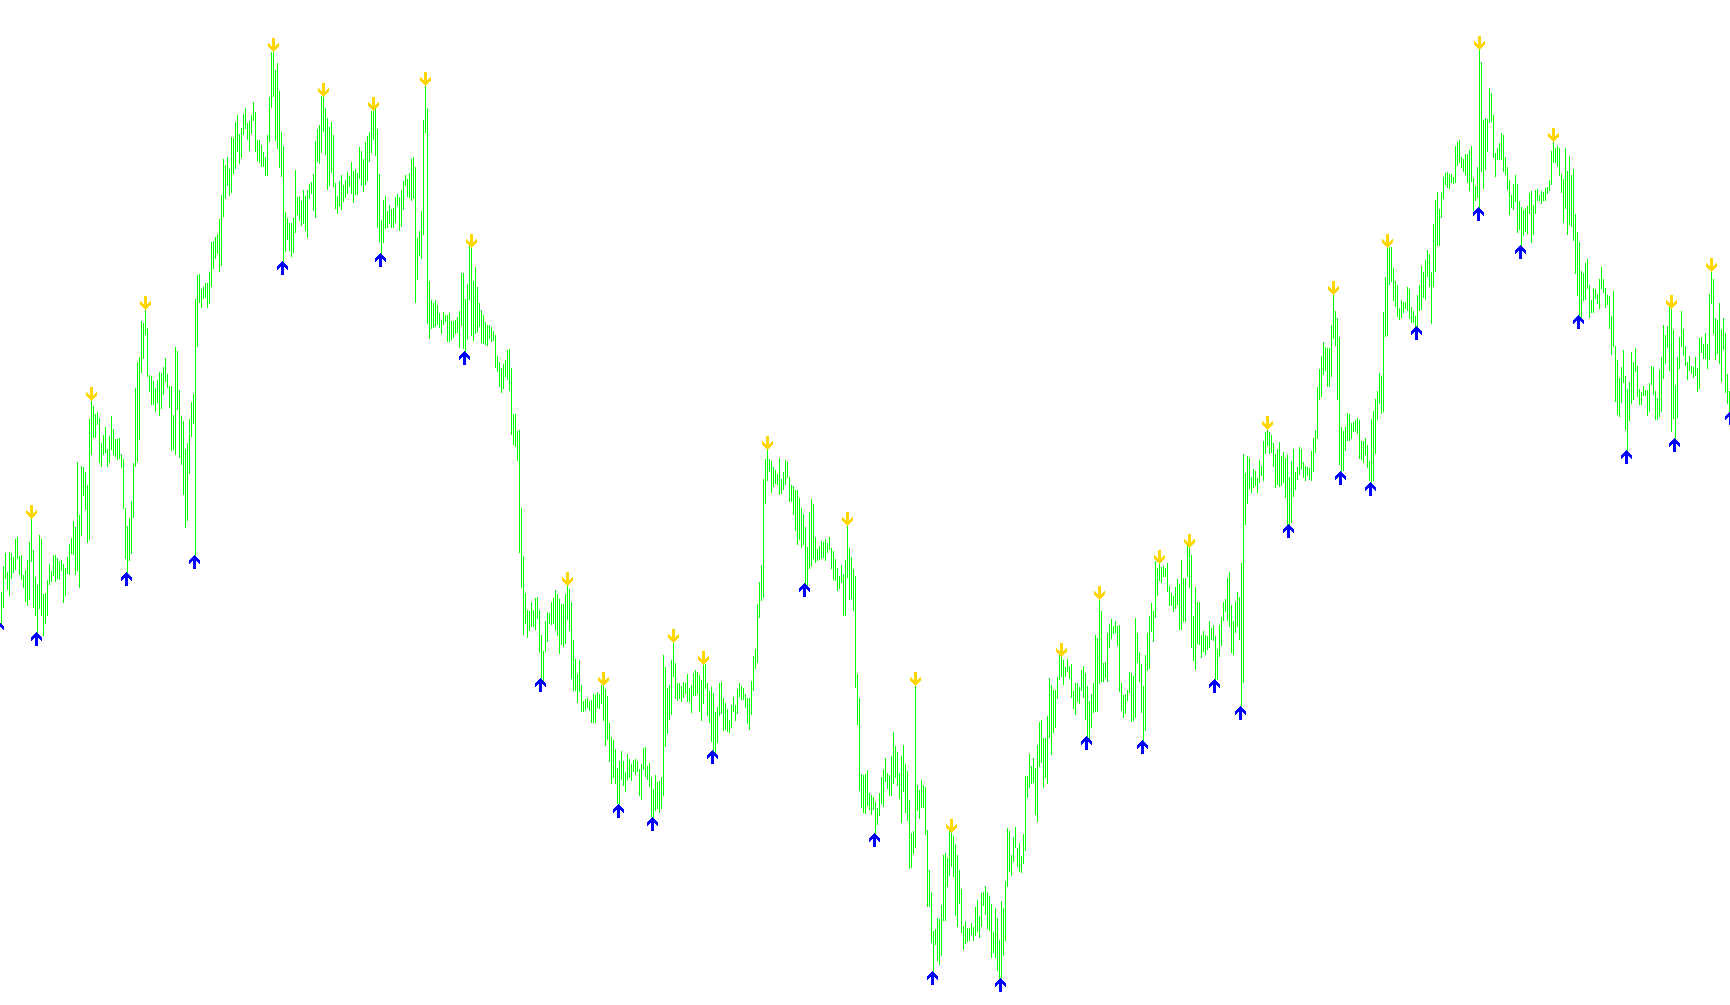
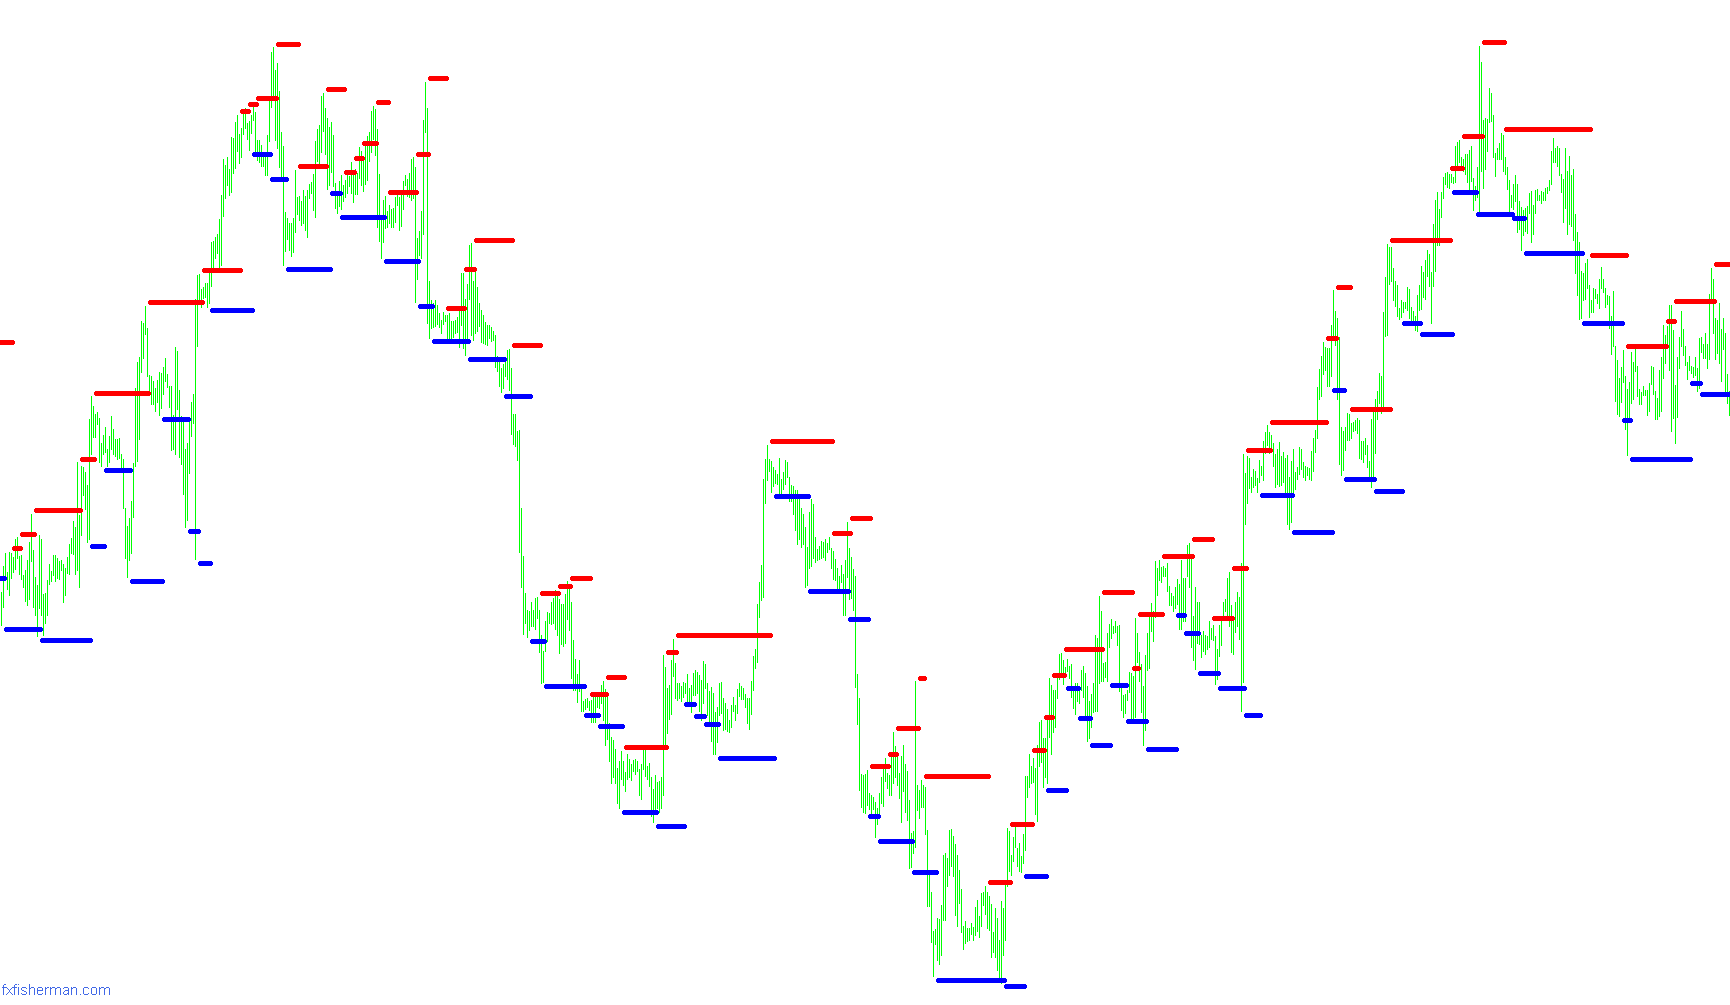
This indicator identifies potential trend reversals by calculating a dynamic stop level based on price momentum and proximity to previous structural pivots.

sto_AllStochastics_v2_mtf
Indicator

sto_AllStochastics_v2_mtf

iMA

This indicator calculates a stochastic value based on relative price positioning and applies an extensive suite of eighteen distinct moving average algorithms to smooth the main line and signal.

sto_JMA_Stochastic_KDSL
Indicator

sto_JMA_Stochastic_KDSL

iMAOnArrayiStochastic

This indicator applies a Jurik Moving Average (JMA) smoothing algorithm to the Stochastic Oscillator to reduce noise and identify high-probability momentum shifts.

STO_multisymbol_color_STO_LQ_1.0M8
Indicator

STO_multisymbol_color_STO_LQ_1.0M8

iStochastic

This indicator visualizes multi-layered sentiment by mapping Stochastic Oscillator main or signal lines into a color-coded histogram based on specific threshold zones.

Indicator

Straddler Handler

StrangeIndicator
Indicator

StrangeIndicator

iMA

This indicator normalizes the position of the closing price relative to the spread between the high and low exponential moving averages.

StrangeIndicator_v1
Indicator

StrangeIndicator_v1

iMA

This indicator calculates a percentage-based value representing the distance of the closing price relative to the range between the high and low Exponential Moving Averages.

StrangeIndicator_v2
Indicator

StrangeIndicator_v2

iMA

The logic calculates a normalized percentage representing the distance of the exponential moving average of closing prices relative to the range between the high and low exponential moving averages.

StratoTriggerlines
Indicator

StratoTriggerlines

The algorithm calculates a weighted price distribution to derive a primary trend line and applies a smoothed moving average filter to identify specific directional crossovers.

StreamAmpZZ
Indicator

StreamAmpZZ

This indicator identifies structural price pivots using a dynamic depth-based fractal logic to project linear trend lines and signal high/low exhaustion points.

Indicator

StringArraySuiteSample

StrongDay+OCHL
Indicator

StrongDay+OCHL

Identifies high-intensity price action by detecting candles whose body size exceeds a dynamic historical average while maintaining a significant proportion of the total candle range.

st_ind_2
Indicator

st_ind_2

iMA

This indicator identifies trend exhaustion by detecting directional shifts in a Linear Weighted Moving Average and visualizes active trade states with dynamic arrow markers.

st_ind_2x
Indicator

st_ind_2x

iMA

This indicator identifies potential trend shifts by detecting directional changes in the slope of a Linear Weighted Moving Average.

st_ind_2x_v1
Indicator

st_ind_2x_v1

iMA

This indicator identifies trend exhaustion and reversal points by detecting instantaneous shifts in the slope of a Linear Weighted Moving Average.

st_ind_2_v1
Indicator

st_ind_2_v1

iMA

This indicator identifies trend exhaustion by detecting divergences between the current price action and the Linear Weighted Moving Average while overlaying visual markers for active trade monitoring.

St_LRegr
Indicator

St_LRegr

This indicator calculates a linear regression trend line and projects multiple volatility bands based on standard deviation offsets from the regression path.

ST_MultiStrend_JR_R_MTF
Indicator

ST_MultiStrend_JR_R_MTF

This indicator aggregates and plots three concurrent layers of the Supertrend algorithm across different timeframes to synchronize short-term volatility with long-term trend direction.

SumLogSample
Indicator

SumLogSample

iMAOnArray

The indicator calculates a weighted sum of logarithmic price returns across EURUSD, GBPUSD, USDJPY, and AUDUSD to synthesize a unified currency strength momentum signal.

Indicator

SummaryReport

SummaryReportInPoints
Indicator

SummaryReportInPoints

This script parses historical trade data to generate a comprehensive performance report including profit factors, drawdown metrics, and sequential win/loss statistics converted into point values.

SupDem_v1.0_Dezil
Indicator

SupDem_v1.0_Dezil

iFractals

The code identifies and plots support and resistance zones on a chart based on the location of the nearest fractals, extending those zones to the current time.

super fixed
Indicator

super fixed

The indicator identifies market structural turning points by detecting overlapping local highs and lows across two distinct lookback windows to filter high-probability trend reversals.

Super Signal Alert Modified3
Indicator

Super Signal Alert Modified3

Identifies price reversal points by detecting local structural highs and lows within a defined rolling window.

Super Signal v3all
Indicator

Super Signal v3all

iATR

This indicator identifies structural reversal zones by detecting price extremes over two distinct lookback periods and projecting volatility-adjusted signals based on ATR expansion.

Super Signal v3d
Indicator

Super Signal v3d

iATR

This indicator identifies potential buy/sell signals based on highest and lowest price points over two different periods, incorporating ATR for signal placement and generating alerts upon signal creation.

Super Signal v3d_v1
Indicator

Super Signal v3d_v1

iATR

This indicator identifies high-probability reversal zones by detecting concurrent price extremes across two distinct historical lookback periods relative to ATR volatility.

Super Signal
Indicator

Super Signal

Identifies local structural extrema by detecting price points that exceed the highest highs and lowest lows within a defined look-back window.

super signals v2
Indicator

super signals v2

This indicator identifies structural pivot points by detecting localized price extremes across two distinct temporal windows.

super signals v2_001
Indicator

super signals v2_001

This indicator identifies local price extremes by detecting multi-window fractal peaks and troughs to signal potential trend reversals and liquidity exhausts.

super-signals - adjustable
Indicator

super-signals - adjustable

iATR

Identifies local price peaks and troughs by locating the absolute highest high and lowest low within a rolling window offset by Average True Range volatility.

super-signals-channel
Indicator

super-signals-channel

The algorithm identifies local price extremes within a dynamic lookback window to project high and low boundaries accompanied by directional entry markers.

super-signals-channel1
Indicator

super-signals-channel1

This indicator identifies local price extremes by detecting highest highs and lowest lows within a fixed range to plot directional reversal signals.

super-signals
Indicator

super-signals

Identifies local price extremes by detecting fractal-like peaks and troughs within a specific surrounding bar range.

super-signals_Test
Indicator

super-signals_Test

This indicator identifies local price extremities by detecting the highest highs and lowest lows within a rolling neighborhood to pinpoint potential trend reversal points.

super-signals_v1
Indicator

super-signals_v1

Identifies local price extremes by detecting the highest highs and lowest lows within a rolling lookback window to mark structural turning points.

super-signals_v1_001
Indicator

super-signals_v1_001

Identifies structural turning points by highlighting the local maxima and minima within a rolling fractal window to map price boundaries.

super-signals_v1_v1
Indicator

super-signals_v1_v1

Identifies significant price inflection points by detecting the highest highs and lowest lows within a rolling look-back window.

super-signals_v2
Indicator

super-signals_v2

The algorithm identifies localized price extrema by locating the highest highs and lowest lows within a rolling price window to plot structural reversal points.

super-signals_v2a[2]
Indicator

super-signals_v2a[2]

Identifies local price extremes by locating the highest highs and lowest lows within a rolling window to pinpoint structural reversal points.

super-signals_v2b
Indicator

super-signals_v2b

Identifies structural pivot points by locating extreme high and low price coordinates within a defined multi-bar window.

super-signals_v2b_AllArrows
Indicator

super-signals_v2b_AllArrows

Identifies significant structural turning points by detecting local extrema within a rolling high-low price window.

super-signals_v3a
Indicator

super-signals_v3a

iATR

This indicator identifies significant price extremes by detecting local highs and lows across two distinct lookback windows and projects volatility-adjusted targets based on Average True Range.

super-signals_v3a_001
Indicator

super-signals_v3a_001

iATR

This indicator identifies price extremes by detecting structural highs and lows across two distinct lookback windows and projects them using ATR-based offsets to signal trend exhaustion.

Indicator

SuperPosition

SuperSR 6
Indicator

SuperSR 6

This indicator identifies structural pivot points by detecting local price extremes and plotting new support or resistance levels only when a significant price gap exceeds a predefined threshold.

SuperSR 6_v1
Indicator

SuperSR 6_v1

This indicator identifies structural pivot points by detecting fractal price extremes and updating support or resistance levels only when a significant price gap threshold is exceeded.