Swing_Point_v2
Download script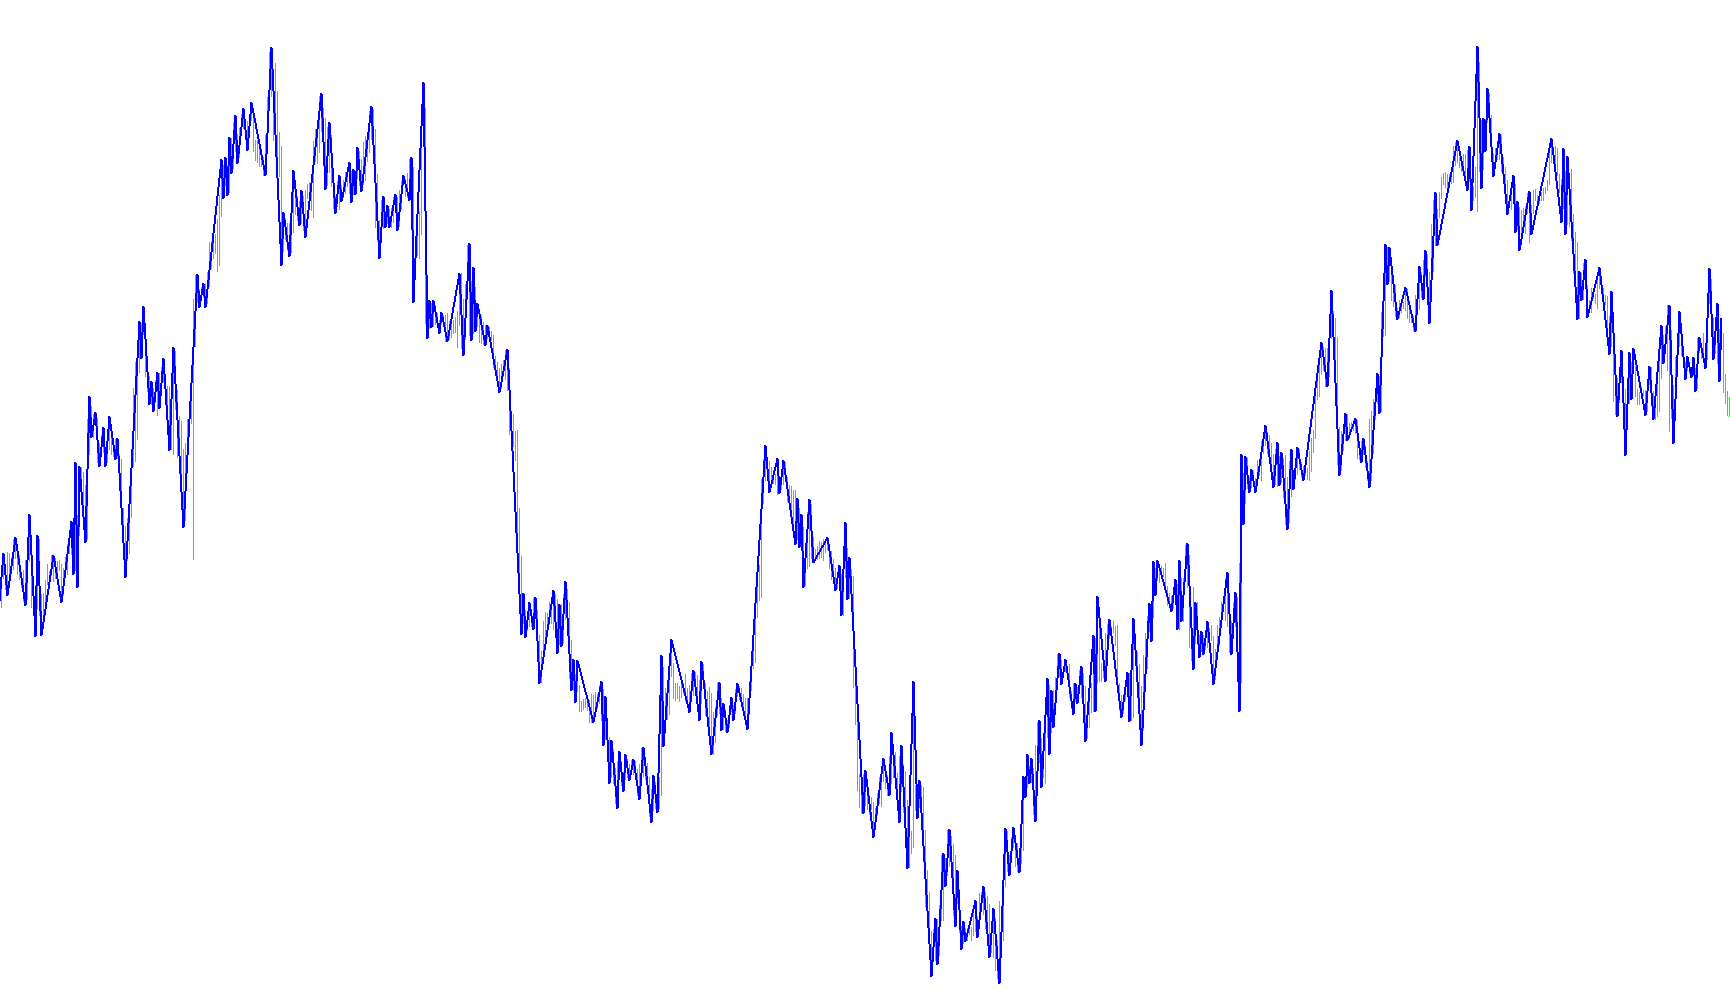
This tool is designed to identify and visualize specific structural pivot points on a price chart, helping traders recognize shifts in market momentum. By analyzing historical price action, the script automatically detects when the market transitions from one direction to another based on predefined price movements.
Core Logic Overview
The primary objective of this script is to track "reversal points." It monitors the highs and lows of previous candles to establish the current boundaries of the market's movement. It operates by observing how price behaves relative to these boundaries and identifies specific triggers that suggest a change in trend.
How it Works
1. Trend Monitoring The script continuously tracks whether the current market sentiment is moving upward or downward. It does this by comparing current price highs and lows against previous historical data points.
2. Reversal Detection Instead of reacting to every minor price fluctuation, the logic looks for a significant "reversal" move. It identifies these moves based on a user-defined distance (the "ReversPoint"). For example:
- If the market is in an upward trend and the price drops significantly below a certain threshold relative to the recent high, the script flags a potential shift to a downward trend.
- Conversely, if the market is in a downward trend and the price climbs significantly above a certain threshold relative to the recent low, it flags a potential shift back to an upward trend.
3. Signal Visualization When the script confirms that these specific conditions have been met—meaning the price has moved enough to invalidate the current trend—it marks the exact point on the chart where the reversal began. These points are displayed as blue markers, providing a clear visual cue of where the market's structural direction shifted.
Key Features for the User
- Automated Tracking: The script handles all the heavy lifting of comparing historical high/low values and calculating distance thresholds in real-time.
- Customizable Sensitivity: Users can adjust the
ReversPointparameter to dictate how much price movement is required before a reversal is officially recognized, allowing for more conservative or aggressive trend identification. - Visual Clarity: By plotting these points directly on the chart, it simplifies the process of identifying "swing" highs and lows without the need for manual line drawing or constant observation of every tick.
/*-----------------------------+
|			       |
| Shared by www.Aptrafx.com    |
|			       |
+------------------------------*/

//+------------------------------------------------------------------+
//|                                                        RPoint.mq4 |
//|                               Copyright © 2004, Poul_Trade_Forum |
//|                                                         Aborigen |
//|                                          http://forex.kbpauk.ru/ |
//+------------------------------------------------------------------+
#property copyright "Poul Trade Forum"
#property link      "http://forex.kbpauk.ru/"
#property indicator_chart_window
#property indicator_buffers 1
#property indicator_color1 Blue

//---- input parameters
extern int ReversPoint=50;
//---- buffers
double RBuffer[];
int Trend=1,InTrend,ttime;
double Points,Last_High, Last_Low;
//+------------------------------------------------------------------+
//| Custom indicator initialization function                         |
//+------------------------------------------------------------------+
int init()
  {
   string short_name;
   Points = MarketInfo (Symbol(), MODE_POINT);
//---- indicator line
   SetIndexStyle(0,DRAW_SECTION,EMPTY,2,Blue);
   SetIndexBuffer(0,RBuffer);
   SetIndexEmptyValue(0,0);

//---- name for DataWindow and indicator subwindow label
   short_name="RPoint";
   IndicatorShortName(short_name);
   SetIndexLabel(0,short_name);

//----
   SetIndexDrawBegin(0,100);
   ArrayInitialize(RBuffer,0);
//----

   return(0);
  }
//+------------------------------------------------------------------+
//| Custor indicator deinitialization function                       |
//+------------------------------------------------------------------+
int deinit()
  {
//---- TODO: add your code here

//----
   return(0);
  }
//+------------------------------------------------------------------+
//| Custom indicator iteration function                              |
//+------------------------------------------------------------------+
int start()
  {
   int    counted_bars=IndicatorCounted(),i,shift;

//---- TODO: add your code here
i=(Bars-counted_bars)-1;

for (shift=i; shift>=0;shift--)
{

if (Time[shift]!=ttime) InTrend=InTrend+1;
ttime=Time[shift];
RBuffer[shift]=0;
if (High[shift+1]>Last_High && Trend==1)  InTrend=1;
if (Low[shift+1]<Last_Low   && Trend==0)   InTrend=1;
if (High[shift+1]>Last_High) Last_High=High[shift+1];
if (Low[shift+1]<Last_Low)   Last_Low=Low[shift+1];

if (Trend==1 && Low[shift+1]<Last_High-ReversPoint*Points && InTrend>1)
{
Trend=0;
RBuffer[shift+InTrend]=High[shift+InTrend];
Last_High=Low[shift+1];
Last_Low=Low[shift+1];
InTrend=1;
}

if (Trend==0 && High[shift+1]>Last_Low+ReversPoint*Points && InTrend>1)
{
Trend=1;
RBuffer[shift+InTrend]=Low[shift+InTrend];
Last_Low=High[shift+1];
Last_High=High[shift+1];
InTrend=1;
}
//----
}
   return(0);
  }
//+------------------------------------------------------------------+
Comments