Support and Resistance (Barry)_001
Download script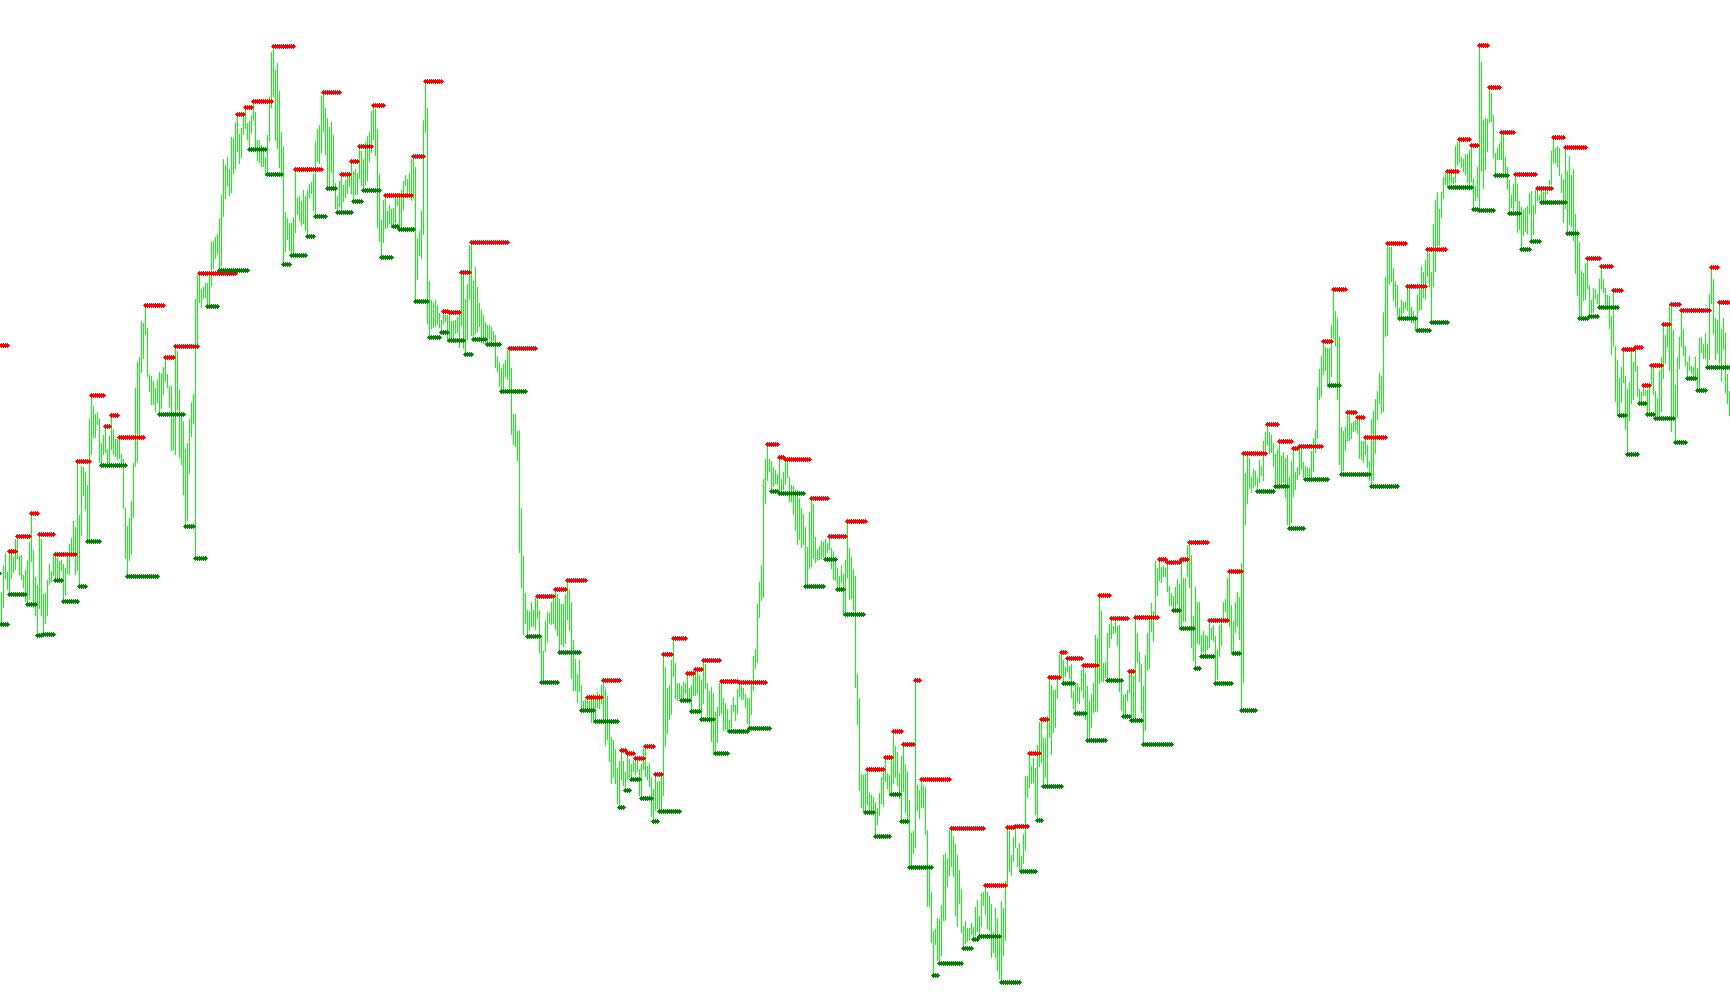
This tool is designed to automatically identify and visualize key price levels on your trading chart, specifically focusing on "Support" and "Resistance" zones. These are areas where the market historically shows a tendency to pause, react, or reverse direction.
How the Logic Works
The script operates by scanning historical price data to find specific structural turning points. It utilizes a mathematical approach to detect local peaks and valleys—points where the price reaches a high or low relative to the bars immediately surrounding it.
1. Identifying Resistance (Ceilings) The tool looks for "Upper Fractals." When the script detects a peak where the price has pushed upward but then retreated, it marks this as a resistance level. On your chart, these are displayed as Red dots. These represent areas where selling pressure has historically been strong enough to prevent the price from moving higher.
2. Identifying Support (Floors) Simultaneously, the tool scans for "Lower Fractals." When it detects a valley where the price has dropped but then bounced back up, it marks this as a support level. These are displayed as Green dots. These represent areas where buying interest has historically been sufficient to prevent the price from dropping further.
3. Persistence of Levels A key feature of this logic is its ability to maintain these levels visually across the chart. Rather than just showing a single point in time, the script carries forward the most recent identified high and low values. This creates a continuous visual reference for the trader, allowing you to see where significant price "memory" exists.
Practical Application
By highlighting these zones, the script helps traders visualize the "geography" of the market. Instead of guessing where a price might turn, you can see clearly defined areas of historical interest:
- Red Zones (Resistance): Areas to watch for potential pullbacks or reversals from above.
- Green Zones (Support): Areas to watch for potential bounces or entries from below.
//+------------------------------------------------------------------+
//|                Support and Resistance                            |
//|                Copyright © 2004  Barry Stander                   |
//|                http://myweb.absa.co.za/stander/4meta/            |
//+------------------------------------------------------------------+
#property copyright "Click here: Barry Stander"
#property link      "http://myweb.absa.co.za/stander/4meta/"

#property indicator_chart_window
#property indicator_buffers 2
#property indicator_color1 Red
#property indicator_color2 Green

//---- buffers
double v1[];
double v2[];
double val1;
double val2;
int i;

int init()
  {

  IndicatorBuffers(2);

//---- drawing settings
 SetIndexArrow(0, 119);
 SetIndexArrow(1, 119);

   SetIndexStyle(0,DRAW_ARROW,STYLE_DOT,0,Red);
   SetIndexDrawBegin(0,i-1);
   SetIndexBuffer(0, v1);
   SetIndexLabel(0,"Resistance");


   SetIndexStyle(1,DRAW_ARROW,STYLE_DOT,0,Green);
   SetIndexDrawBegin(1,i-1);
   SetIndexBuffer(1, v2);
   SetIndexLabel(1,"Support");

   return(0);
  }

int start()
  {

   i=Bars;
   while(i>=0)
     {

val1 = iFractals(NULL, 0, MODE_UPPER,i);
 if (val1 > 0)
   v1[i]=High[i];
    else
      v1[i] = v1[i+1];

val2 = iFractals(NULL, 0, MODE_LOWER,i);
 if (val2 > 0)
   v2[i]=Low[i];
      else
      v2[i] = v2[i+1];

      i--;
     }
   return(0);
  }

//+------------------------------------------------------------------+
Comments