Support and Resistance (Barry)_003
Download script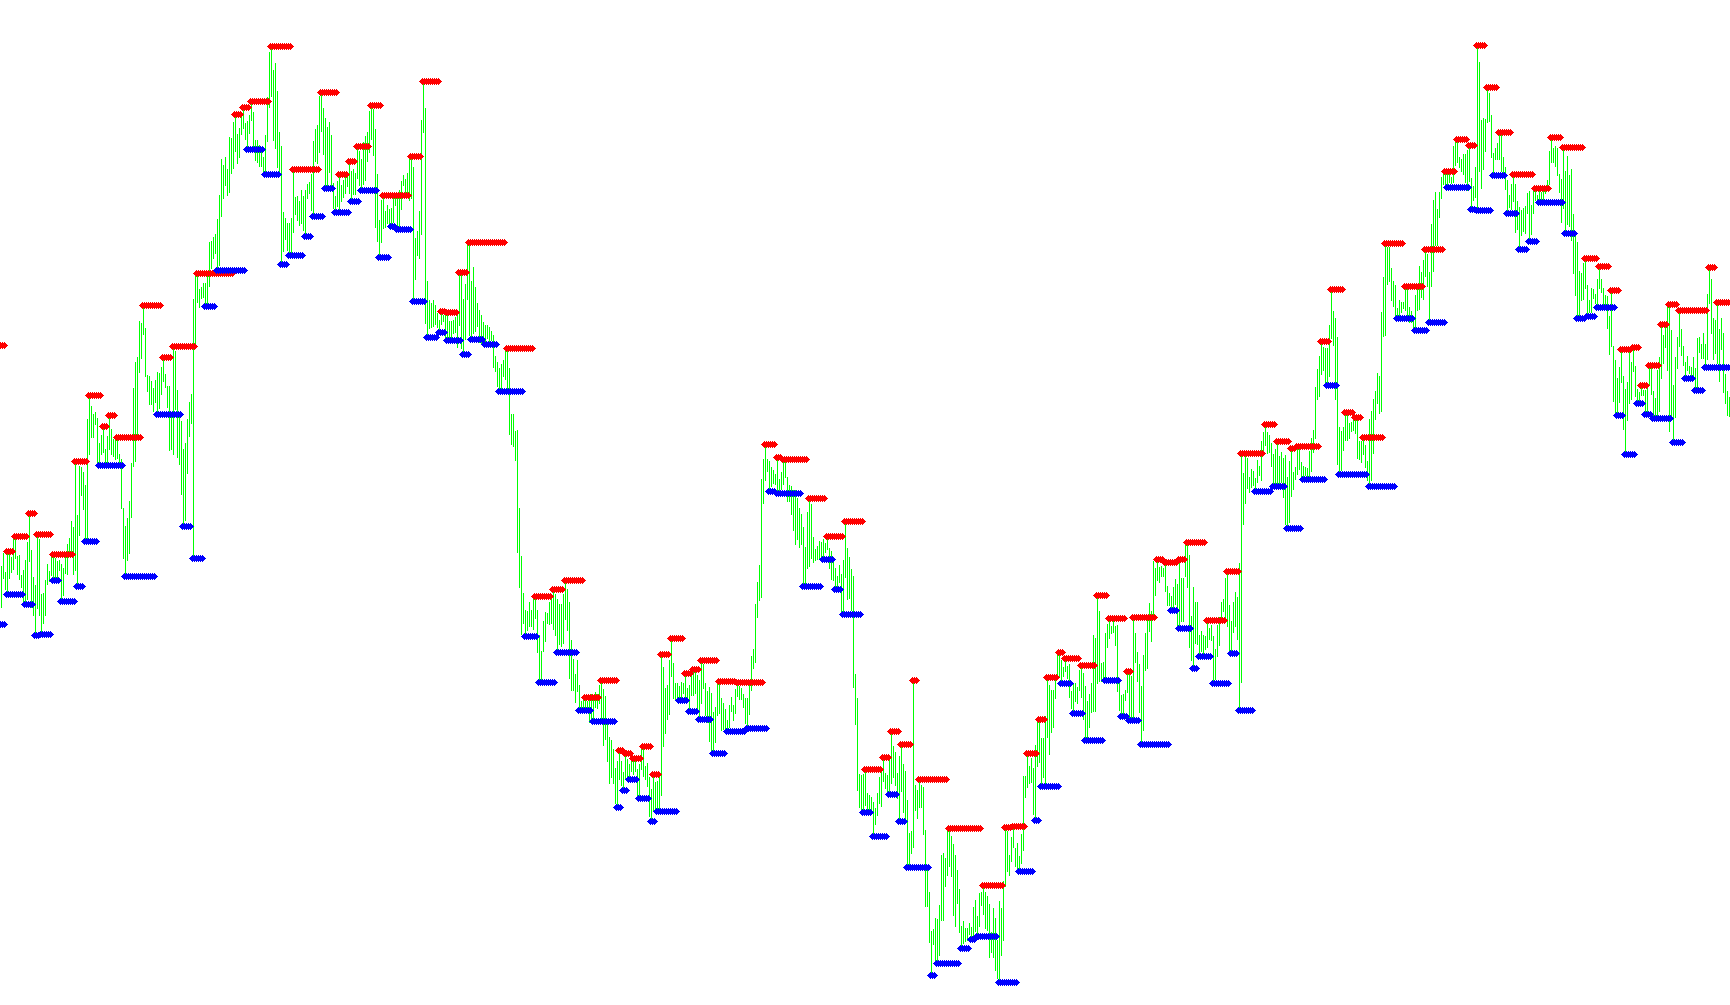
This tool is designed to help traders identify key structural levels on a financial chart—specifically, areas where the price has historically struggled to move above or below. It acts as a visual guide to map out "Support" and "Resistance" zones, which are essential components of technical analysis.
How it Works
The script functions by scanning historical price data to identify specific turning points in the market's movement. It looks for significant peaks and valleys (known technically as fractals) where the price reached a local high or low before reversing direction.
Instead of just marking every minor fluctuation, the logic focuses on these structural pivots:
- Resistance Levels: The script identifies previous "peaks." When the price hits these points in the past and drops back down, it marks them as potential ceilings. These are visualized as red markers on your chart.
- Support Levels: The script identifies previous "valleys." When the price hits these points and bounces back up, it marks them as potential floors. These are visualized as blue markers on your chart.
Key Behavior: Persistence of Levels
One of the most important features of this logic is its "memory" function. Rather than showing a single point in time, the script carries the value of a discovered peak or valley forward.
When a new resistance or support level is detected, the tool "locks" that price point and continues to display it across the chart until a new, significant turning point is formed. This creates a continuous horizontal visual reference, allowing you to see clearly where these boundaries currently sit relative to the live price action.
Summary for Traders
By transforming raw historical data into visible dots on your screen, this script simplifies the process of identifying "make or break" zones. It allows you to quickly see where the market has shown strength or weakness in the past, helping you decide where to potentially enter a trade or set your protective stop-loss orders.
//+------------------------------------------------------------------+
//|                Support and Resistance                            |
//|                Copyright © 2004  Barry Stander                   |
//|                http://myweb.absa.co.za/stander/4meta/            |
//+------------------------------------------------------------------+
#property copyright "Click here: Barry Stander"
#property link      "http://myweb.absa.co.za/stander/4meta/"

#property indicator_chart_window
#property indicator_buffers 2
#property indicator_color1 Red
#property indicator_color2 Blue

//---- buffers
double v1[];
double v2[];
double val1;
double val2;
int i;

int init()
  {

  IndicatorBuffers(2);

//---- drawing settings
 SetIndexArrow(0, 119);
 SetIndexArrow(1, 119);

   SetIndexStyle(0,DRAW_ARROW,STYLE_DOT,1,Red);
   SetIndexDrawBegin(0,i-1);
   SetIndexBuffer(0, v1);
   SetIndexLabel(0,"Resistance");


   SetIndexStyle(1,DRAW_ARROW,STYLE_DOT,1,Blue);
   SetIndexDrawBegin(1,i-1);
   SetIndexBuffer(1, v2);
   SetIndexLabel(1,"Support");

   return(0);
  }

int start()
  {

   i=Bars;
   while(i>=0)
     {

val1 = iFractals(NULL, 0, MODE_UPPER,i);
 if (val1 > 0)
   v1[i]=High[i];
    else
      v1[i] = v1[i+1];

val2 = iFractals(NULL, 0, MODE_LOWER,i);
 if (val2 > 0)
   v2[i]=Low[i];
      else
      v2[i] = v2[i+1];

      i--;
     }
   return(0);
  }

//+------------------------------------------------------------------+
Comments