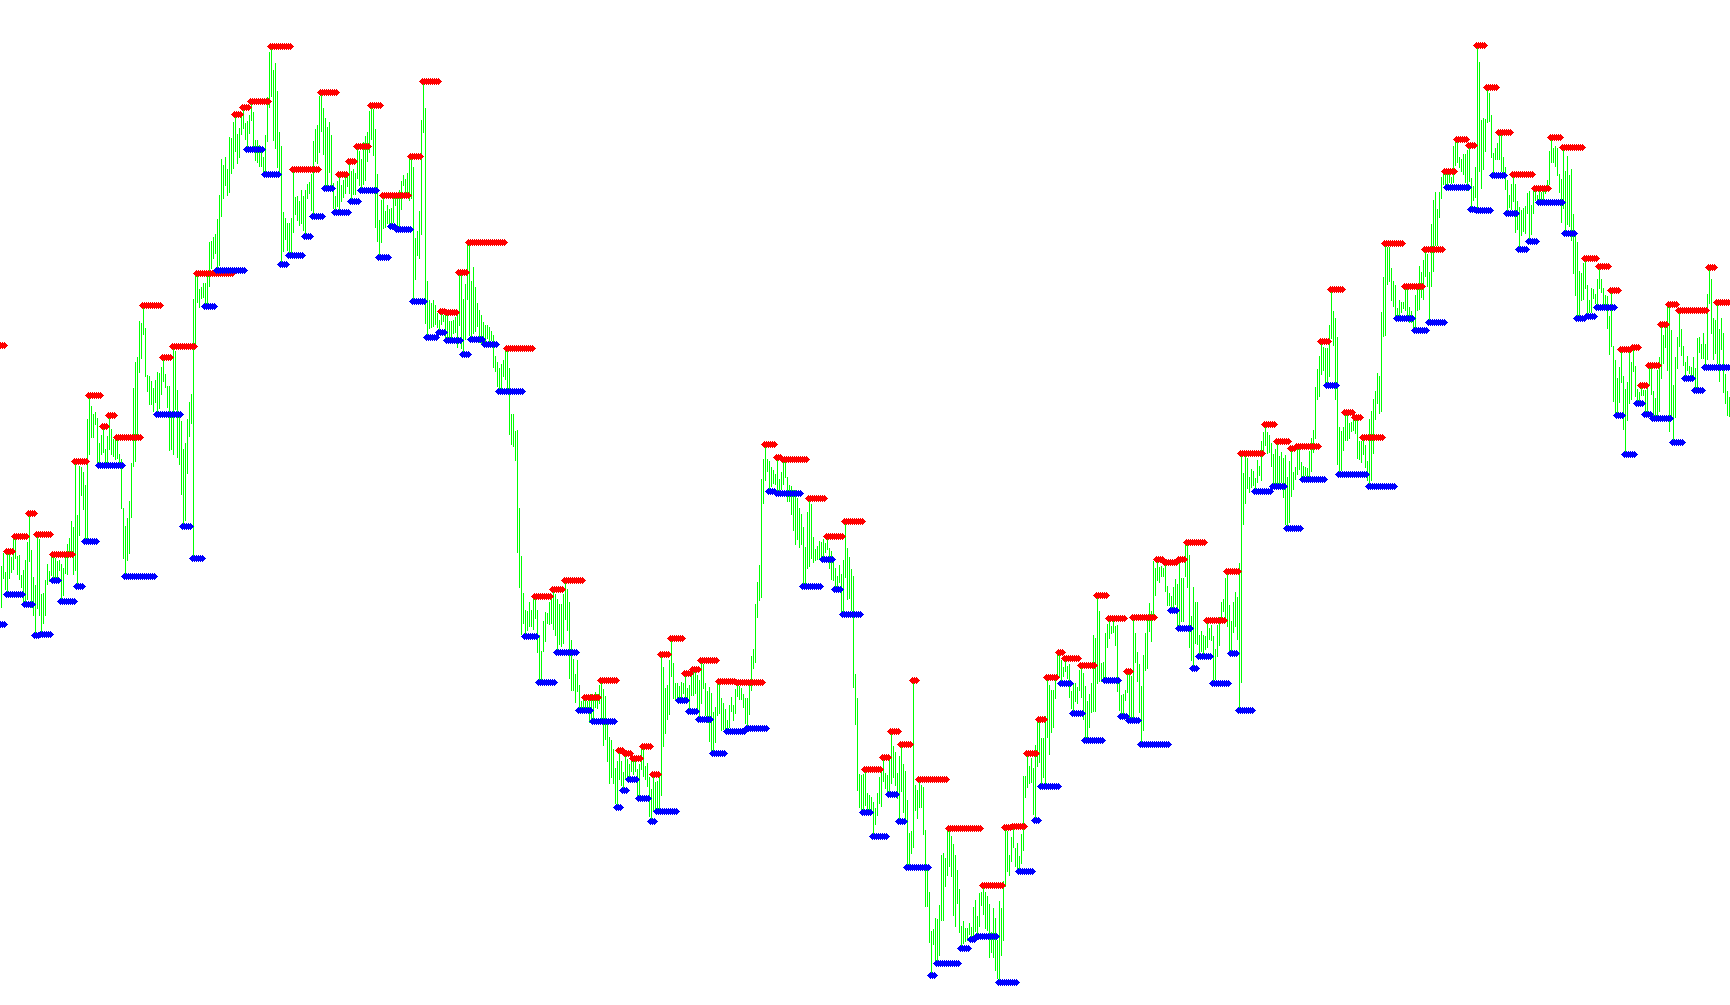
This tool is designed to automatically identify and display key price levels on your trading chart, specifically focusing on Support and Resistance zones. In trading, these are the "floors" and "ceilings" where price has historically struggled to move past, providing visual cues for potential reversals or trend continuations.
How it Works
The script analyzes historical price action by scanning for specific structural patterns known as "fractals." A fractal represents a point where the price reaches a local peak or valley relative to the candles surrounding it.
The logic operates in two distinct ways:
1. Identifying Resistance (The Ceilings) The tool searches for upward-pointing fractals. When the market hits a high point that stands out from its immediate neighbors, the script recognizes this as a potential resistance level. It marks these points in Red, signaling areas where selling pressure has historically been strongest.
2. Identifying Support (The Floors) Simultaneously, the tool scans for downward-pointing fractals. When the price drops to a low point that stands out from the surrounding price movement, the script identifies this as a support level. These are marked in Blue, highlighting areas where buying interest has historically stepped in to prevent further price declines.
Visual Presentation
Instead of drawing complex lines that might clutter your screen, the indicator places small dots directly on the chart at these critical price levels. This allows you to see exactly where the "turning points" occurred in the past.
Because the script is designed to carry these values forward, it helps maintain a clear visual history of these structural levels, making it easier for you to spot recurring price patterns and make more informed decisions on where the market might react next.
//+------------------------------------------------------------------+
//|                Support and Resistance                            |
//|                Copyright © 2004/5     Barry Stander              |
//|                http://www.4Africa.net/4meta/                     |
//+------------------------------------------------------------------+
#property copyright "Support and Resistance        Copyright © 2006 Barry Stander      Barry_Stander_4@yahoo.com"
#property link      "http://www.4Africa.net/4meta/"

string version = "Support and Resistance  Version 1.1  14/01/2006         Copyright © 2006 Barry Stander                      Barry_Stander_4@yahoo.com";


#property indicator_chart_window
#property indicator_buffers 2
#property indicator_color1 Red
#property indicator_color2 Blue

//---- buffers
double v1[];
double v2[];
double val1;
double val2;
int i;

int init()
  {
Comment( version );

  IndicatorBuffers(2);

   SetIndexArrow(0, 119);
   SetIndexStyle(0,DRAW_ARROW,STYLE_DOT,1,Red);
   SetIndexDrawBegin(0,i-1);
   SetIndexBuffer(0, v1);
   SetIndexLabel(0,"Resistance");

   SetIndexArrow(1, 119);
   SetIndexStyle(1,DRAW_ARROW,STYLE_DOT,1,Blue);


   SetIndexDrawBegin(1,i-1);
   SetIndexBuffer(1, v2);
   SetIndexLabel(1,"Support");

   return(0);
  }

int start()
  {
  Comment( version );
  i=Bars;
while(i>=0)
 {

   val1 = iFractals(NULL, 0, MODE_UPPER,i);
    if (val1 > 0)
     v1[i]=High[i];
    else
     v1[i] = v1[i+1];

   val2 = iFractals(NULL, 0, MODE_LOWER,i);
    if (val2 > 0)
     v2[i]=Low[i];
    else
     v2[i] = v2[i+1];

     i--;
 }

 return(0);
}

//+------------------------------------------------------------------+
Comments