Support_Resistance_RD 240m thin
Download script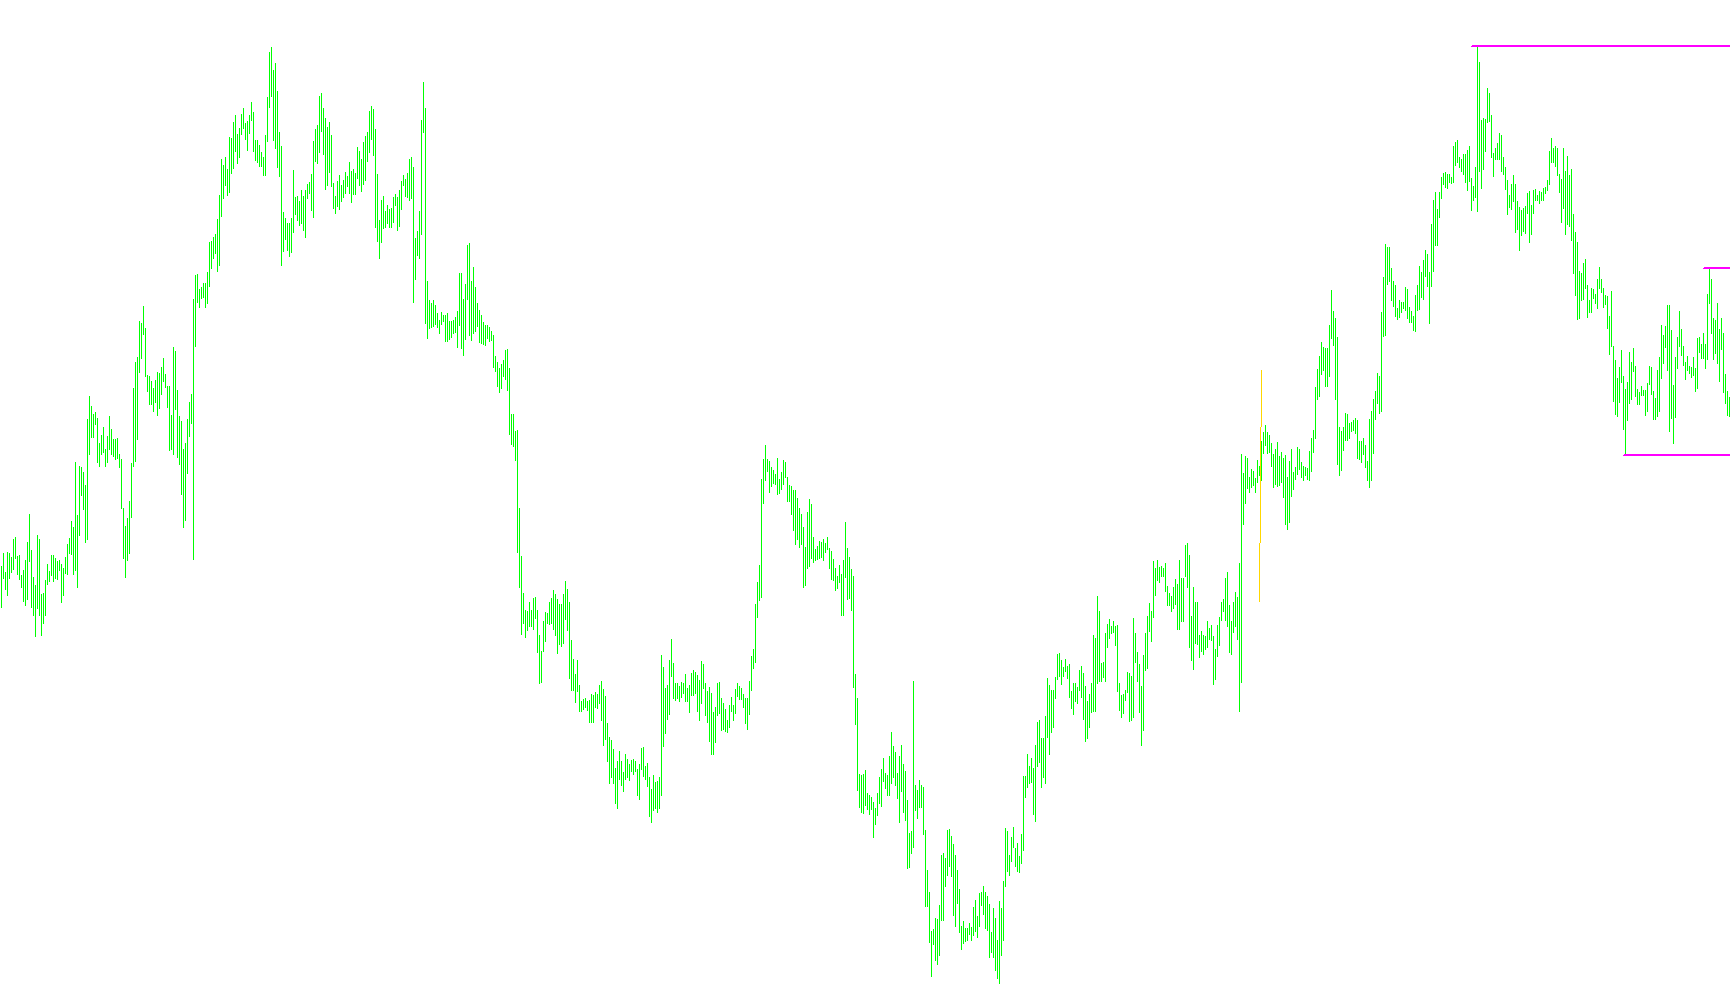
This script is designed as a visual analysis tool for traders who need to identify significant price levels—specifically Support and Resistance zones—across multiple timeframes. By automating the detection of these "pivot points," it helps traders visualize where the market has historically reacted to previous highs and lows.
Core Logic & Functionality
Multi-Timeframe Analysis The script allows you to monitor specific timeframes (such as 15 minutes, 1 hour, or daily charts) directly on your current view. It automatically adjusts its visual style, including colors and line thicknesses, based on the timeframe you select, making it easy to distinguish between short-term and long-term price structures at a glance.
Dynamic Support and Resistance Detection Instead of simply marking every peak and valley, the script uses a sophisticated filtering process:
- Swing Identification: It scans historical data to find "Local Highs" and "Local Lows."
- Depth & Deviation Filtering: You can customize how far back the script looks (Depth) and how much price movement is required to consider a point significant (Deviation). This prevents the chart from becoming cluttered with minor price fluctuations.
- Backstep Verification: The logic includes a "backstep" check, which ensures that a identified level is truly a peak or valley by verifying it against immediately adjacent bars.
Smart Level Management The script employs a "cleaning" logic to ensure the visual data remains actionable:
- Conflict Resolution: If two high points are detected very close to each other, the script identifies the most dominant one and ignores the weaker one.
- Dynamic Updating: It constantly compares new price actions against existing identified levels. If a new, higher high or lower low is formed that breaks the previous logic, the script updates the visual lines accordingly.
- Auto-Cleanup: To keep your workspace clean, the script includes a management system that deletes outdated objects and maintains only the most relevant levels based on your preferences.
Visual Presentation Once the logic identifies a valid support or resistance price:
- It creates a Trend Line extending from the historical point.
- The lines are set as Rays, meaning they extend into the future, allowing you to see where current price action might interact with these historical "walls."
- Each line is automatically color-coded based on your settings, providing a professional and organized layout of the market's structural boundaries.
Summary for the User
Essentially, this script acts as an automated "architect" for your charts. It scans past data to find where the market "stopped" or "reversed," draws those lines for you, filters out the "noise" of insignificant price movements, and keeps the chart organized so you can focus on potential entry and exit points.
//+------------------------------------------------------------------+
//|                                             SUPRESMultiFrame.mq4 |
//|                                                                  |
//|                                                            RD    |
//+------------------------------------------------------------------+
#property copyright "RD"
#property link      "marynarz15@wp.pl"
#define MaxObject    1000
#property indicator_chart_window
//---- indicator parameters
extern int TimeFrame=240;
extern int BarsMax=11;
extern int ExtDepth=13;
extern int ExtDeviation=1;
extern int ExtBackstep=5;
extern bool DeleteObjectsOnExit=true;
extern color LineColor1=RosyBrown;
extern color LineColor5=DarkTurquoise;
extern color LineColor15=DarkOrange;
extern color LineColor30=PaleVioletRed;
extern color LineColor60=Red;
extern color LineColor240=Magenta;
extern color LineColor1440=DarkViolet;
extern color LineColor10080=Teal;
//-----------------------
double ExtMapBuffer[];
double ExtMapBuffer2[];
int SUPRESCount=0;
int linewidth;
string NamePattern;
color LineColor;

//+------------------------------------------------------------------+
//| Custom indicator initialization function                         |
//+------------------------------------------------------------------+
int init()
  {
   IndicatorBuffers(2);
   SetIndexBuffer(0,ExtMapBuffer);
   SetIndexBuffer(1,ExtMapBuffer2);
   SetIndexEmptyValue(0,0.0);
   ArraySetAsSeries(ExtMapBuffer,true);
   ArraySetAsSeries(ExtMapBuffer2,true);
   switch (TimeFrame)
     {
        case 1: linewidth=2; LineColor=LineColor1; break;
        case 5: linewidth=2; LineColor=LineColor5; break;
        case 15: linewidth=2; LineColor=LineColor15; break;
        case 30: linewidth=2; LineColor=LineColor30; break;
        case 60: linewidth=2; LineColor=LineColor60; break;
        case 240: linewidth=2; LineColor=LineColor240; break;
        case 1440: linewidth=2; LineColor=LineColor1440; break;
        case 10080: linewidth=2; LineColor=LineColor10080; break;
        default: linewidth=2; TimeFrame=Period(); break;
     }
   NamePattern=DoubleToStr(TimeFrame,0)+" SUPRES ";
   if (BarsMax<55) BarsMax=55;

   ObjectsDeleteAll(0,OBJ_TREND);
   return(0);
  }

//+------------------------------------------------------------------+
//| Custom indicator deinitialization function                       |
//+------------------------------------------------------------------+
int deinit()
  {
      if (DeleteObjectsOnExit==true) ObjectsDeleteAll(0,OBJ_TREND);
      return(0);
  }

//+------------------------------------------------------------------+
//|                                                                  |
//+------------------------------------------------------------------+
int start()
  {
   int    shift, back,lasthighpos,lastlowpos;
   double val,res;
   double curlow,curhigh,lasthigh,lastlow;
   string objectname;

   if(BarsMax==0) {BarsMax=Bars/2;}// return(0);
   for(shift=iBars(NULL,TimeFrame)-ExtDepth; shift>=0; shift--)
     {
      val=iLow(NULL,TimeFrame,Lowest(NULL,TimeFrame,MODE_LOW,ExtDepth,shift));
      if(val==lastlow) val=0.0;
      else
        {
         lastlow=val;
         if((iLow(NULL,TimeFrame,shift)-val)>(ExtDeviation*Point)) val=0.0;
         else
           {
            for(back=1; back<=ExtBackstep; back++)
              {
               res=ExtMapBuffer[shift+back];
               if((res!=0)&&(res>val)) ExtMapBuffer[shift+back]=0.0;
              }
           }
        }
      ExtMapBuffer[shift]=val;
      //--- high
      val=iHigh(NULL,TimeFrame,Highest(NULL,TimeFrame,MODE_HIGH,ExtDepth,shift));
      if(val==lasthigh) val=0.0;
      else
        {
         lasthigh=val;
         if((val-iHigh(NULL,TimeFrame,shift))>(ExtDeviation*Point)) val=0.0;
         else
           {
            for(back=1; back<=ExtBackstep; back++)
              {
               res=ExtMapBuffer2[shift+back];
               if((res!=0)&&(res<val)) ExtMapBuffer2[shift+back]=0.0;
              }
           }
        }
      ExtMapBuffer2[shift]=val;
     }

   // final cutting
   lasthigh=-1; lasthighpos=-1;
   lastlow=-1;  lastlowpos=-1;

   for(shift=iBars(NULL,TimeFrame)-ExtDepth; shift>=0; shift--)
     {
      curlow=ExtMapBuffer[shift];
      curhigh=ExtMapBuffer2[shift];
      if((curlow==0)&&(curhigh==0)) continue;
      //---
      if(curhigh!=0)
        {
         if(lasthigh>0)
           {
            if(lasthigh<curhigh) ExtMapBuffer2[lasthighpos]=0;
            else ExtMapBuffer2[shift]=0;
           }
         //---
         if(lasthigh<curhigh || lasthigh<0)
           {
            lasthigh=curhigh;
            lasthighpos=shift;
           }
         lastlow=-1;
        }
      //----
      if(curlow!=0)
        {
         if(lastlow>0)
           {
            if(lastlow>curlow) ExtMapBuffer[lastlowpos]=0;
            else ExtMapBuffer[shift]=0;
           }
         //---
         if((curlow<lastlow)||(lastlow<0))
           {
            lastlow=curlow;
            lastlowpos=shift;
           }
         lasthigh=-1;
        }
     }

   for(shift=iBars(NULL,TimeFrame)-1; shift>=0; shift--)
     {
      if(shift>=iBars(NULL,TimeFrame)-ExtDepth) ExtMapBuffer[shift]=0.0;
      else
        {
         res=ExtMapBuffer2[shift];
         if(res!=0.0) ExtMapBuffer[shift]=res;
        }
     }
 ///////////////////////// Lines creation /////////////////
   int count=0;
   double TempBufferPrice[MaxObject];
   int TempBufferBar[MaxObject];
   string ObjectNames[MaxObject];
 //////////////////////// lists of lines //////////////////
   for(shift=BarsMax; shift>0; shift--)
       if (ExtMapBuffer[shift]>0)
         {
            count++;
            TempBufferPrice[count-1]=ExtMapBuffer[shift];
            TempBufferBar[count-1]=shift;
         }
   for(int i=0; i<count; i++)
         ObjectNames[i]=/*TimeFrame+"m S/R("+i+")"+DoubleToStr(TempBufferPrice[i],Digits)+" "+*/
                        TimeToStr(iTime(NULL,TimeFrame,TempBufferBar[i]),TIME_DATE|TIME_MINUTES);

 /////// deleting pending objects ///////////////
   int ObjectForDeleteCount=0;
   string ObjectsForDelete[MaxObject];
   for(i=0; i<ObjectsTotal(); i++)
      {
         objectname=ObjectName(i);
         if (StringSubstr(objectname,0,StringLen(NamePattern))==NamePattern)
            {
               ObjectForDeleteCount++;
               ObjectsForDelete[ObjectForDeleteCount-1]=objectname;
            }
      }
   for(i=0; i<count-2; i++)
      {
         objectname=ObjectNames[i];
            for(int j=0; j<ObjectForDeleteCount; j++)
                 if(ObjectsForDelete[j]==objectname)
                  {
                      ObjectsForDelete[j]="";
                      break;
                  }
      }
   for(j=0; j<ObjectForDeleteCount; j++)
      if (ObjectsForDelete[j]!="")
      {
         ObjectDelete(ObjectsForDelete[j]);
      }
 ////////////// objects plotting /////////////////
   for(i=0; i<count; i++)
      {
         if (ObjectFind(ObjectNames[i])==-1)
            {
                ObjectCreate(ObjectNames[i],OBJ_TREND,0,iTime(NULL,TimeFrame,TempBufferBar[i]),TempBufferPrice[i],
                                 iTime(NULL,TimeFrame,TempBufferBar[i])+10080*60,TempBufferPrice[i]);
                ObjectSet(ObjectNames[i],OBJPROP_WIDTH,linewidth);
                ObjectSet(ObjectNames[i],OBJPROP_COLOR,LineColor);
                ObjectSet(ObjectNames[i],OBJPROP_RAY,true);
            }
      }
}
Comments