Support_Resistance_v1
Download script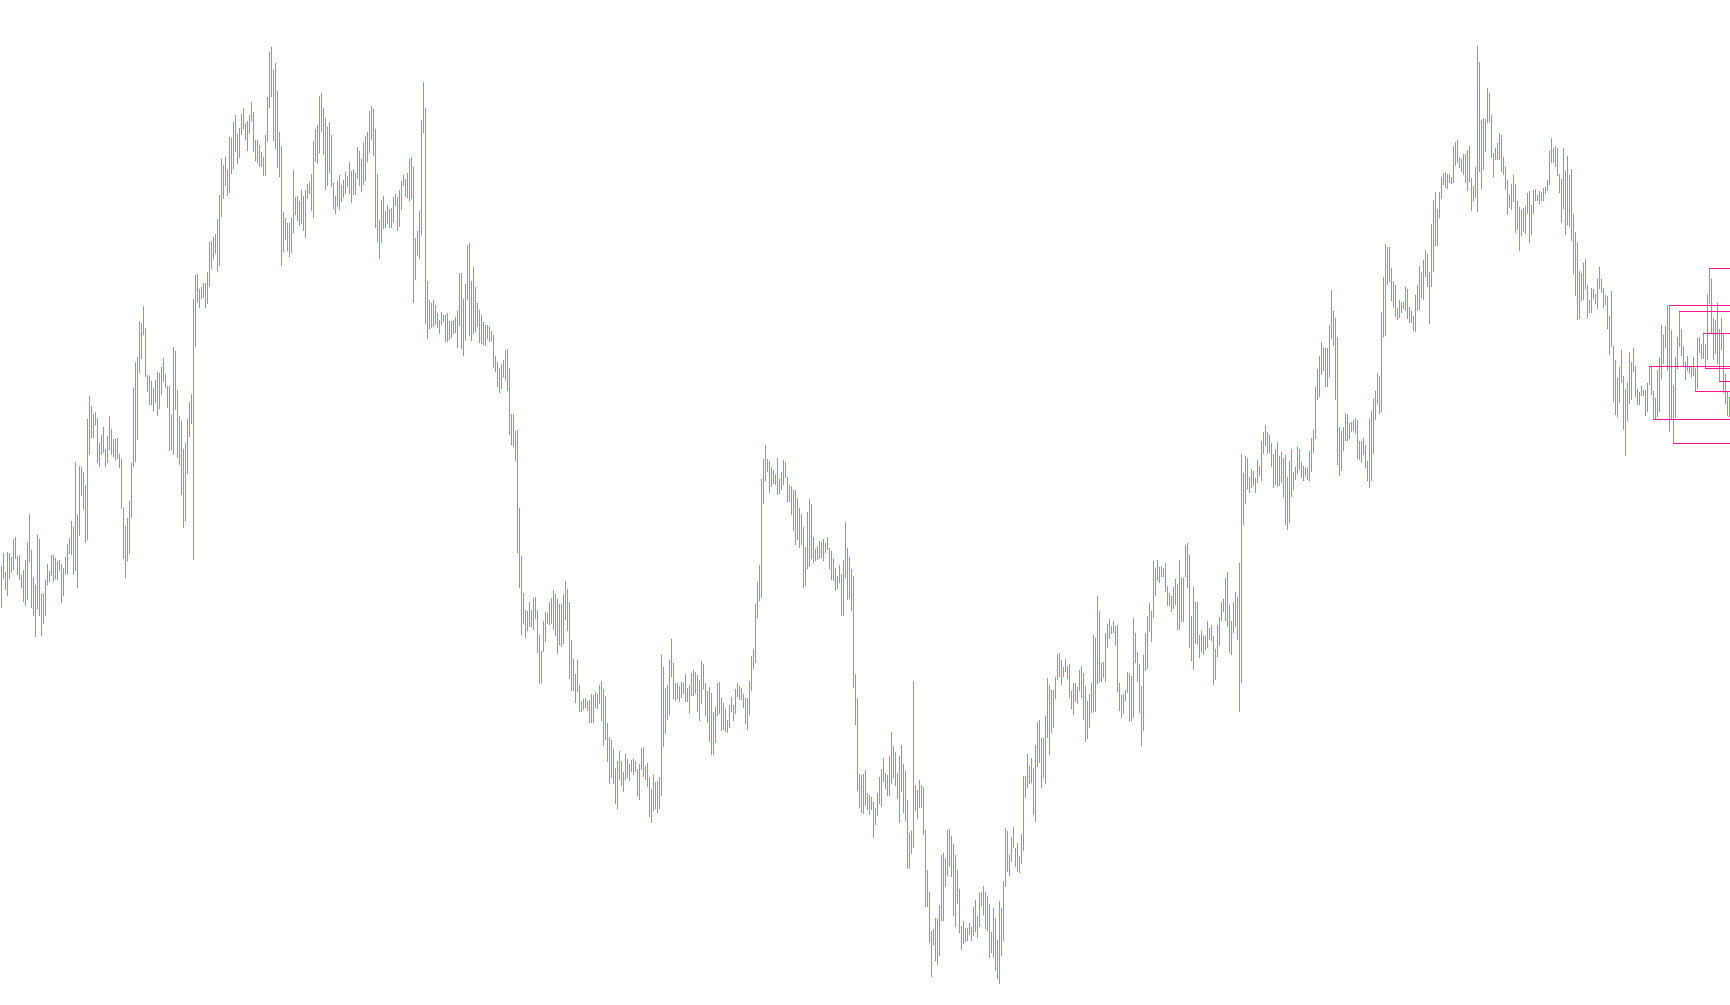
This script is designed to automatically identify and display significant Support and Resistance (S/R) levels on your trading charts. Instead of relying on manual drawing, the logic systematically scans historical price data to highlight areas where the market has historically reacted or "bounced," providing a visual map of key supply and demand zones.
Core Logic Overview
The script operates through a multi-step process to filter out market "noise" and focus only on meaningful price levels:
1. Multi-Timeframe Scanning The tool is capable of looking at different timeframes (e.g., 15 minutes, 1 hour, etc.). It identifies high and low points within these specific windows to determine where the market has established structural boundaries. Each timeframe is assigned a unique color, allowing you to distinguish between short-term and long-term price levels at a glance.
2. Identifying Peaks and Troughs The logic looks back over a defined number of bars (depth) to find the highest highs and lowest lows. However, it doesn't just pick every peak; it uses specific filters:
- Deviation Check: It ensures the price move is significant enough to be considered a true turning point rather than minor fluctuation.
- Backstep Verification: It double-checks preceding bars to ensure the identified level is a distinct "peak" or "valley."
3. Conflict Resolution and Filtering One of the most sophisticated parts of this script is how it handles overlapping levels. If multiple price points are found very close to each other, the logic "cleans" the data:
- Dominance Logic: It compares nearby highs and lows. If a newer, higher peak is found that "overrides" a previous one, the script prioritizes the stronger level.
- Redundancy Removal: It eliminates duplicate levels to keep your chart clean, ensuring that only the most prominent support and resistance lines remain visible.
4. Dynamic Visual Mapping Once the significant levels are calculated, the script automatically draws them on your chart as trend lines.
- Automatic Cleanup: The script is designed to be tidy. It can automatically delete old objects when they are no longer relevant or when you close the indicator, preventing your chart from becoming cluttered with "ghost" lines.
- Ray Projection: The lines are projected forward (using a ray effect), allowing you to see how current price action interacts with these historical zones in real-time.
Summary for the Trader
Essentially, this script acts as an automated technical analyst. It looks back at the history of a specific timeframe, identifies where the "walls" of price action are located based on mathematical highs and lows, filters out the minor movements, and draws clear, color-coded lines to show you exactly where the market is likely to encounter resistance or find support.
/*-----------------------------+
|			       |
| Shared by www.Aptrafx.com    |
|			       |
+------------------------------*/

//+------------------------------------------------------------------+
//|                                             SUPRESMultiFrame.mq4 |
//|                                                                  |
//|                                                            RD    |
//+------------------------------------------------------------------+
#property copyright "RD"
#property link      "marynarz15@wp.pl"
#property indicator_chart_window
#define MaxObject    1000
//---- indicator parameters
extern int TimeFrame=15;
extern int BarsMax=144;
extern int ExtDepth=13;
extern int ExtDeviation=1;
extern int ExtBackstep=5;
extern bool DeleteObjectsOnExit=true;
extern color LineColor1=RosyBrown;
extern color LineColor5=Aqua;
extern color LineColor15=DeepPink;
extern color LineColor30=PaleVioletRed;
extern color LineColor60=Red;
extern color LineColor240=DarkOrange;
extern color LineColor1440=DeepSkyBlue;
extern color LineColor10080=Lime;
//-----------------------
double ExtMapBuffer[];
double ExtMapBuffer2[];
int SUPRESCount=0;
int linewidth;
string NamePattern;
color LineColor;


//+------------------------------------------------------------------+
//|                           Delete objects                         |
//+------------------------------------------------------------------+
int DeleteSupRes()
   {
      int ObjectCount=ObjectsTotal();
      string names[MaxObject];
      for (int i=0; i<ObjectCount;i++)
         names[i]=ObjectName(i);
      for (i=0; i<ObjectCount;i++)
      {
         string objname=names[i];
         objname=StringSubstr(objname,0,StringLen(NamePattern));
         if (objname!=NamePattern || ObjectType(names[i])!=OBJ_TREND)
               names[i]="";
      }
      for (i=0; i<ObjectCount;i++)
      {
         if (names[i]!="") {
         ObjectDelete(names[i]);}
      }
      return(0);
   }

//+------------------------------------------------------------------+
//| Custom indicator initialization function                         |
//+------------------------------------------------------------------+
int init()
  {
   IndicatorBuffers(2);
   SetIndexBuffer(0,ExtMapBuffer);
   SetIndexBuffer(1,ExtMapBuffer2);
   SetIndexEmptyValue(0,0.0);
   ArraySetAsSeries(ExtMapBuffer,true);
   ArraySetAsSeries(ExtMapBuffer2,true);
   switch (TimeFrame)
     {
        case 1: linewidth=1; LineColor=LineColor1; break;
        case 5: linewidth=1; LineColor=LineColor5; break;
        case 15: linewidth=1; LineColor=LineColor15; break;
        case 30: linewidth=1; LineColor=LineColor30; break;
        case 60: linewidth=1; LineColor=LineColor60; break;
        case 240: linewidth=1; LineColor=LineColor240; break;
        case 1440: linewidth=1; LineColor=LineColor1440; break;
        case 10080: linewidth=1; LineColor=LineColor10080; break;
        default: linewidth=1; TimeFrame=Period(); break;
     }
   NamePattern=DoubleToStr(TimeFrame,0)+" SUPRES ";
   if (BarsMax<55) BarsMax=55;

   DeleteSupRes();
   return(0);
  }

//+------------------------------------------------------------------+
//| Custom indicator deinitialization function                       |
//+------------------------------------------------------------------+
int deinit()
  {
      if (DeleteObjectsOnExit) DeleteSupRes();
      return(0);
  }

//+------------------------------------------------------------------+
//|                                                                  |
//+------------------------------------------------------------------+
int start()
  {
   int    shift, back,lasthighpos,lastlowpos;
   double val,res;
   double curlow,curhigh,lasthigh,lastlow;
   string objectname;

   if(BarsMax==0) {BarsMax=Bars/2;}// return(0);
   for(shift=iBars(NULL,TimeFrame)-ExtDepth; shift>=0; shift--)
     {
      val=iLow(NULL,TimeFrame,Lowest(NULL,TimeFrame,MODE_LOW,ExtDepth,shift));
      if(val==lastlow) val=0.0;
      else
        {
         lastlow=val;
         if((iLow(NULL,TimeFrame,shift)-val)>(ExtDeviation*Point)) val=0.0;
         else
           {
            for(back=1; back<=ExtBackstep; back++)
              {
               res=ExtMapBuffer[shift+back];
               if((res!=0)&&(res>val)) ExtMapBuffer[shift+back]=0.0;
              }
           }
        }
      ExtMapBuffer[shift]=val;
      //--- high
      val=iHigh(NULL,TimeFrame,Highest(NULL,TimeFrame,MODE_HIGH,ExtDepth,shift));
      if(val==lasthigh) val=0.0;
      else
        {
         lasthigh=val;
         if((val-iHigh(NULL,TimeFrame,shift))>(ExtDeviation*Point)) val=0.0;
         else
           {
            for(back=1; back<=ExtBackstep; back++)
              {
               res=ExtMapBuffer2[shift+back];
               if((res!=0)&&(res<val)) ExtMapBuffer2[shift+back]=0.0;
              }
           }
        }
      ExtMapBuffer2[shift]=val;
     }

   // final cutting
   lasthigh=-1; lasthighpos=-1;
   lastlow=-1;  lastlowpos=-1;

   for(shift=iBars(NULL,TimeFrame)-ExtDepth; shift>=0; shift--)
     {
      curlow=ExtMapBuffer[shift];
      curhigh=ExtMapBuffer2[shift];
      if((curlow==0)&&(curhigh==0)) continue;
      //---
      if(curhigh!=0)
        {
         if(lasthigh>0)
           {
            if(lasthigh<curhigh) ExtMapBuffer2[lasthighpos]=0;
            else ExtMapBuffer2[shift]=0;
           }
         //---
         if(lasthigh<curhigh || lasthigh<0)
           {
            lasthigh=curhigh;
            lasthighpos=shift;
           }
         lastlow=-1;
        }
      //----
      if(curlow!=0)
        {
         if(lastlow>0)
           {
            if(lastlow>curlow) ExtMapBuffer[lastlowpos]=0;
            else ExtMapBuffer[shift]=0;
           }
         //---
         if((curlow<lastlow)||(lastlow<0))
           {
            lastlow=curlow;
            lastlowpos=shift;
           }
         lasthigh=-1;
        }
     }

   for(shift=iBars(NULL,TimeFrame)-1; shift>=0; shift--)
     {
      if(shift>=iBars(NULL,TimeFrame)-ExtDepth) ExtMapBuffer[shift]=0.0;
      else
        {
         res=ExtMapBuffer2[shift];
         if(res!=0.0) ExtMapBuffer[shift]=res;
        }
     }
 ///////////////////////// Lines creation /////////////////
   int count=0;
   double TempBufferPrice[MaxObject];
   int TempBufferBar[MaxObject];
   string ObjectNames[MaxObject];
 //////////////////////// lists of lines //////////////////
   for(shift=BarsMax; shift>0; shift--)
       if (ExtMapBuffer[shift]>0)
         {
            count++;
            TempBufferPrice[count-1]=ExtMapBuffer[shift];
            TempBufferBar[count-1]=shift;
         }
   for(int i=0; i<count; i++)
         ObjectNames[i]=/*TimeFrame+"m S/R("+i+")"+DoubleToStr(TempBufferPrice[i],Digits)+" "+*/
                        TimeToStr(iTime(NULL,TimeFrame,TempBufferBar[i]),TIME_DATE|TIME_MINUTES);

 /////// deleting pending objects ///////////////
   int ObjectForDeleteCount=0;
   string ObjectsForDelete[MaxObject];
   for(i=0; i<ObjectsTotal(); i++)
      {
         objectname=ObjectName(i);
         if (StringSubstr(objectname,0,StringLen(NamePattern))==NamePattern)
            {
               ObjectForDeleteCount++;
               ObjectsForDelete[ObjectForDeleteCount-1]=objectname;
            }
      }
   for(i=0; i<count-2; i++)
      {
         objectname=ObjectNames[i];
            for(int j=0; j<ObjectForDeleteCount; j++)
                 if(ObjectsForDelete[j]==objectname)
                  {
                      ObjectsForDelete[j]="";
                      break;
                  }
      }
   for(j=0; j<ObjectForDeleteCount; j++)
      if (ObjectsForDelete[j]!="")
      {
         ObjectDelete(ObjectsForDelete[j]);
      }
 ////////////// objects plotting /////////////////
   for(i=0; i<count; i++)
      {
         if (ObjectFind(ObjectNames[i])==-1)
            {
                ObjectCreate(ObjectNames[i],OBJ_TREND,0,iTime(NULL,TimeFrame,TempBufferBar[i]),TempBufferPrice[i],
                                 iTime(NULL,TimeFrame,TempBufferBar[i])+10080*60,TempBufferPrice[i]);
                ObjectSet(ObjectNames[i],OBJPROP_WIDTH,linewidth);
                ObjectSet(ObjectNames[i],OBJPROP_COLOR,LineColor);
                ObjectSet(ObjectNames[i],OBJPROP_RAY,True);
                ObjectSetText(ObjectNames[i],ObjectNames[i]/*+" "+DoubleToStr(TempBufferPrice[i],Digits),8,"Courier",LightSteelBlue*/);
            }
      }
}
Comments