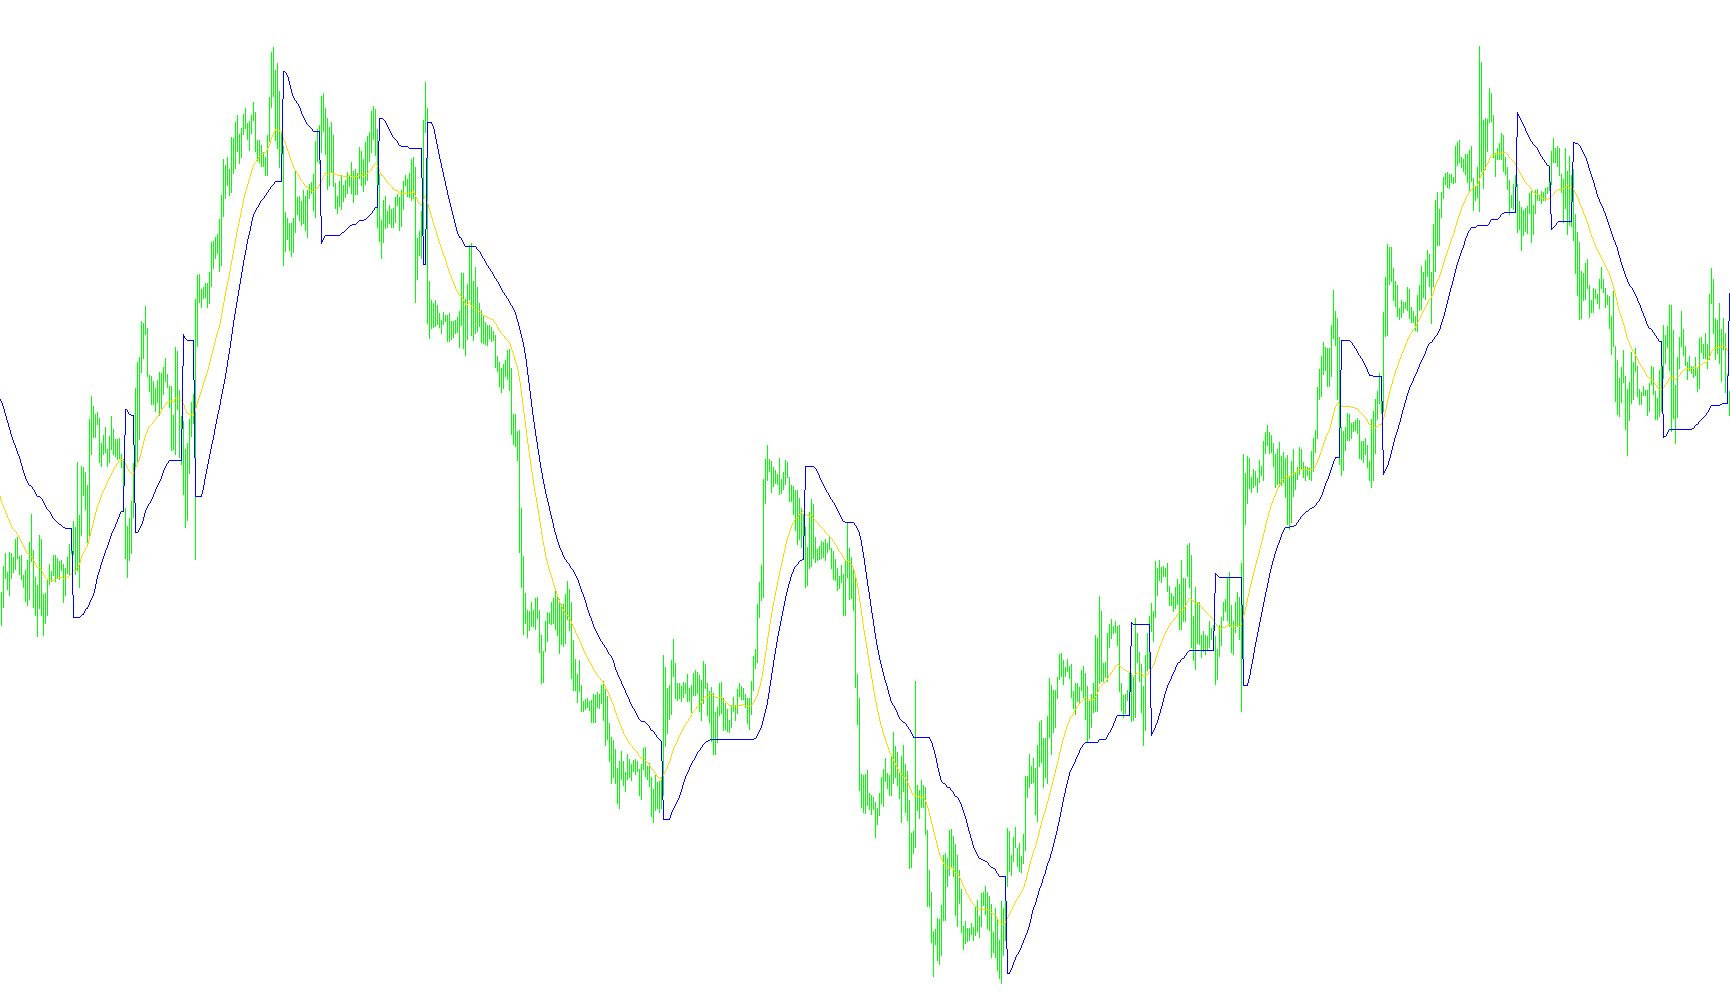
SuperSR 6_v2
Indicator

SuperSR 6_v2

Identifies significant price pivot points by detecting local extrema that maintain a minimum contractual distance from previous structural levels.

SuperSR7
Indicator

SuperSR7

Identifies significant structural levels by detecting local extrema that exceed a specific price interval relative to the preceding established pivot.

SuperSR8
Indicator

SuperSR8

This indicator identifies dynamic supply and demand zones by tracking high-low fractal points that exceed a specific volatility threshold from previous levels.

Supertrend Audible Alert
Indicator

Supertrend Audible Alert

iCCIiATR

This indicator identifies trend reversals by monitoring CCI crossovers against a trailing volatility buffer calculated using ATR offsets.

Supertrend Audible Alert_v1
Indicator

Supertrend Audible Alert_v1

iCCIiATR

This indicator identifies directional shifts by monitoring CCI momentum crossovers relative to a static threshold while dynamically establishing trailing trend boundaries using ATR-based volatility offsets.

SuperTrend Candles_source
Indicator

SuperTrend Candles_source

This indicator dynamically maps SuperTrend volatility boundaries onto price action to re-color candles based on dominant momentum shifts.

SuperTrend nrp new MTF
Indicator

SuperTrend nrp new MTF

iATRiMA

This indicator identifies structural market direction by calculating a trailing volatility band based on the product of Average True Range and a user-defined multiplier applied to the median price.

SuperTrend nrp new
Indicator

SuperTrend nrp new

iATRiMA

This indicator identifies prevailing market momentum by calculating a trailing boundary based on the product of price midpoint and Average True Range, while filtering out false breakouts through recursive directionality checks.

SuperTrend volty like
Indicator

SuperTrend volty like

iATRiMA

This indicator identifies market bias by dynamically adjusting trailing support and resistance levels based on ATR-weighted price volatility.

Indicator

SuperTrend-2

iATR
Indicator

SuperTrend-2_001

iATR
SuperTrend
Indicator

SuperTrend

iATR

This indicator identifies trend shifts by calculating a dynamic trailing stop based on a multiplier of the Average True Range relative to the median price.

Supertrend1
Indicator

Supertrend1

iCCIiATR

This indicator identifies trend direction by cross-referencing CCI momentum shifts with price action adjusted by ATR volatility buffers to create trailing support and resistance levels.

Supertrend1_v1
Indicator

Supertrend1_v1

iCCIiATR

This indicator identifies directional momentum by cross-referencing a Commodity Channel Index (CCI) threshold with volatility-adjusted Average True Range (ATR) trailing stops.

SuperTrendBars
Indicator

SuperTrendBars

iATR

This indicator identifies market direction by monitoring price breakouts relative to an ATR-based volatility envelope anchored to the median bar price.

SupertrendLX
Indicator

SupertrendLX

iCCIiATR

This indicator identifies directional shifts by monitoring CCI crossovers against a threshold while smoothing the trend boundaries using an ATR-based trailing stop mechanism.

SuperTrend_001
Indicator

SuperTrend_001

iATR

This indicator identifies momentum shifts by calculating a volatility-adjusted baseline using Average True Range and price medianity to plot non-repainting trend boundaries.

SuperTrend_002
Indicator

SuperTrend_002

iMAOnArray

This indicator identifies market direction by calculating a trailing stop level based on the weighted average of price volatility and multiple moving average types.

Supertrend_003
Indicator

Supertrend_003

iCCIiATR

This indicator identifies trend shifts by monitoring Commodity Channel Index (CCI) crossovers while dynamically adjusting support and resistance levels using Average True Range (ATR) volatility filters.

SuperTrend_004
Indicator

SuperTrend_004

iATR

This indicator identifies market momentum by calculating a trailing volatility band based on the Average True Range and median price to detect structural trend shifts.

Indicator

SuperTrend_005

iCCIiATR
SuperTrend_3
Indicator

SuperTrend_3

iATRiMA

This indicator identifies market direction by comparing smoothed Simple Moving Averages and projects volatility-adjusted support and resistance bands using Average True Range.

SuperTrend_32
Indicator

SuperTrend_32

iATRiMA

This indicator identifies market direction by comparing dual Exponential Moving Averages and establishing dynamic support/resistance levels based on Average True Range volatility.

SuperTrend_32_001
Indicator

SuperTrend_32_001

iATRiMA

This indicator identifies directional shifts by comparing two exponentially smoothed moving averages and projects a trailing boundary based on average true range volatility.

Indicator

SuperTrend_Clean_mtf

iCCIiATR
Indicator

SuperTrend_Clean_mtf_001

iCCIiATR
Supertrend_jr
Indicator

Supertrend_jr

iCCI

This indicator utilizes the Commodity Channel Index (CCI) to identify dynamic trend reversals while applying time-sensitive price offsets to maintain structural integrity across various temporal resolutions.

Indicator

SuperTrend_TRO_MODIFIED_VERSION

iATR
Supertrend_v1
Indicator

Supertrend_v1

iCCIiATR

This indicator identifies trend reversals by monitoring Commodity Channel Index (CCI) crossovers relative to a dynamic price floor and ceiling established using Average True Range (ATR) volatility buffers.

Supertrend_v2
Indicator

Supertrend_v2

iCCIiATR

This indicator identifies trend reversals by monitoring CCI crossovers relative to a dynamic threshold while projecting price boundaries using ATR-based volatility adjustments.

SuperWoodieCCI
Indicator

SuperWoodieCCI

iCCI

This indicator filters Commodity Channel Index values into distinct visual histograms by verifying sustained multi-bar polarity shifts to identify dominant directional momentum.

SuperWoodieCCI1
Indicator

SuperWoodieCCI1

iCCI

This indicator identifies directional momentum by evaluating sustained positive or negative Commodity Channel Index values over a multi-bar lookback period to visualize long, short, and neutral trends.

SuperWoodieCCI_v1
Indicator

SuperWoodieCCI_v1

iCCI

This indicator visualizes directional momentum by identifying sustained positive or negative CCI values over a consecutive six-bar window to highlight dominant market trends.

SuperWoodieCCI_v2
Indicator

SuperWoodieCCI_v2

iCCI

This indicator evaluates price momentum by comparing multi-period Commodity Channel Index values against a 6-bar rolling directional threshold to visualize sustained trend shifts.

SuperWoodieCCI_v3
Indicator

SuperWoodieCCI_v3

iCCI

This indicator visualizes momentum by evaluating consecutive Commodity Channel Index values to dynamically differentiate between sustained bullish trends, bearish phases, and neutral equilibrium.

SuperWoodieCCI_v4
Indicator

SuperWoodieCCI_v4

iCCI

This indicator identifies sustained directional momentum by analyzing sequential positive and negative Commodity Channel Index values to highlight persistent bullish and bearish trend phases.

Super_Indicator_v2
Indicator

Super_Indicator_v2

Identifies localized price ceilings and floors by detecting the absolute highest highs and lowest lows within a fixed sliding window.

super_signals-mod
Indicator

super_signals-mod

iATR

Identifies potential buy/sell signals based on price breakouts above/below channels calculated using Average True Range (ATR) and historical high/low prices within specified lookback periods, triggering alerts on new signals.

super_signals_v2_Alert
Indicator

super_signals_v2_Alert

Identifies local price extrema by detecting swing highs and lows within a rolling lookback window to trigger directional reversal alerts.

super_signals_v2_Alert_v1
Indicator

super_signals_v2_Alert_v1

This indicator identifies local price peaks and valleys by detecting the highest high and lowest low within a fixed relative lookback window to generate directional trade alerts.

super_signals_v3
Indicator

super_signals_v3

iATR

This indicator identifies structural price reversals by detecting multi-period high and low extremes relative to ATR-based volatility expansion.

SUPER_TREND 2
Indicator

SUPER_TREND 2

iCCI

This indicator identifies structural market shifts by blending CCI momentum thresholds with dynamic price offsets and timeframe-specific smoothing.

SUPER_TREND 2_v1
Indicator

SUPER_TREND 2_v1

iCCI

This indicator identifies market direction by dynamically adjusting Commodity Channel Index (CCI) periods across timeframes and plotting trailing support and resistance lines based on momentum-driven price breakthroughs.

SUPER_TREND%202
Indicator

SUPER_TREND%202

iCCI

This indicator identifies directional momentum by combining a dynamic Commodity Channel Index (CCI) threshold with price action logic to filter trend reversals and noise.

Super_Trend
Indicator

Super_Trend

iCCI

This indicator identifies directional momentum by merging Commodity Channel Index (CCI) threshold crossovers with dynamic price action trailing based on timeframe-specific volatility shifts.

Super_Trend2
Indicator

Super_Trend2

iATR

This indicator identifies directional shifts by comparing dual-period median price averages and dynamically calculating volatility-adjusted trend boundaries using ATR offsets.

Super_Trend2_v1
Indicator

Super_Trend2_v1

iATR

This indicator identifies directional momentum by comparing moving averages of price action while dynamically adjusting trailing support and resistance levels based on Average True Range volatility.

Super_Trend2_v2
Indicator

Super_Trend2_v2

iATR

This indicator identifies directional momentum by comparing multi-period moving averages of median prices and plotting dynamic volatility-adjusted support and resistance levels.

Super_Trend_v1
Indicator

Super_Trend_v1

iCCI

This indicator identifies directional momentum by utilizing CCI-based threshold crossovers combined with dynamic price action filters to plot trailing trend boundaries.

Support & Resistance
Indicator

Support & Resistance

iFractals

This indicator dynamically maps structural price boundaries by propagating historical fractal extremes into continuous visual supply and demand zones.