Support and Resistance WITH FIBONACCI LA
Download script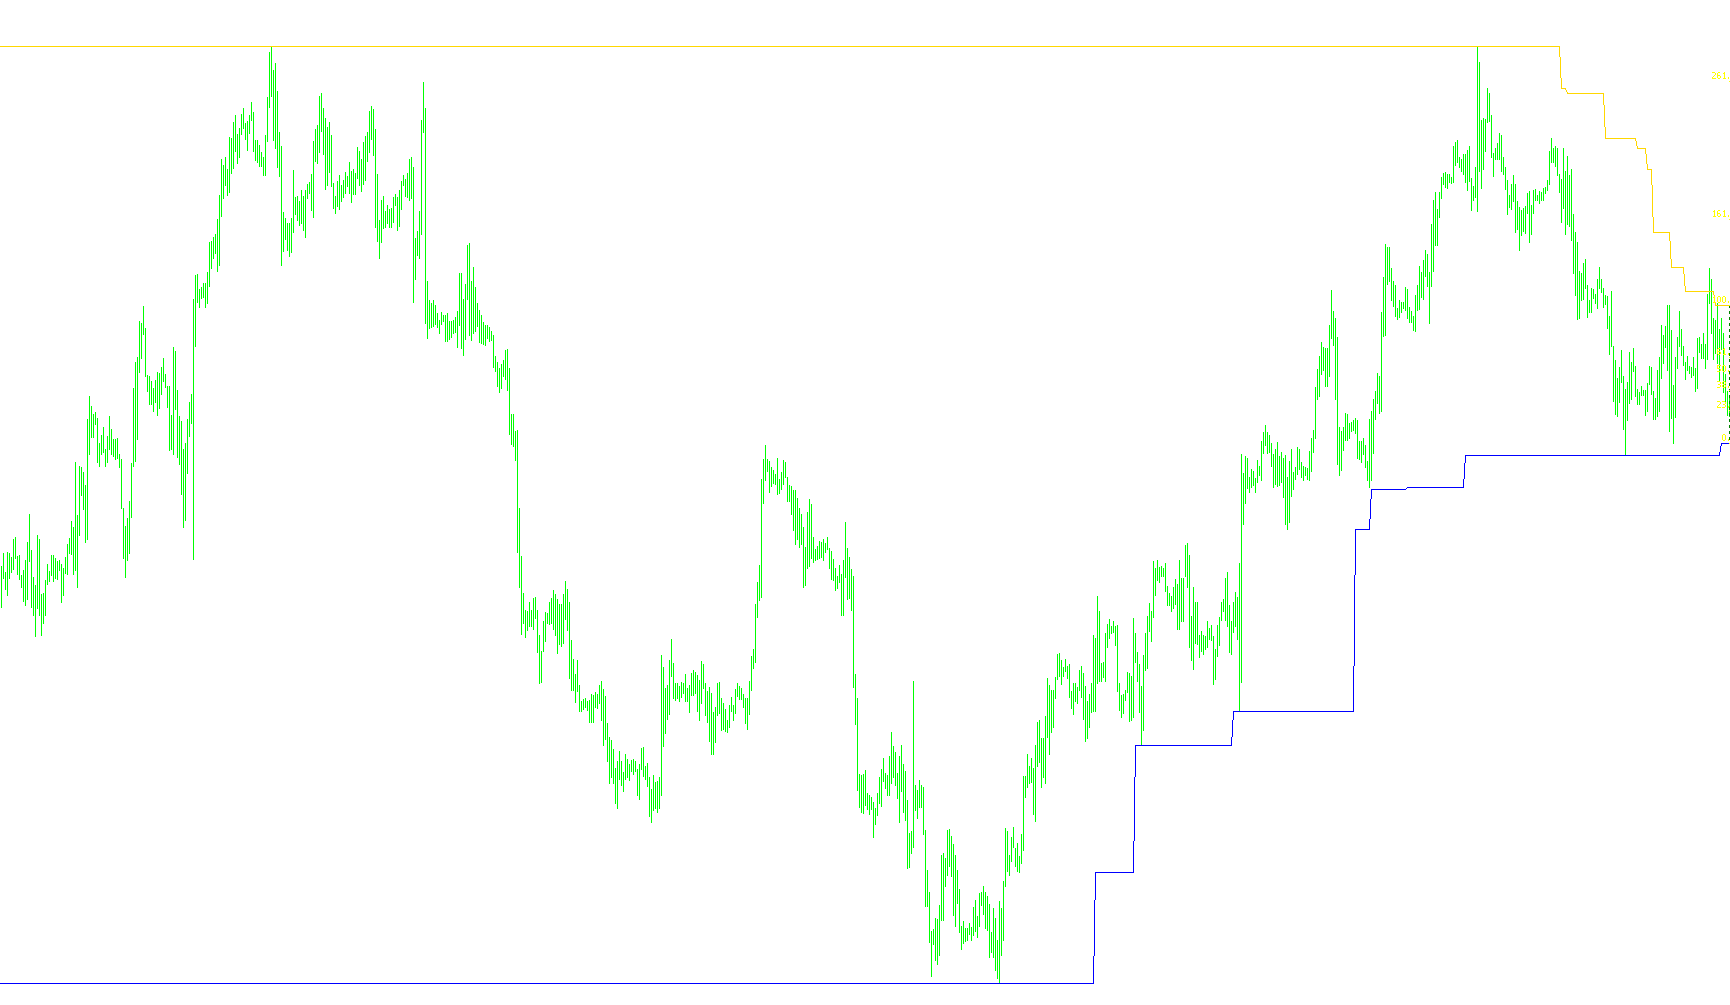
This script is designed as a visual trading tool for MetaTrader platforms to automatically identify and highlight key price levels—specifically Support and Resistance—directly on your charts. By analyzing historical price action, it seeks to pinpoint areas where the market has shown significant "turning points" to help traders visualize potential zones of interest.
Core Logic and Behavior
The script operates by scanning historical price data and comparing current price movements against a Moving Average (a standard mathematical average used to smooth out price fluctuations). Here is how it determines its targets:
1. Identifying Resistance Levels The tool looks for specific "breakdown" behaviors. If the price was recently trading above its moving average but then dropped below it, the script identifies this as a shift in momentum. When this occurs, it scans a recent window of history (the last 20 bars) to find the highest price reached during that period. It marks this peak as a Resistance level.
2. Identifying Support Levels Conversely, the tool looks for "breakout" behaviors. If the price was trading below its moving average and then surged above it, the script identifies a bullish shift. It then scans that same historical window to find the lowest price reached, marking it as a Support level.
3. Dynamic Visual Mapping (The Fibonacci Tool) Instead of just drawing static lines, the script uses a dynamic approach to visualize the relationship between these levels:
- Price Interaction: The script constantly monitors where the current price sits in relation to the identified Support and Resistance zones.
- Automatic Drawing: It utilizes a specialized "Fibonacci" object to draw a visual range on the chart.
- Real-Time Adjustment: Depending on whether the price is currently breaking through, sitting between, or reacting to these levels, the script automatically moves and updates this visual marker. This allows the user to see the immediate "trading zone" (the gap between support and resistance) update dynamically as new candles form.
Summary for the User
Essentially, this script acts as an automated analyst. It watches the market for signs of exhaustion or momentum shifts, finds the high and low points associated with those shifts, and draws a visual "trade zone" on your chart. This helps you quickly see where the "floor" (Support) and "ceiling" (Resistance) are currently located without having to manually calculate them.
//+------------------------------------------------------------------+
//|                                      Support and Resistance .mq4 |
//|                                                                  |
//|                                                                  |
//|                                    Conversion: Dr_Richard_Gaines |
//|                                      dr_richard_gaines@yahoo.com |
//+------------------------------------------------------------------+

#property copyright " Copyright © 2004, MetaQuotes Software Corp."
#property link      " http://www.metaquotes.net/"
#include <stdlib.mqh>
#property indicator_chart_window
#property indicator_color1 Black
#property indicator_buffers 2
#property indicator_color2 Red

#property indicator_width1 3
#property indicator_width2 3

//+------------------------------------------------------------------+
//| Common External variables                                        |
//+------------------------------------------------------------------+

//+------------------------------------------------------------------+
//| External variables                                               |
//+------------------------------------------------------------------+

//+------------------------------------------------------------------+
//| Special Convertion Functions                                     |
//+------------------------------------------------------------------+

int LastTradeTime;
double ExtHistoBuffer[];
double ExtHistoBuffer2[];

void SetLoopCount(int loops)
{
}

void SetIndexValue(int shift, double value)
{
  ExtHistoBuffer[shift] = value;
}

void SetIndexValue2(int shift, double value)
{
  ExtHistoBuffer2[shift] = value;
}

bool MoveObject(string name, int type, datetime Atime, double Aprice, datetime Atime2 = 0, double Aprice2 = 0, color Acolor = CLR_NONE, int Aweight = 0, int Astyle = 0)
{
    if (ObjectFind(name) != -1)
    {
      int OType = ObjectType(name);

      if ((OType == OBJ_VLINE) ||
         (OType == OBJ_HLINE) ||
         (OType == OBJ_TRENDBYANGLE) ||
         (OType == OBJ_TEXT) ||
         (OType == OBJ_ARROW) ||
         (OType == OBJ_LABEL))
      {
        return(ObjectMove(name, 0, Atime, Aprice));
      }

      if ((OType == OBJ_GANNLINE) ||
         (OType == OBJ_GANNFAN) ||
         (OType == OBJ_GANNGRID) ||
         (OType == OBJ_FIBO) ||
         (OType == OBJ_FIBOTIMES) ||
         (OType == OBJ_FIBOFAN) ||
         (OType == OBJ_FIBOARC) ||
         (OType == OBJ_RECTANGLE) ||
         (OType == OBJ_ELLIPSE) ||
         (OType == OBJ_CYCLES) ||
         (OType == OBJ_TREND) ||
         (OType == OBJ_STDDEVCHANNEL) ||
         (OType == OBJ_REGRESSION))
      {
        return(ObjectMove(name, 0, Atime, Aprice) && ObjectMove(name, 1, Atime2, Aprice2));
      }

/*
          OBJ_CHANNEL,
          OBJ_EXPANSION,
          OBJ_FIBOCHANNEL,
          OBJ_TRIANGLE,
          OBJ_PITCHFORK
*/
    }
    else
    {
      return(ObjectCreate(name, type, 0, Atime, Aprice, Atime2, Aprice2, 0, 0) && ObjectSet(name, OBJPROP_COLOR, Acolor));
    }
}

//+------------------------------------------------------------------+
//| End                                                              |
//+------------------------------------------------------------------+

//+------------------------------------------------------------------+
//| Initialization                                                   |
//+------------------------------------------------------------------+

int init()
{
   SetIndexStyle(0, DRAW_LINE, STYLE_SOLID);
   SetIndexBuffer(0, ExtHistoBuffer);
   SetIndexStyle(1, DRAW_LINE, STYLE_SOLID);
   SetIndexBuffer(1, ExtHistoBuffer2);
   return(0);
}
int start()
{
//+------------------------------------------------------------------+
//| Local variables                                                  |
//+------------------------------------------------------------------+
int shift = 0;
double res = 0;
double sup = 0;

/*[[
	Name := sup_res
	Author := Copyright © 2004, MetaQuotes Software Corp.
	Link := http://www.metaquotes.net/
	Separate Window := No
	First Color := Blue
	First Draw Type := Symbol
	First Symbol := 119
	Use Second Data := Yes
	Second Color := Red
	Second Draw Type := Symbol
	Second Symbol := 119
]]*/


SetLoopCount(0);
// loop from first bar to current bar (with shift=0)
for(shift=Bars-1;shift>=0 ;shift--){
if( Close[shift+2]>= iMA(NULL, 0, 10, 0, MODE_SMA, PRICE_CLOSE, shift+2)&&
 Close[shift+1]< iMA(NULL, 0, 10, 0, MODE_SMA, PRICE_CLOSE, shift+1))
res=High[Highest(NULL, 0, MODE_HIGH,shift+20,20)];
if( Close[shift+2]<= iMA(NULL, 0, 10, 0, MODE_SMA, PRICE_CLOSE, shift+2)&&
Close[shift+1]> iMA(NULL, 0, 10, 0, MODE_SMA, PRICE_CLOSE, shift+1))
sup=Low[Lowest(NULL, 0, MODE_LOW,shift+20,20)];
	SetIndexValue(shift, res);
	SetIndexValue2(shift, sup);
	if( Close[shift+1]<sup )

	MoveObject("trade",OBJ_FIBO,Time[shift+1],sup,Time[shift+1],res,Green,1,STYLE_DASH); else
if( Close[shift+1]>res )
	MoveObject("trade",OBJ_FIBO,Time[shift+1],res,Time[shift+1],sup,Green,1,STYLE_DASH); else
if( Close[shift+1]<res && Close[shift+1]>sup   )
	MoveObject("trade",OBJ_FIBO,Time[shift+1],res,Time[shift+1],sup,Green,1,STYLE_DASH);
}


  return(0);
}
Comments