Sinewave2
Indicator

Sinewave2

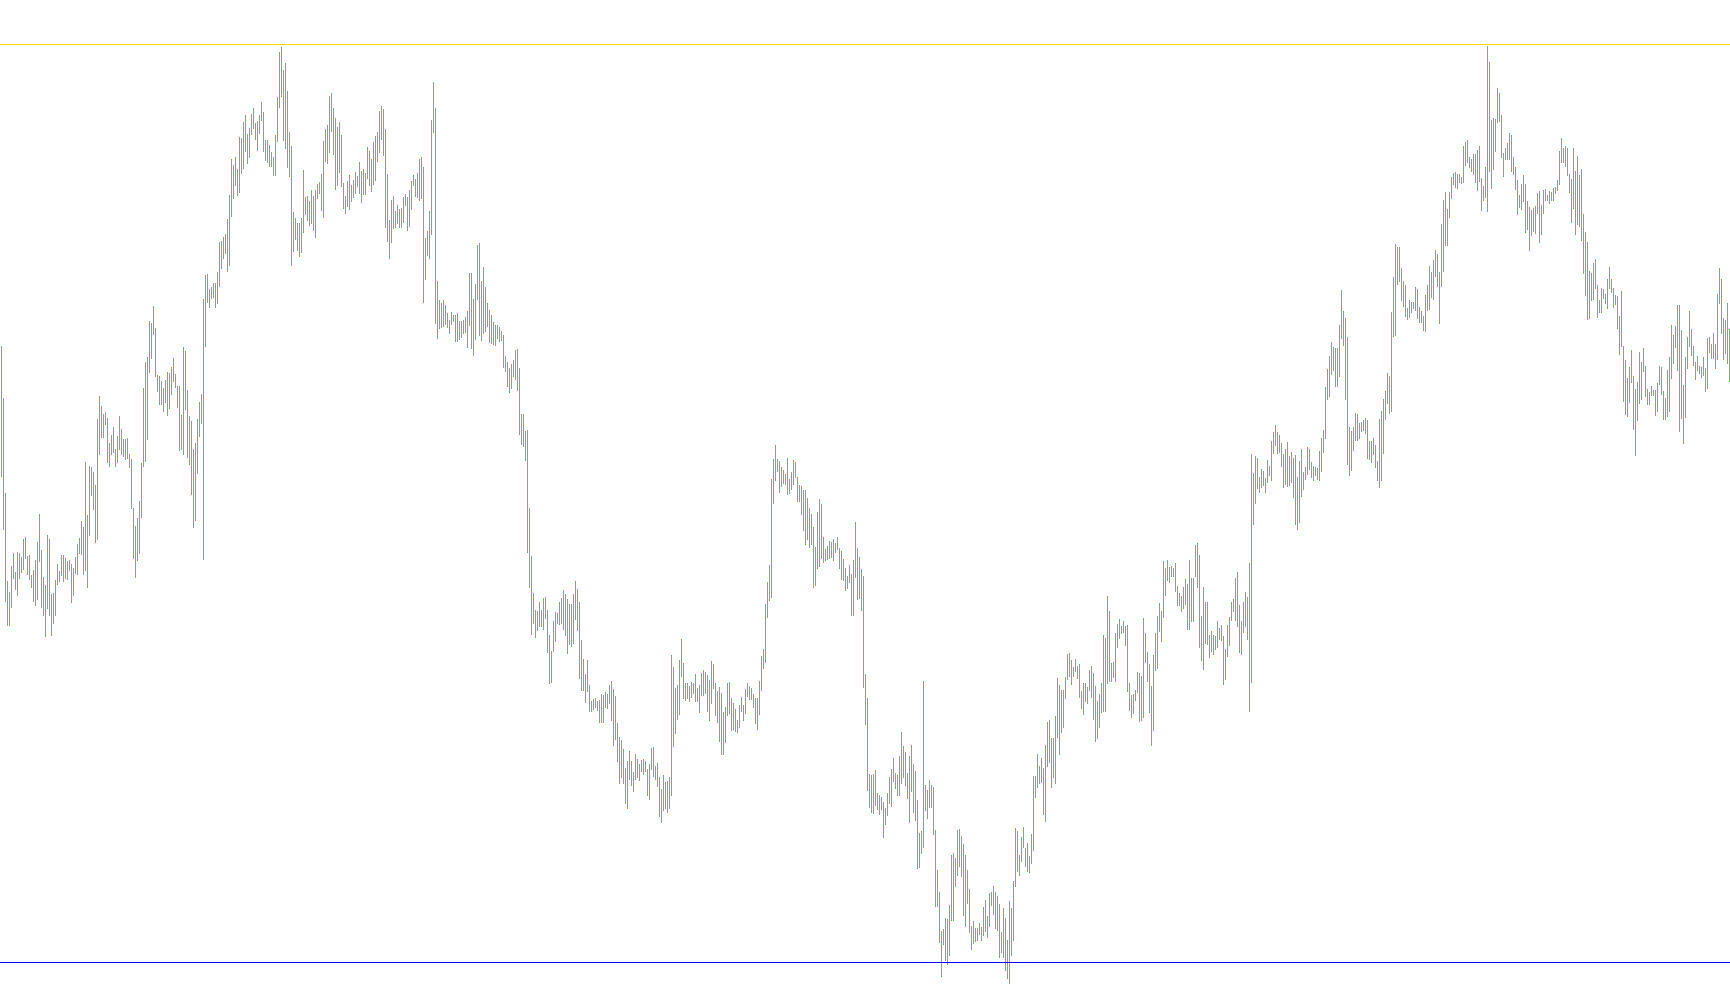
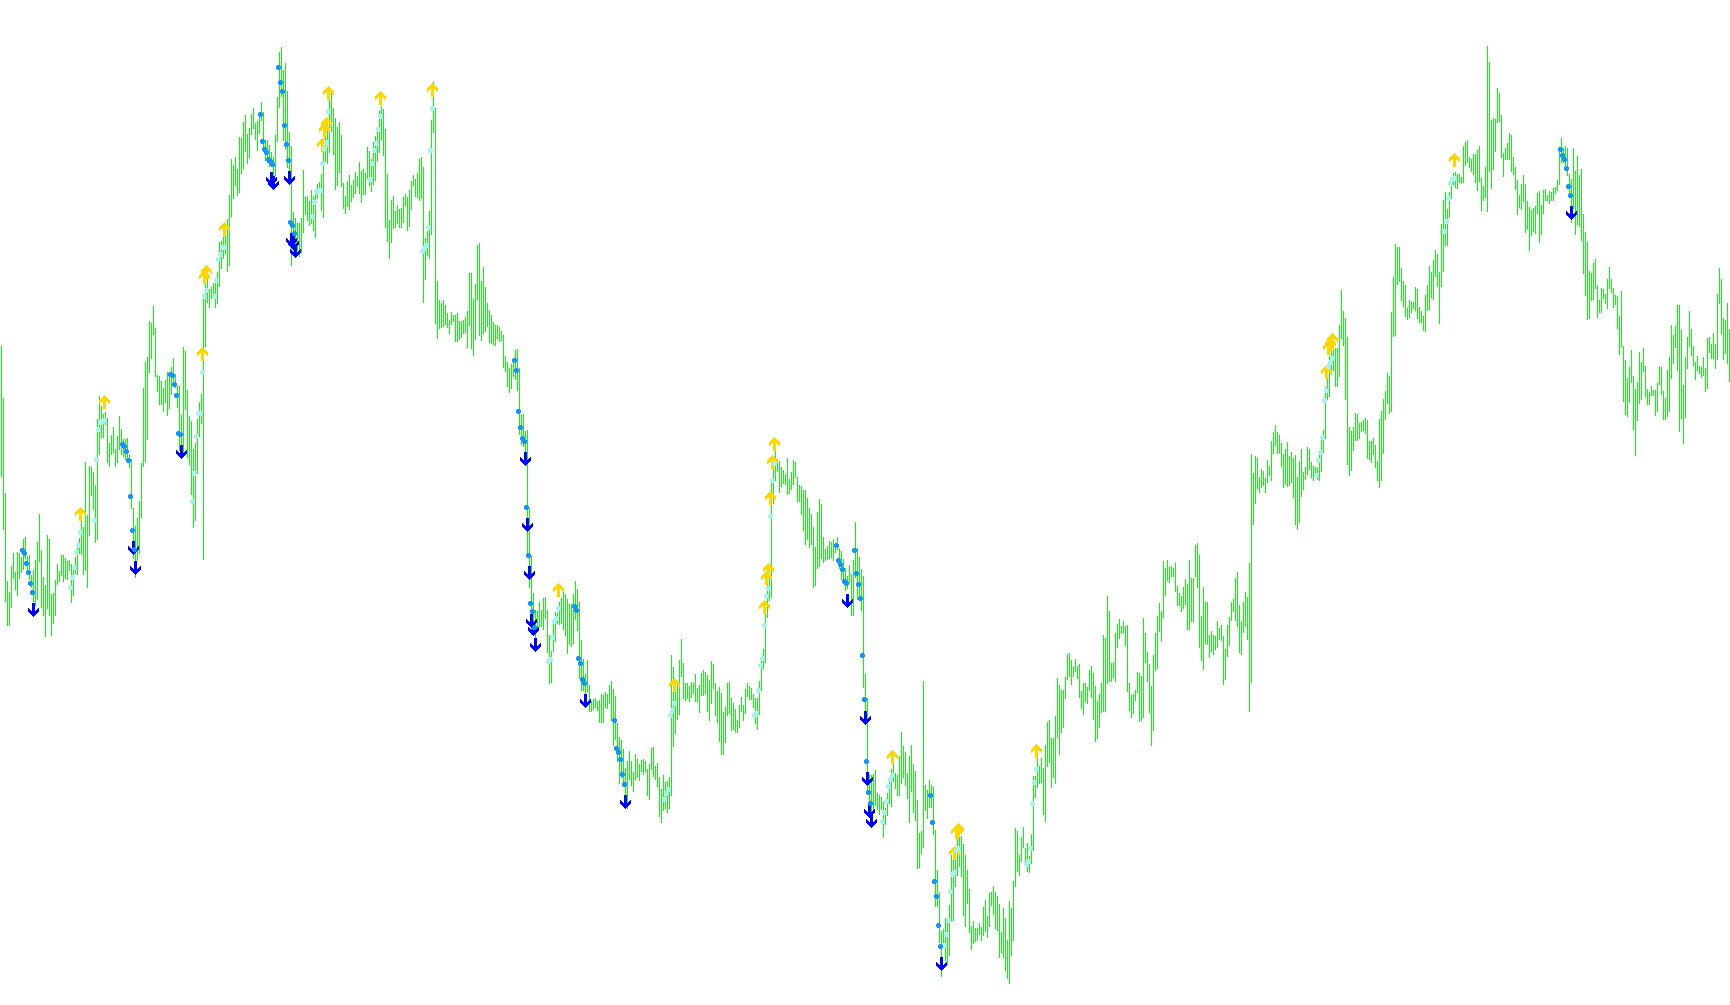
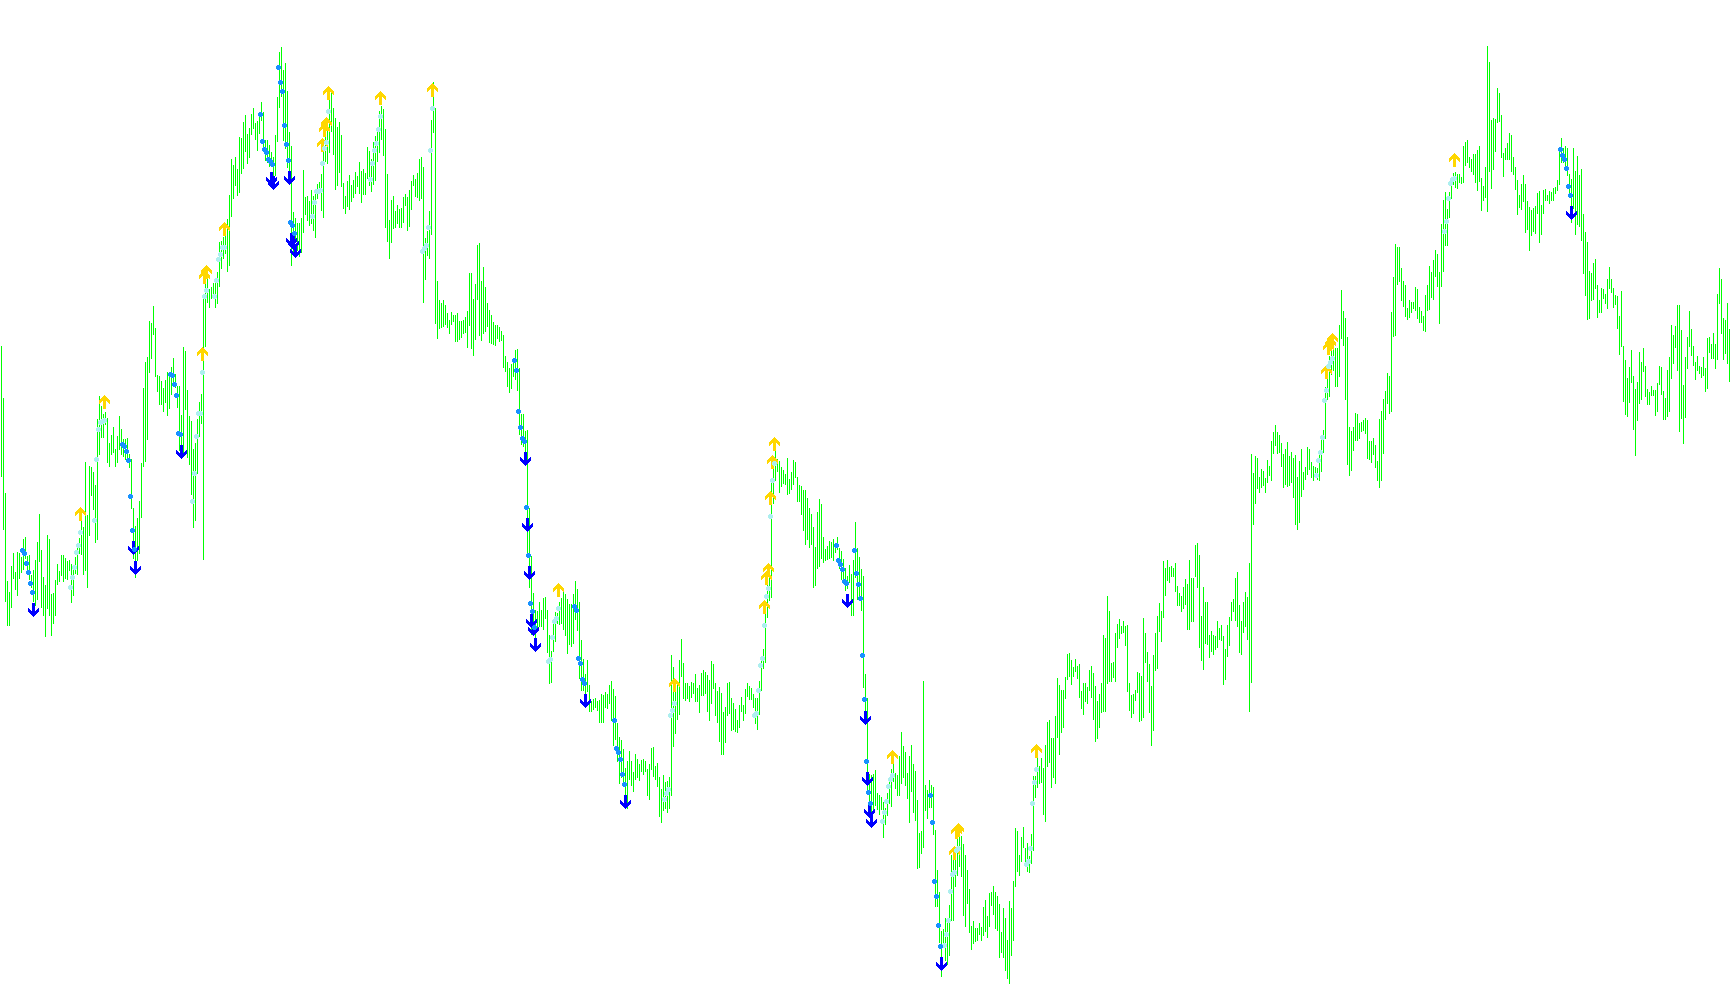
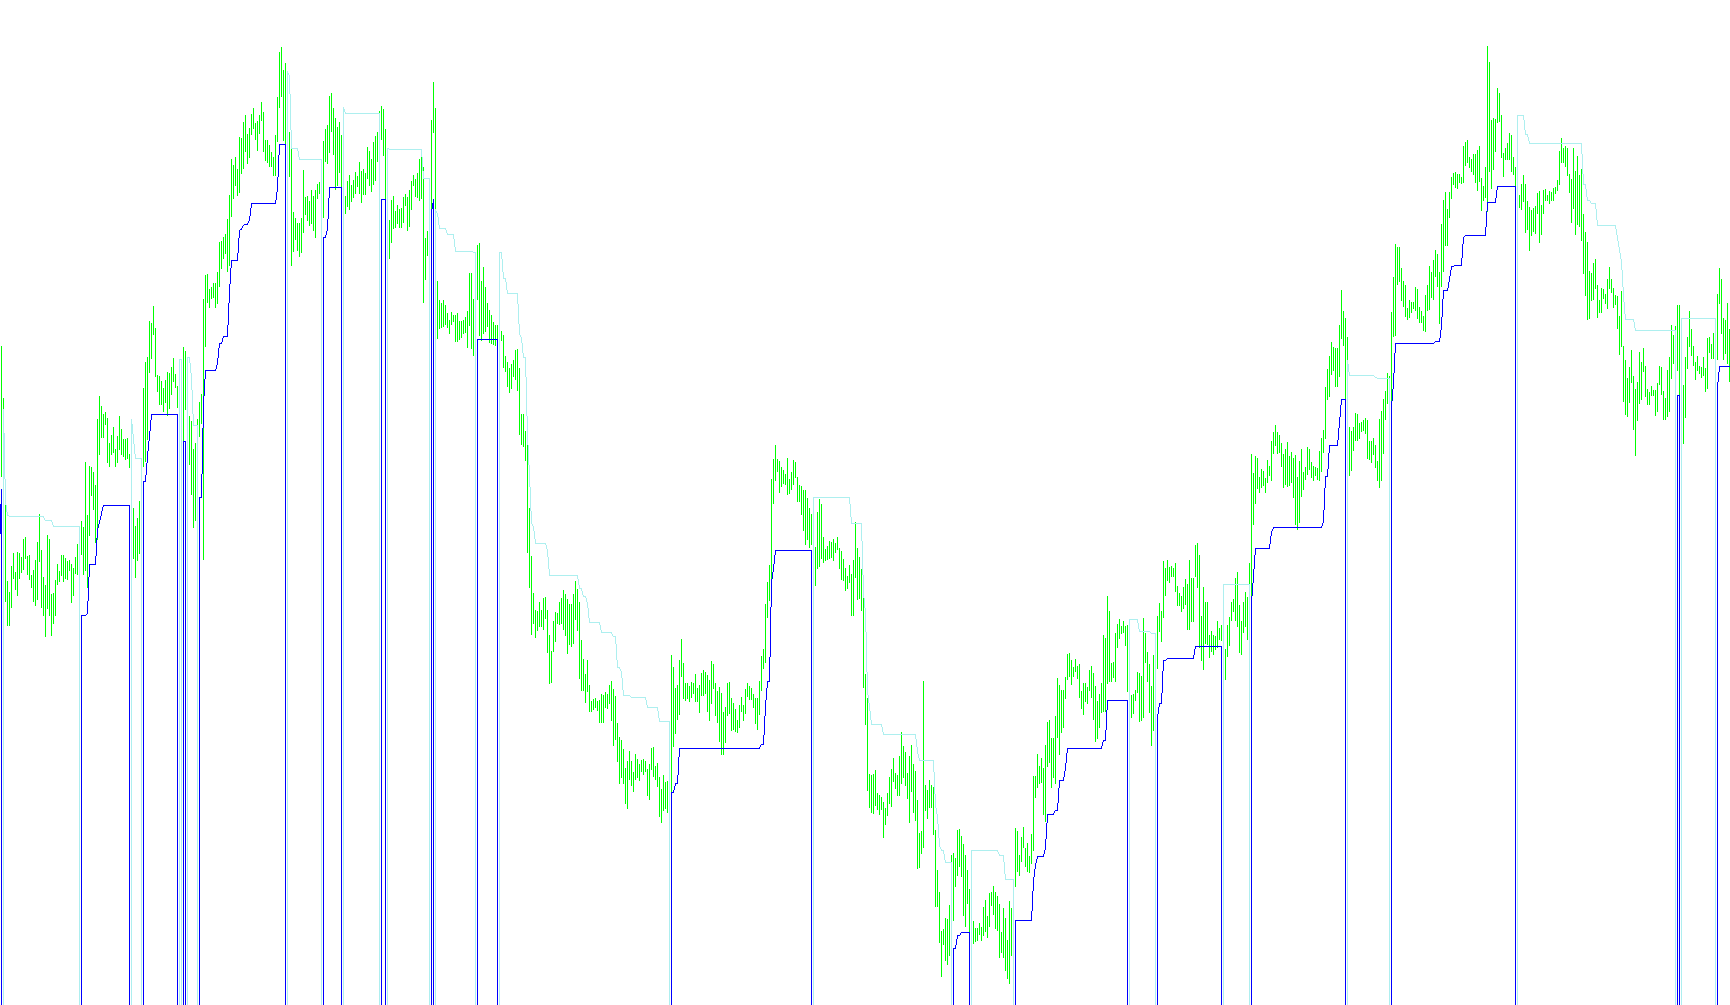
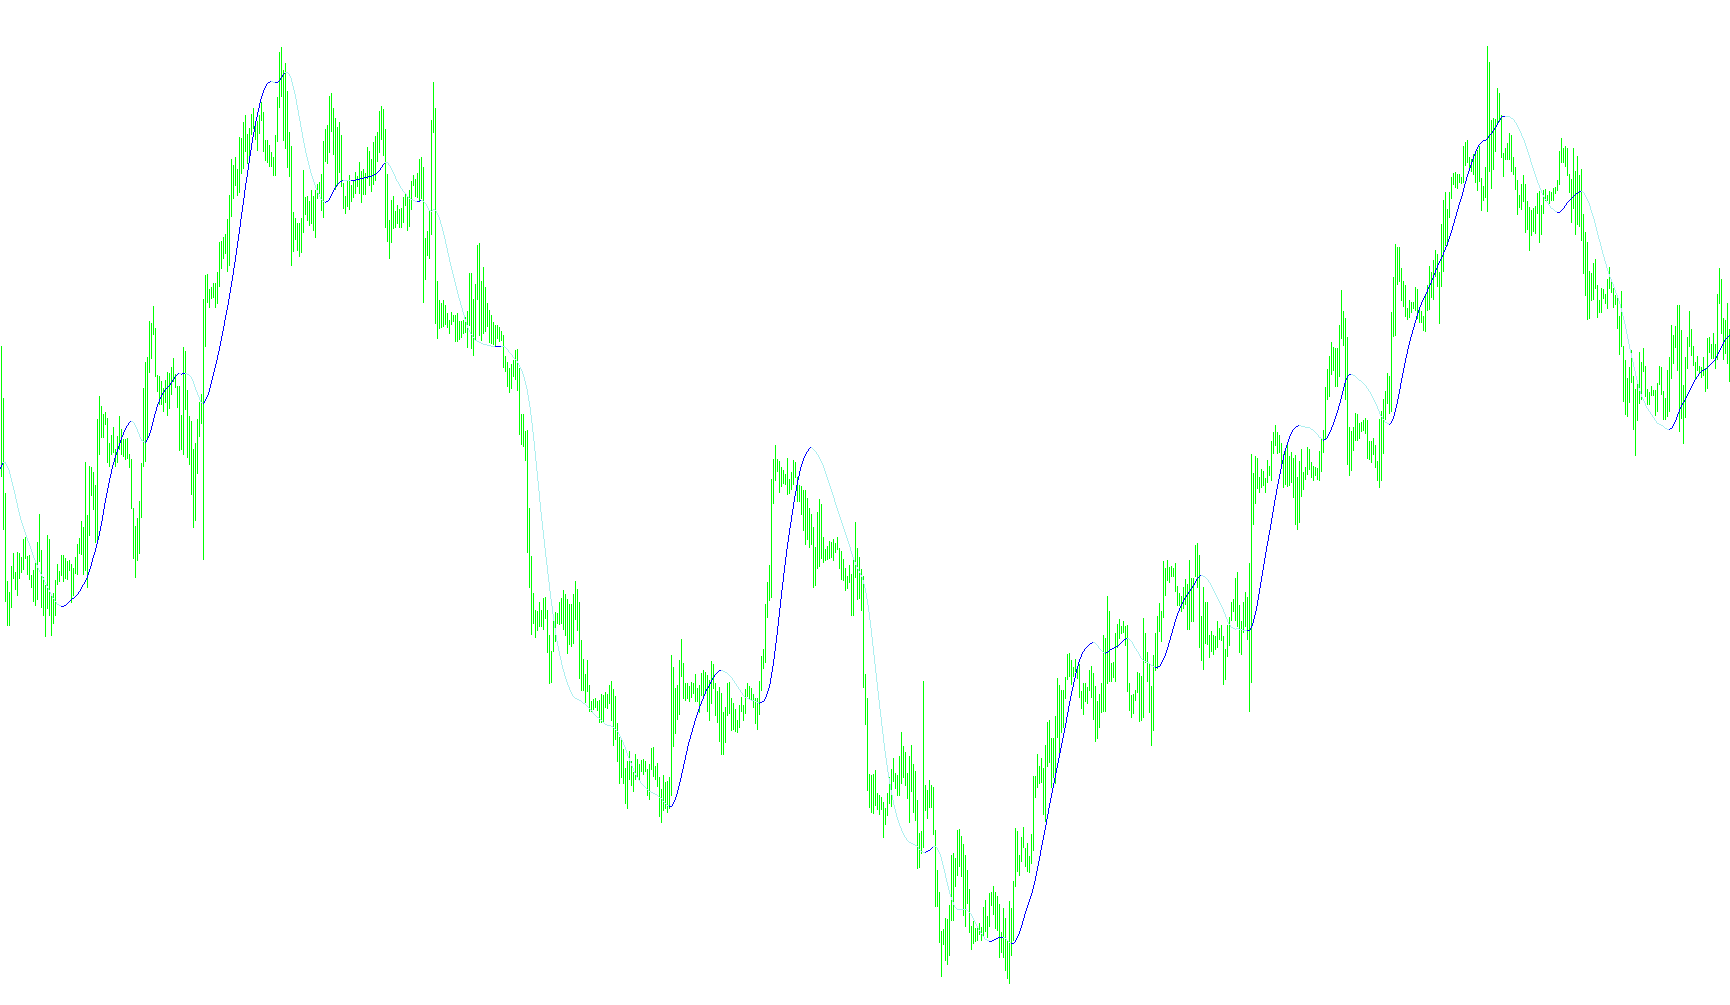
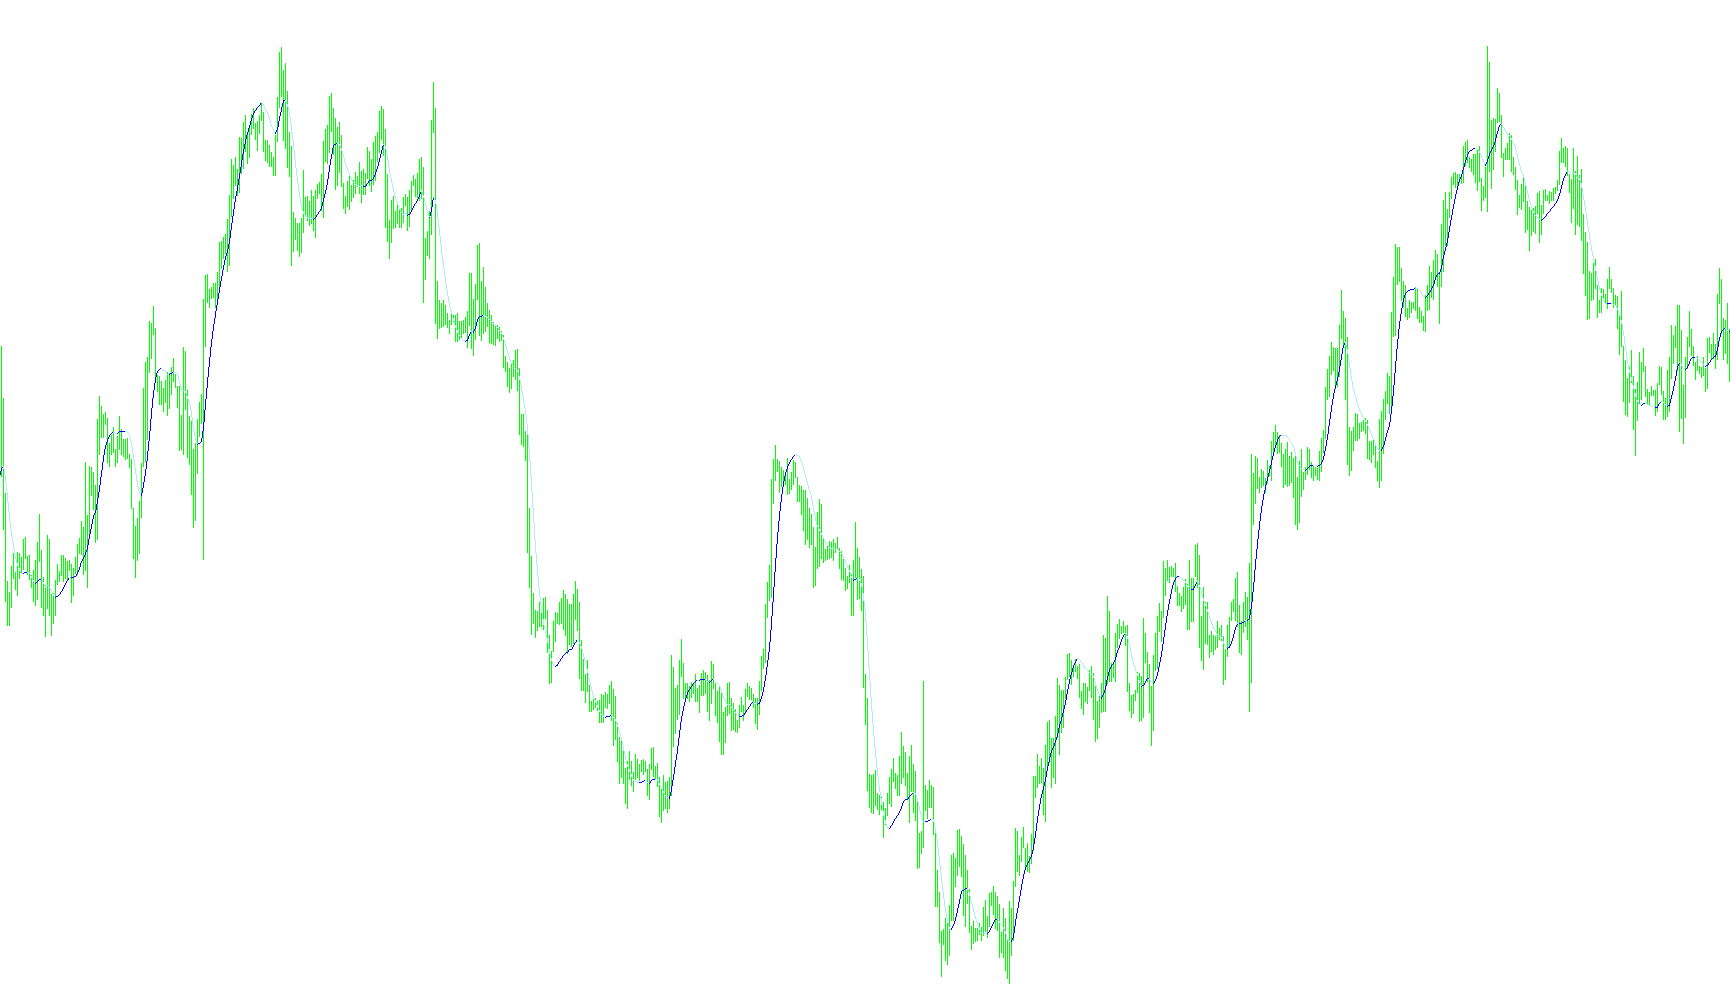
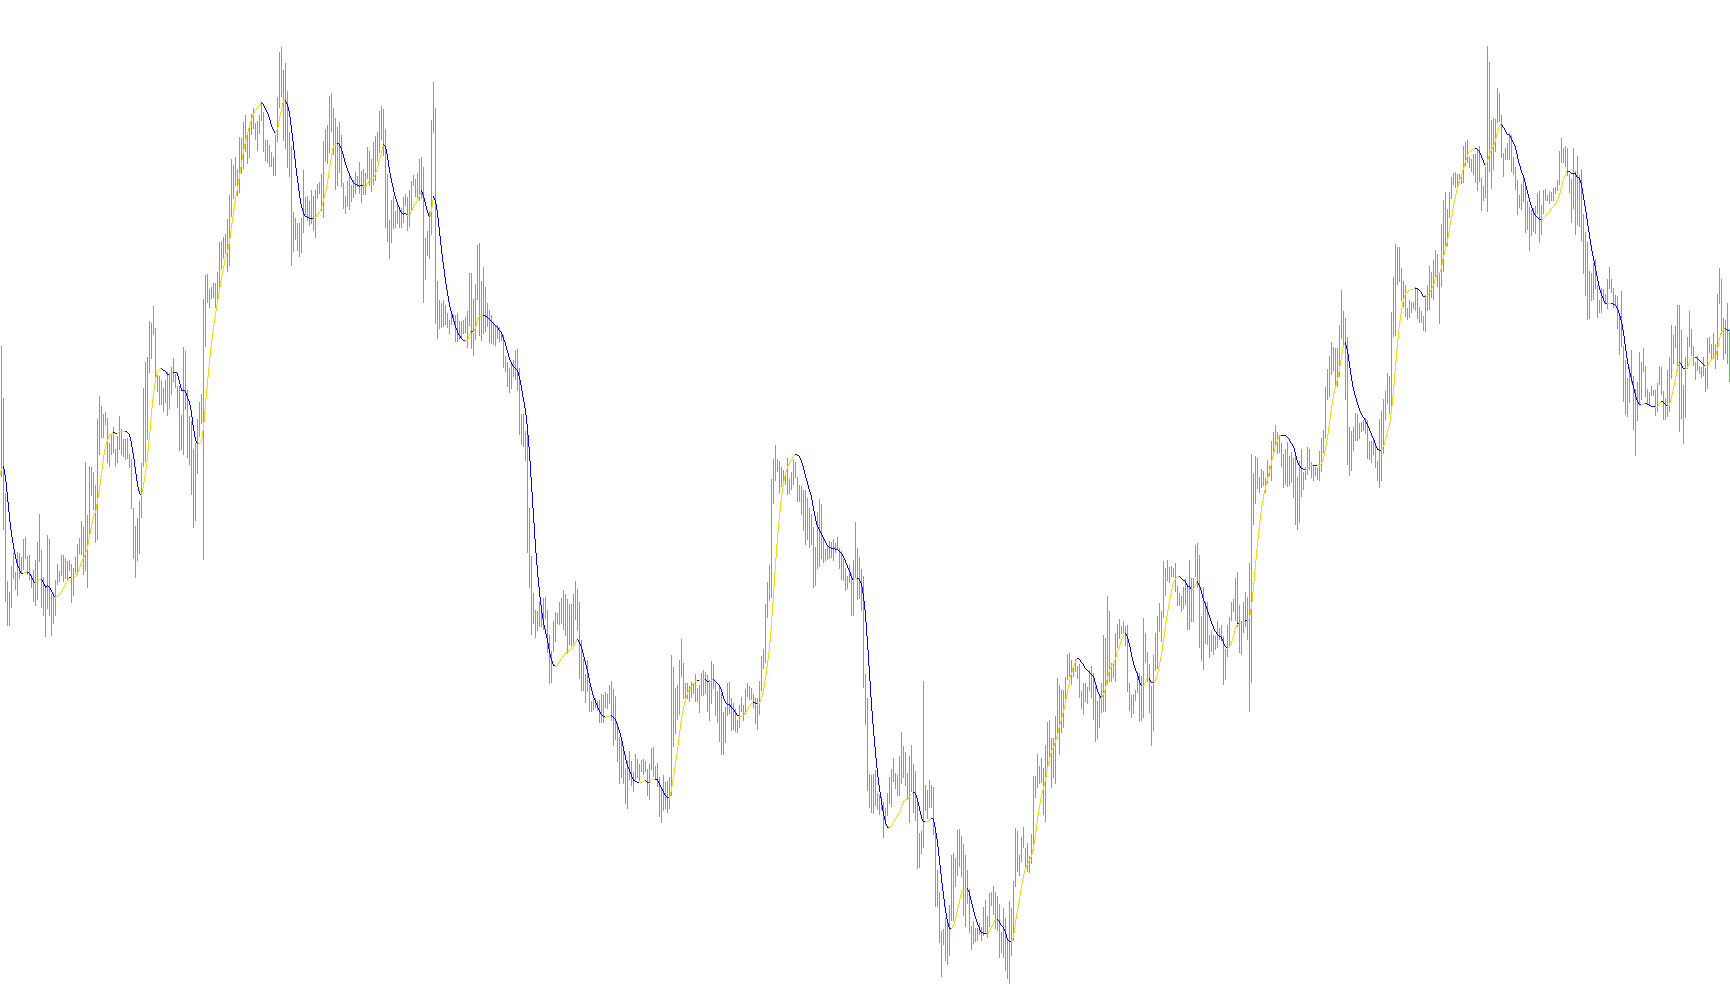
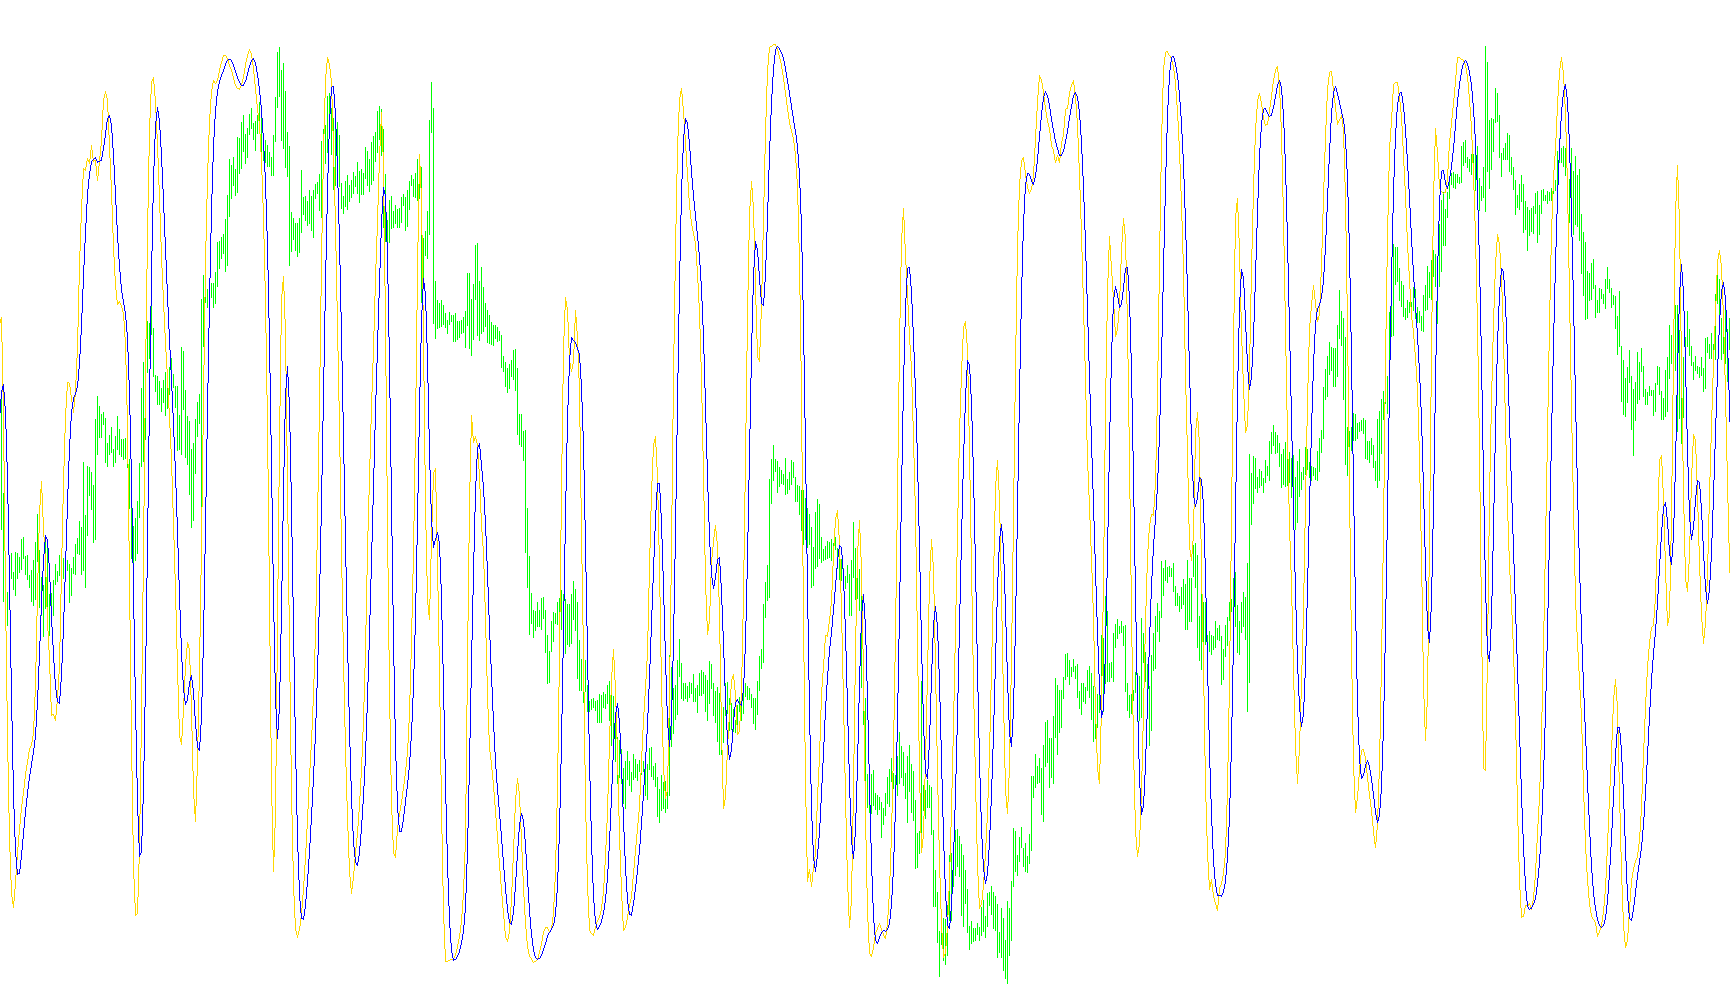
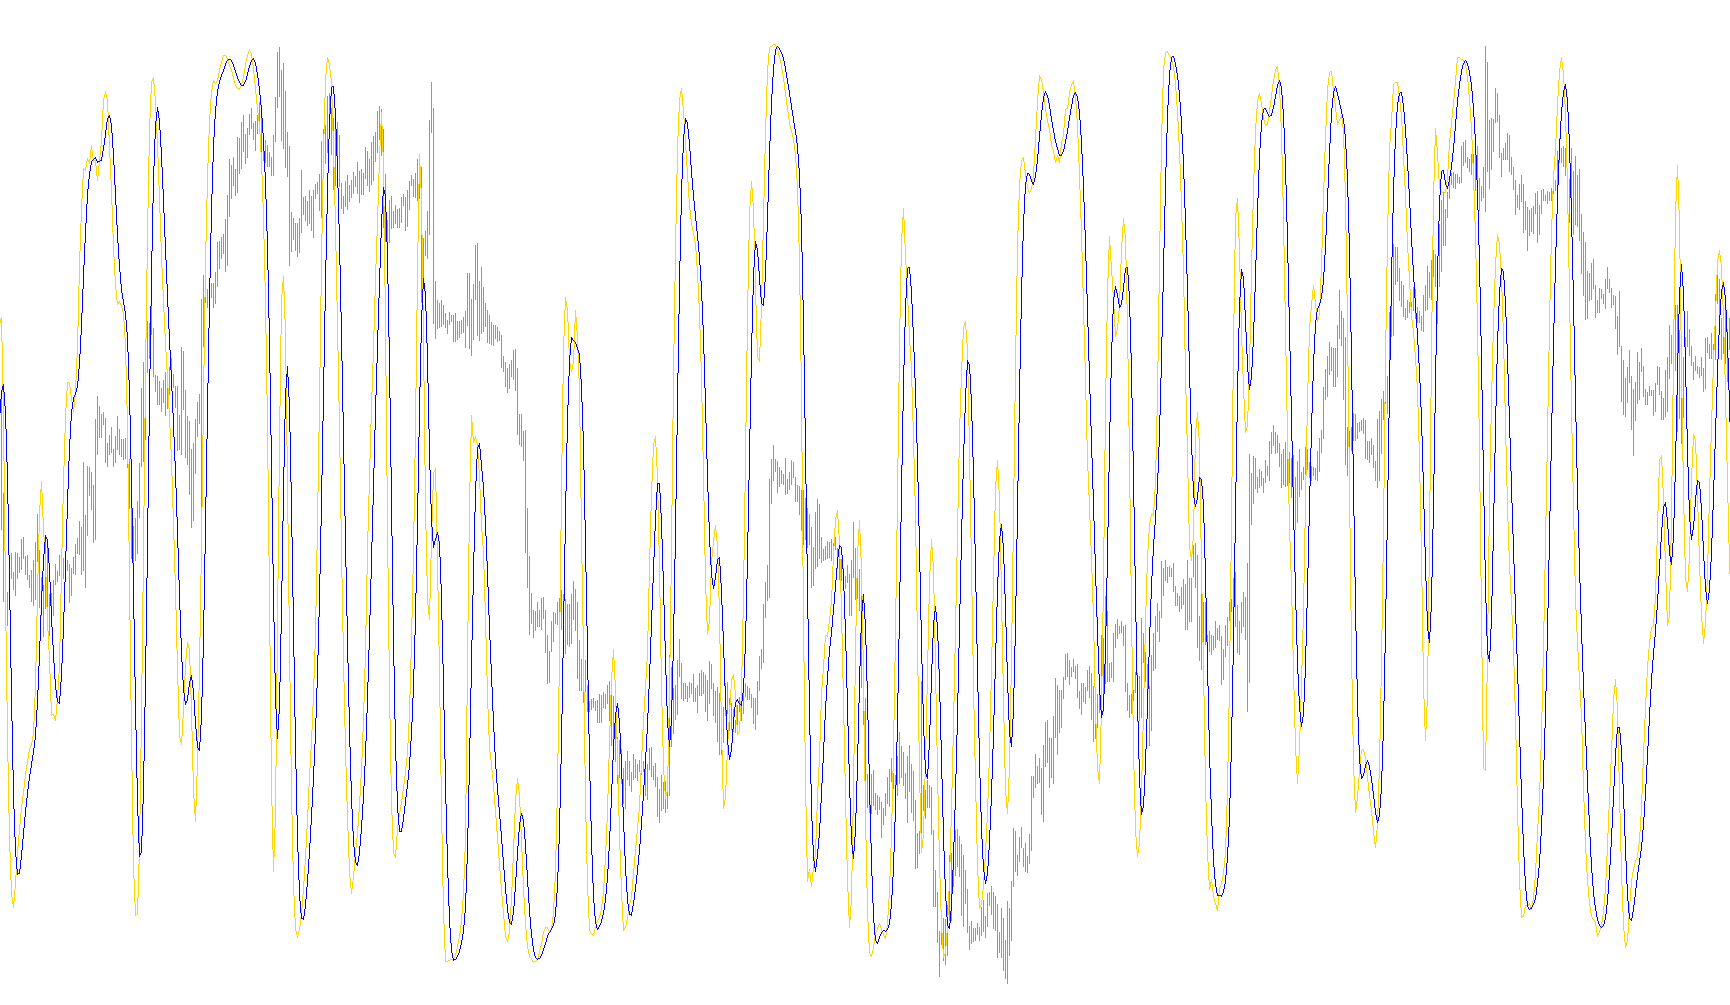
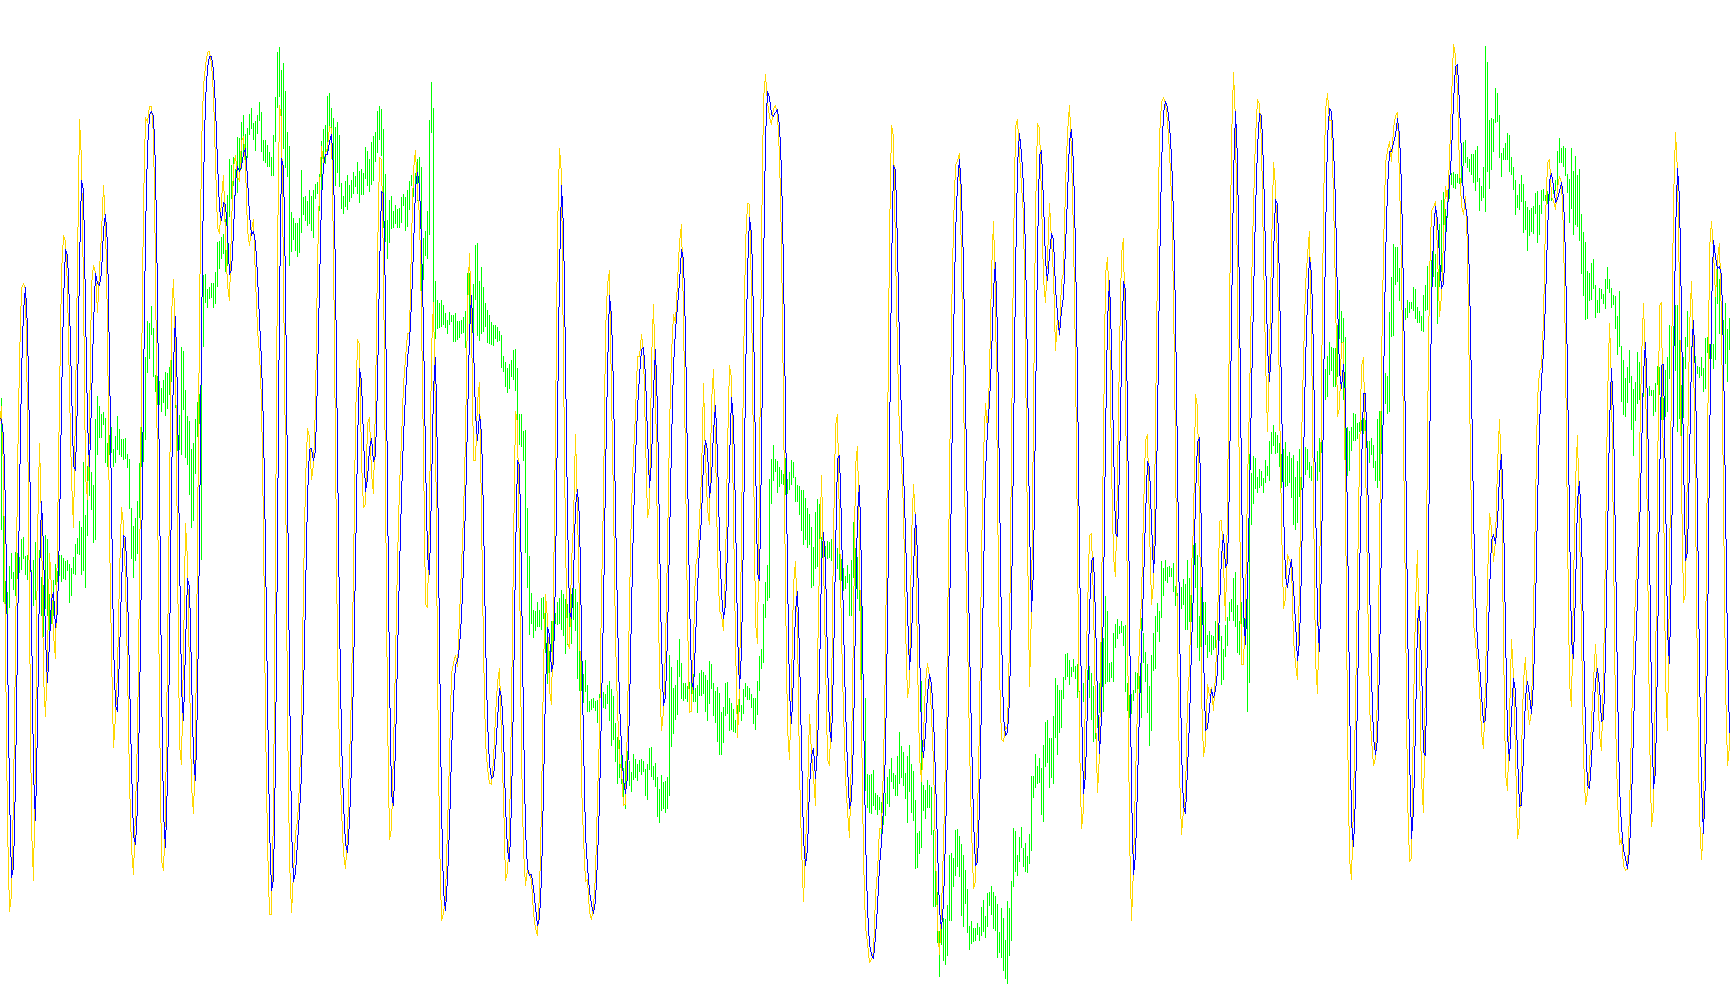
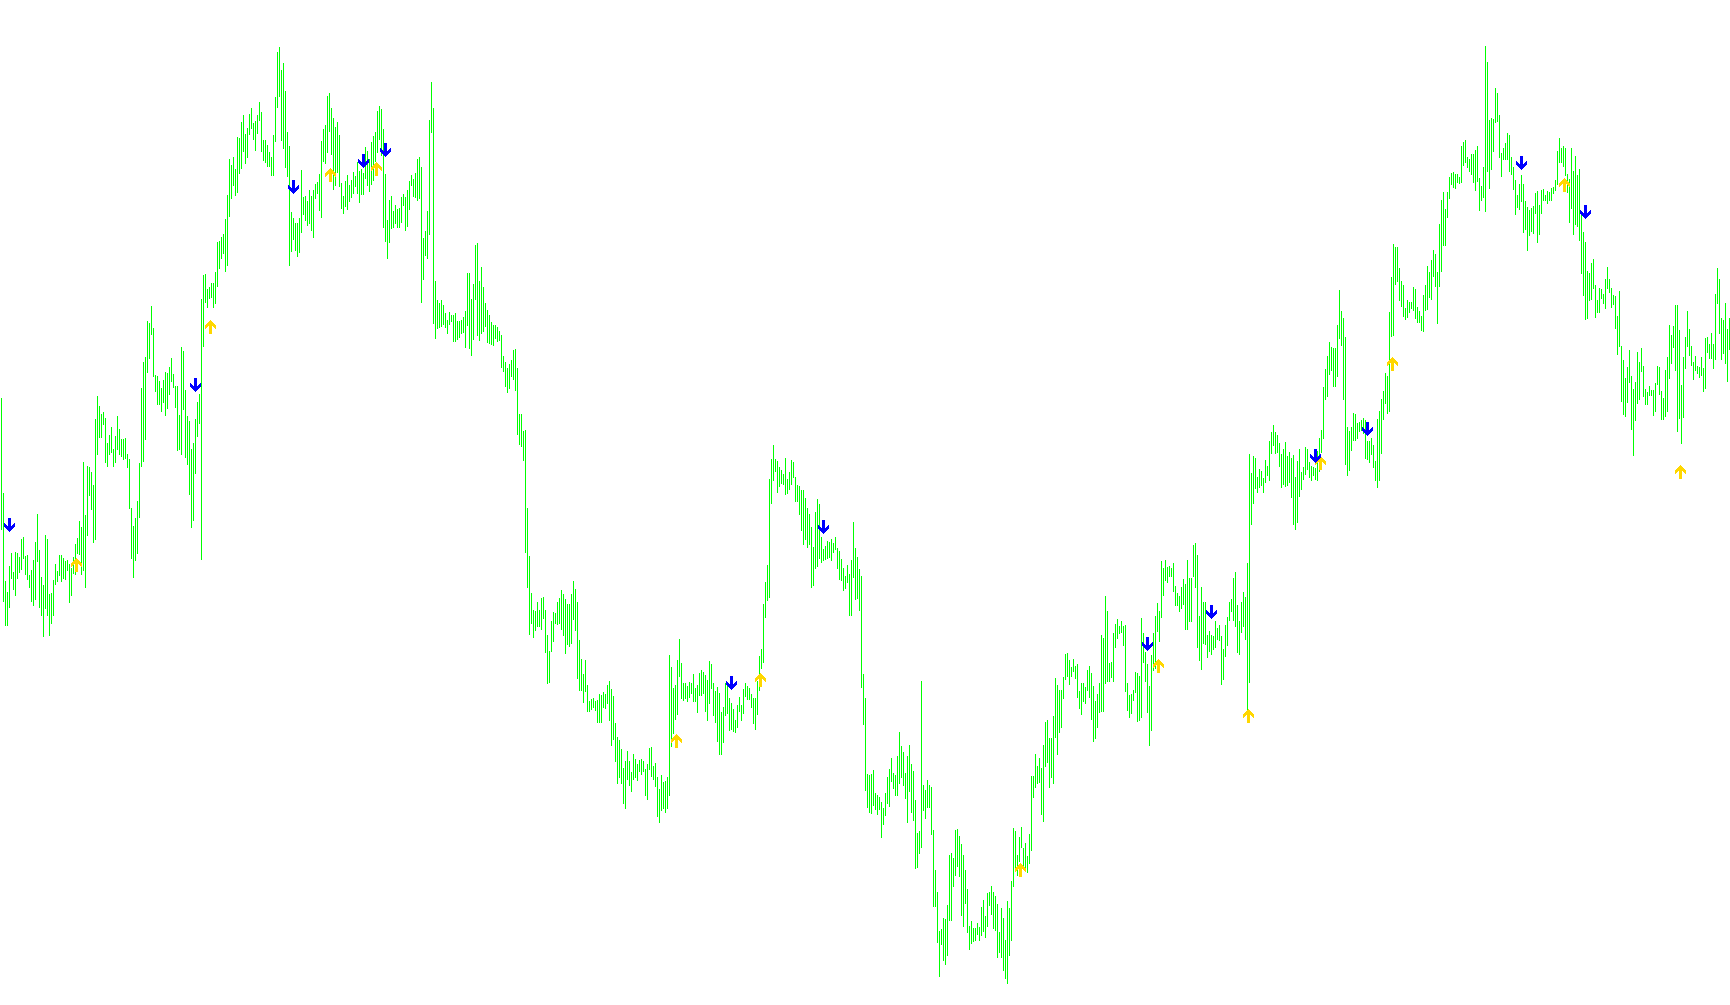
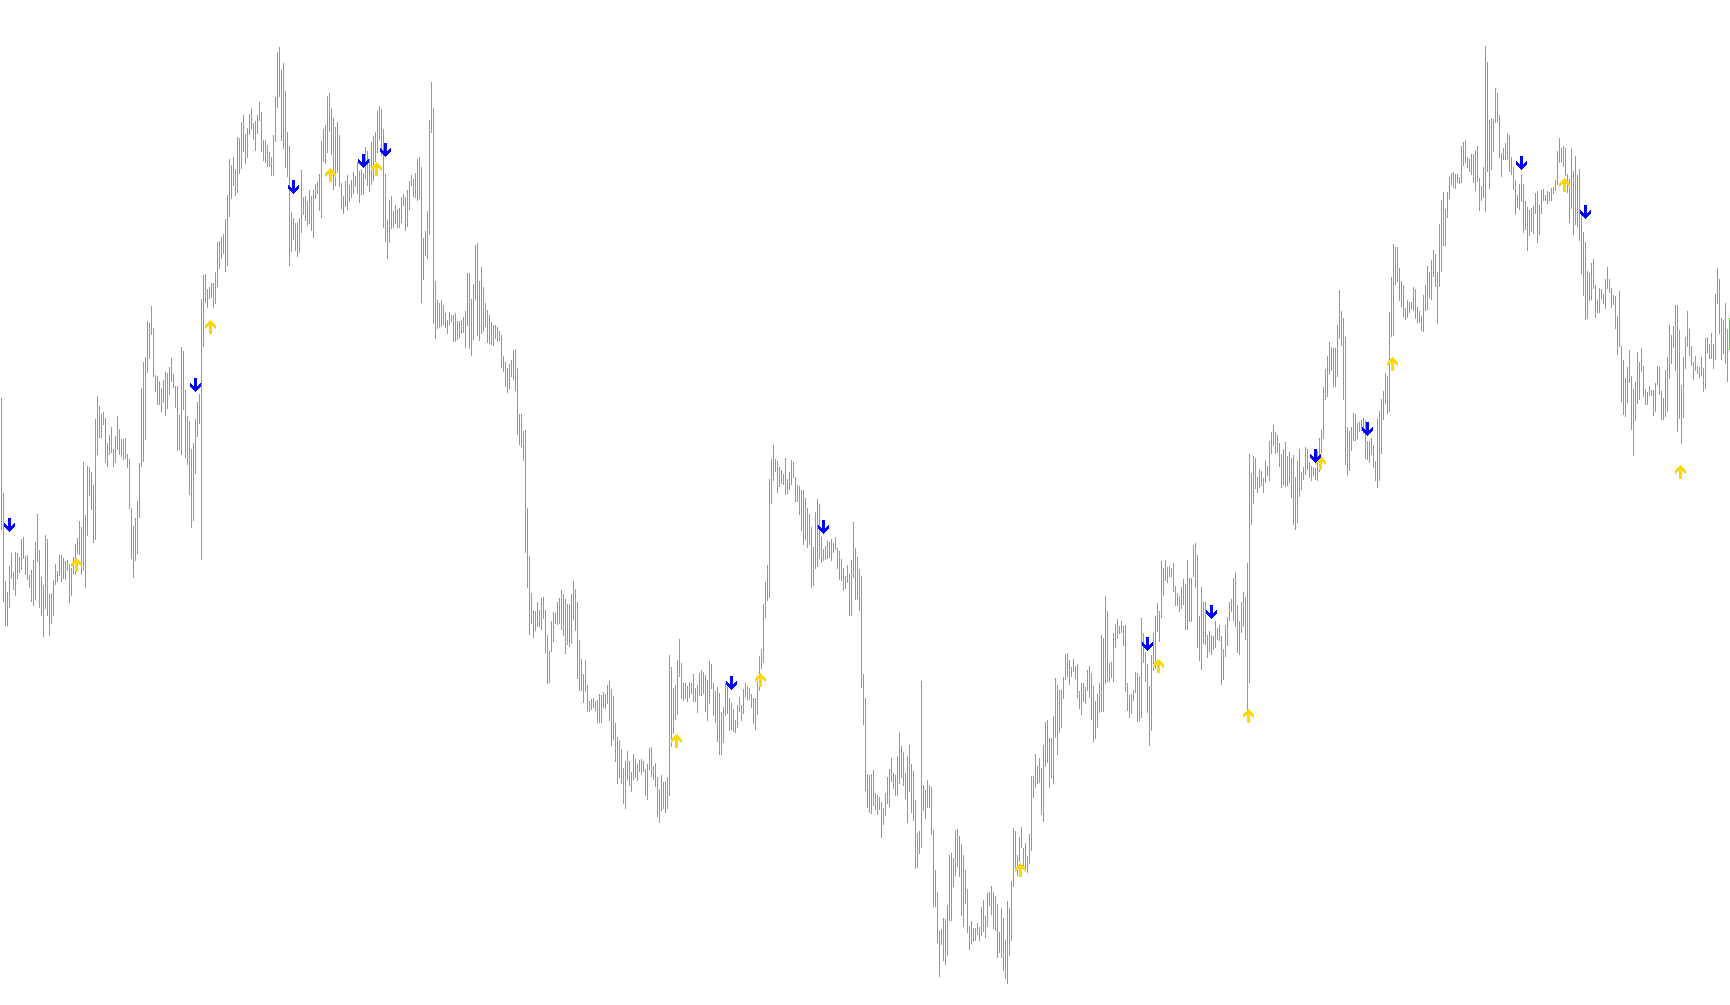
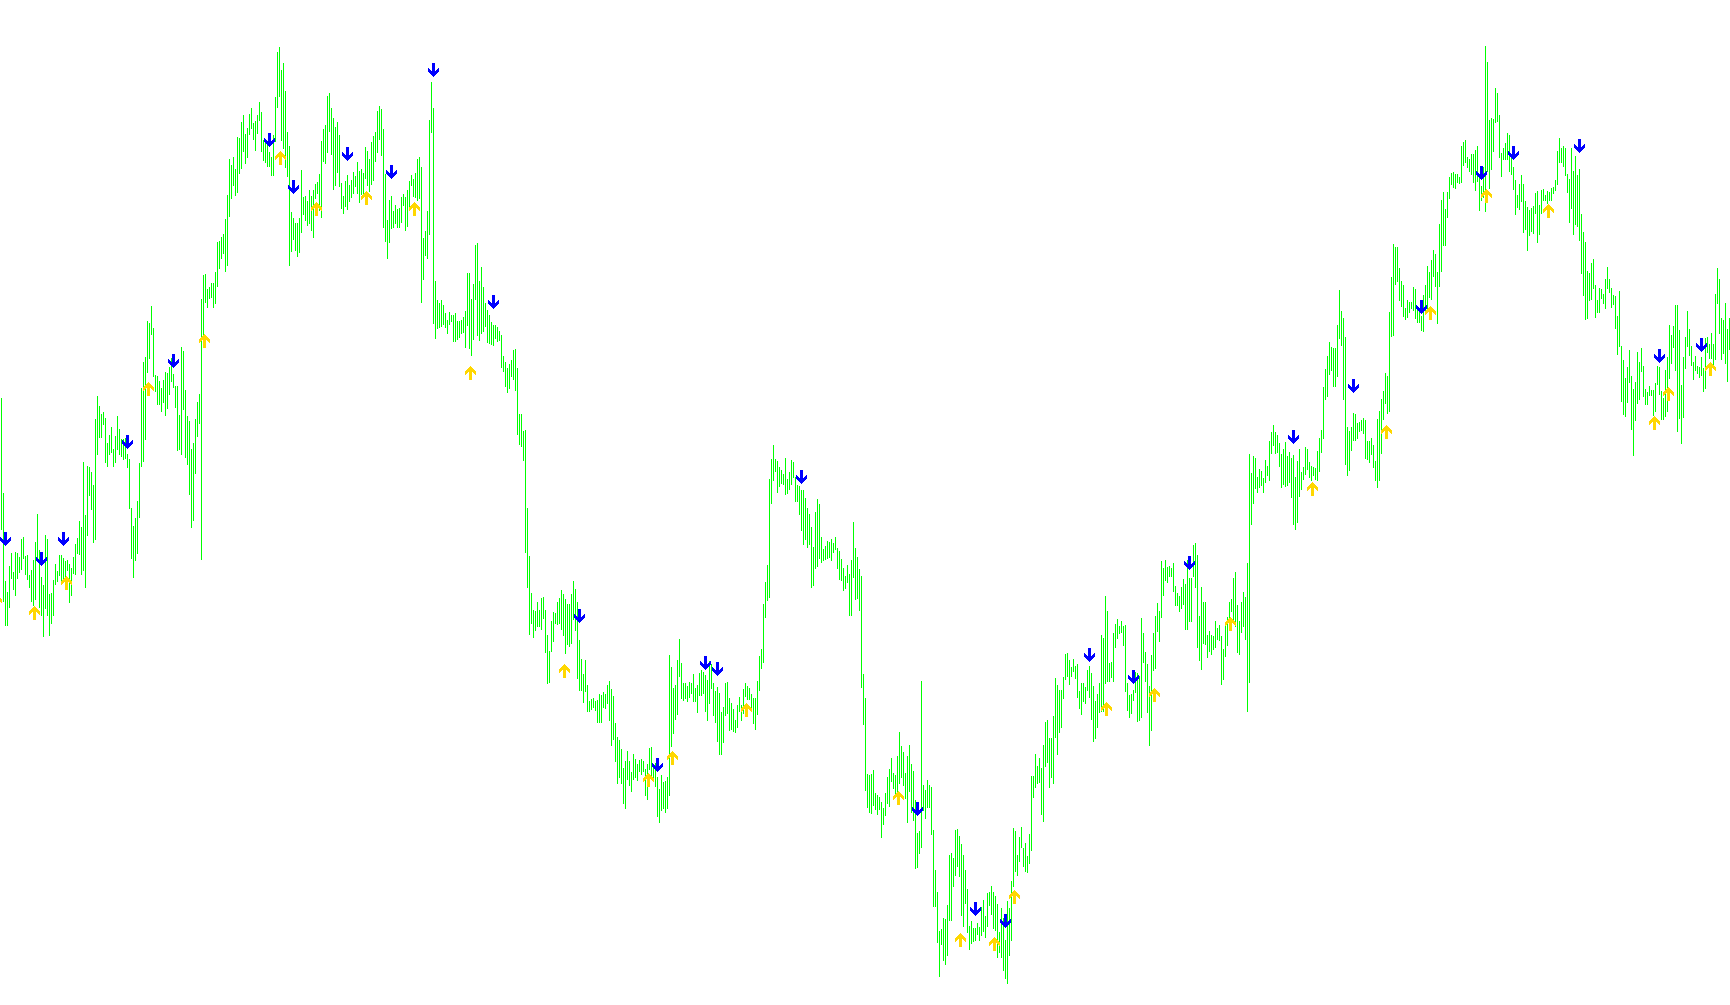
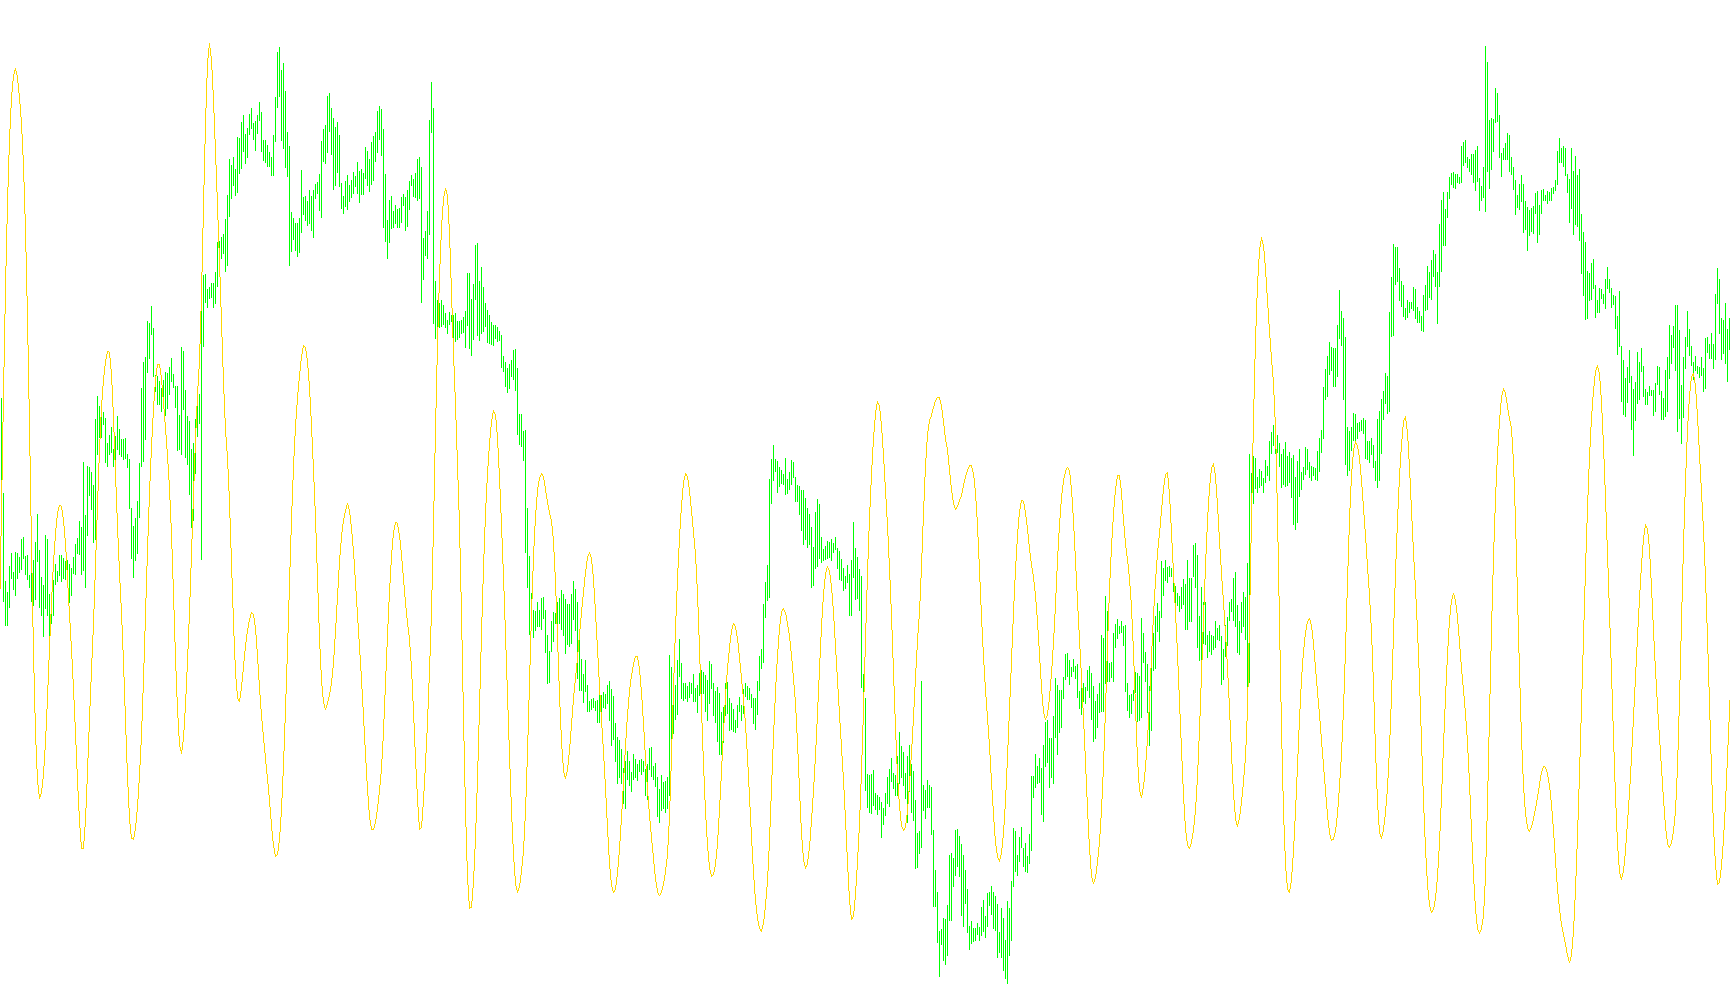
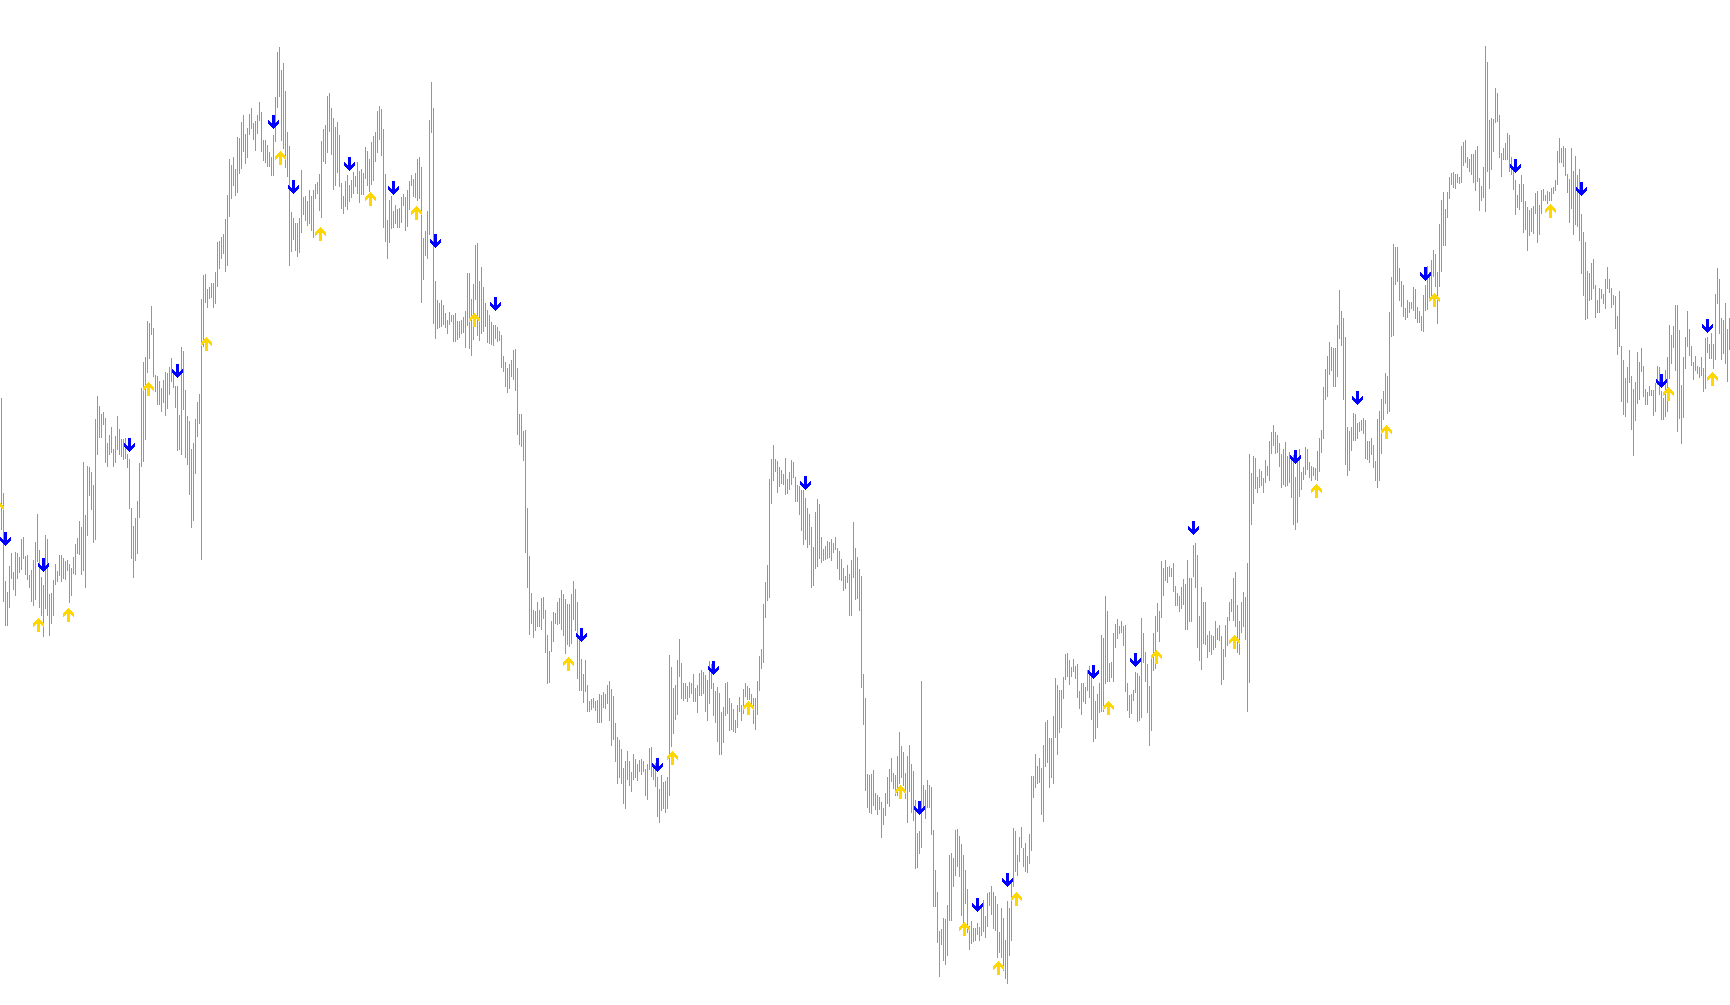
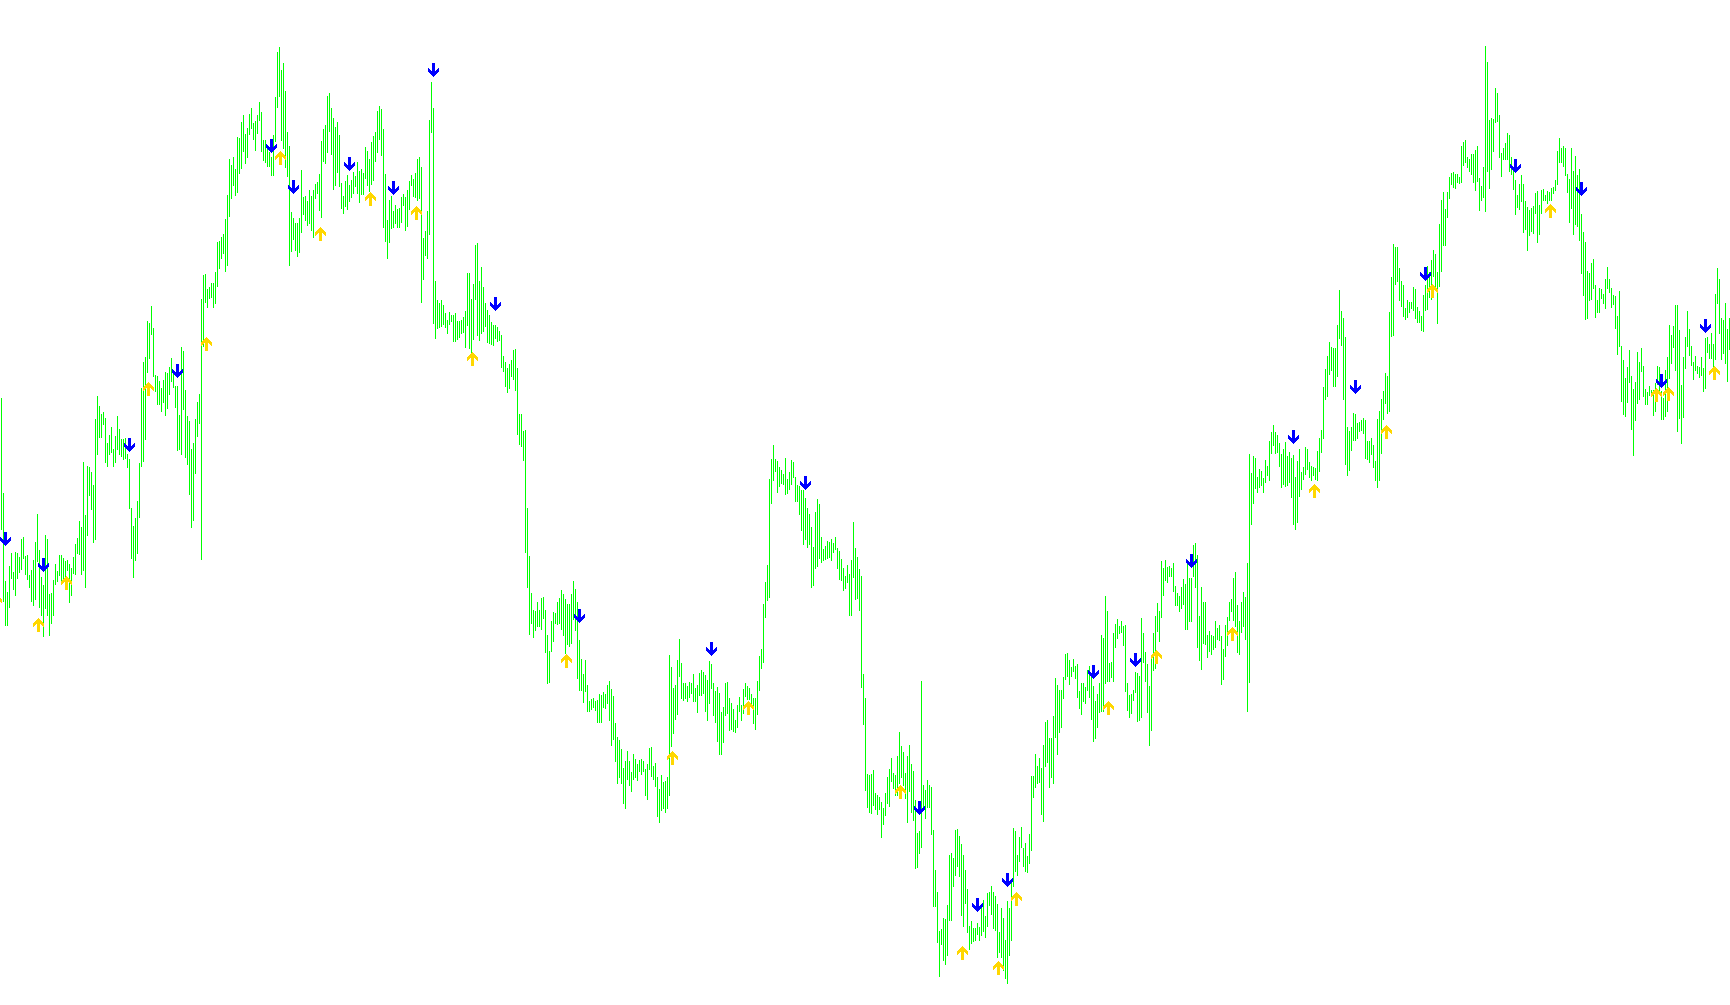
This indicator utilizes Ehlers' cyclicity algorithms to decompose price action into harmonic sine waves, identifying phase shifts and predictive leading signals for trend exhaustion.
Sinewave2_001
Indicator

Sinewave2_001

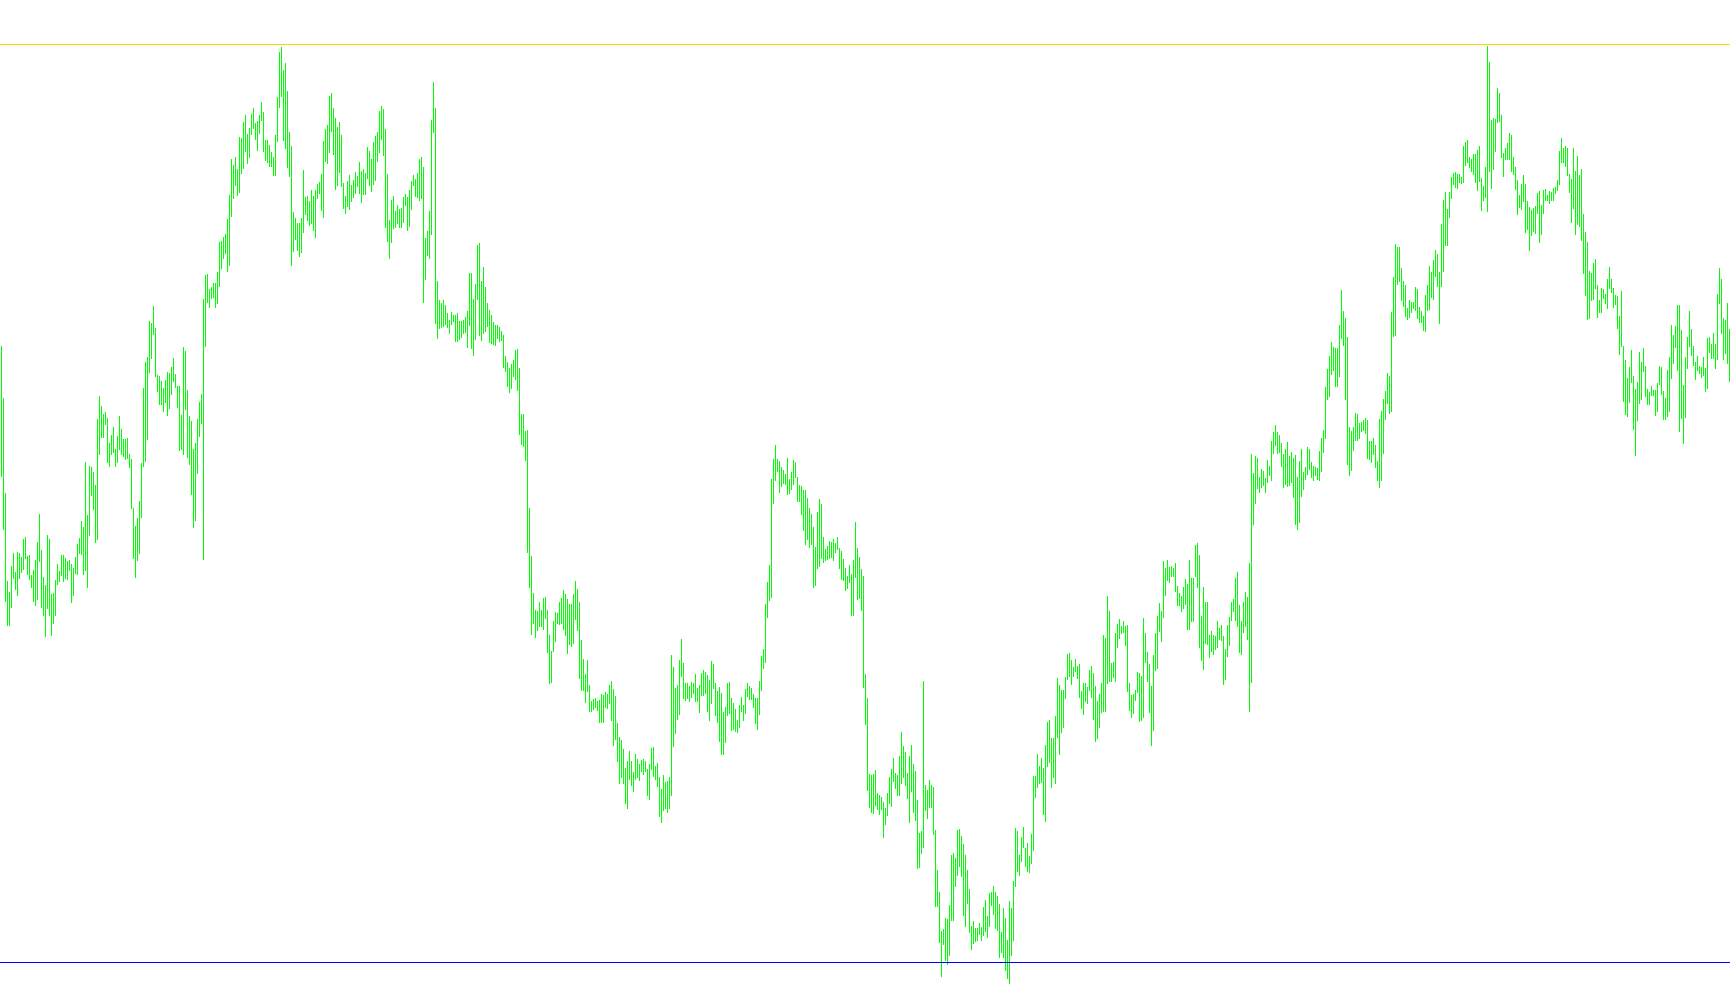
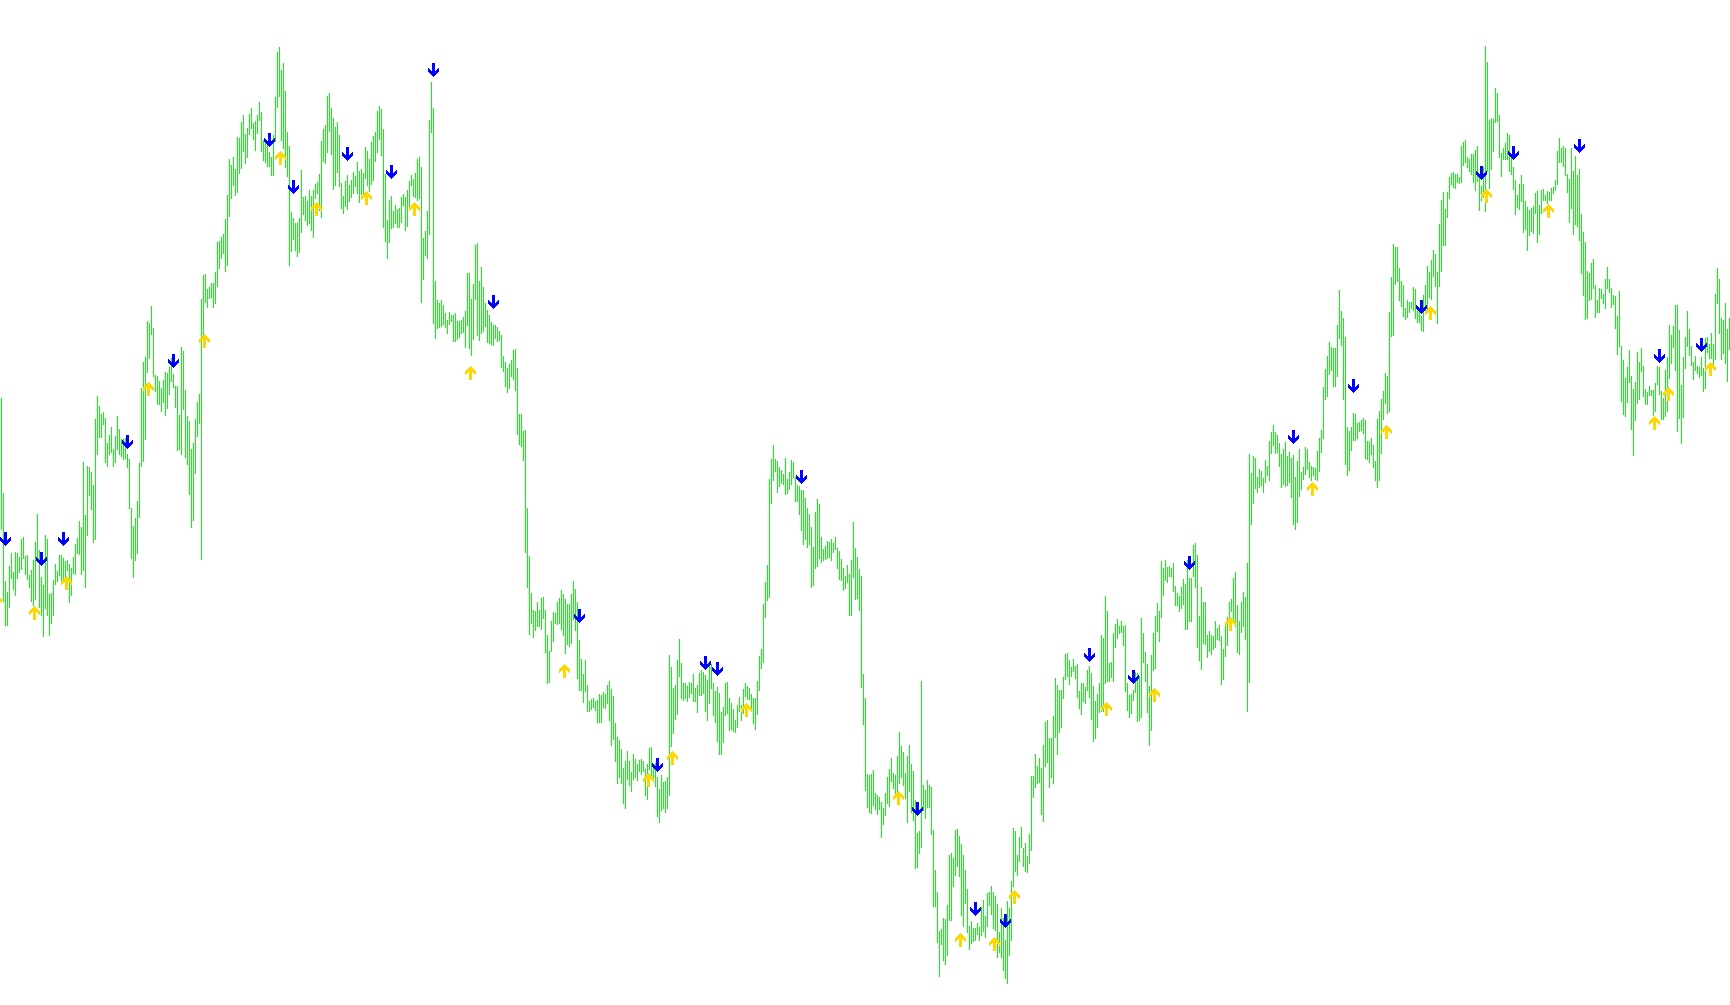
This indicator extracts cyclical components from price action by applying a recursive smoothing filter and calculating the dominant phase shift to project leading sine waves.

Sinewave3.1
Indicator

Sinewave3.1

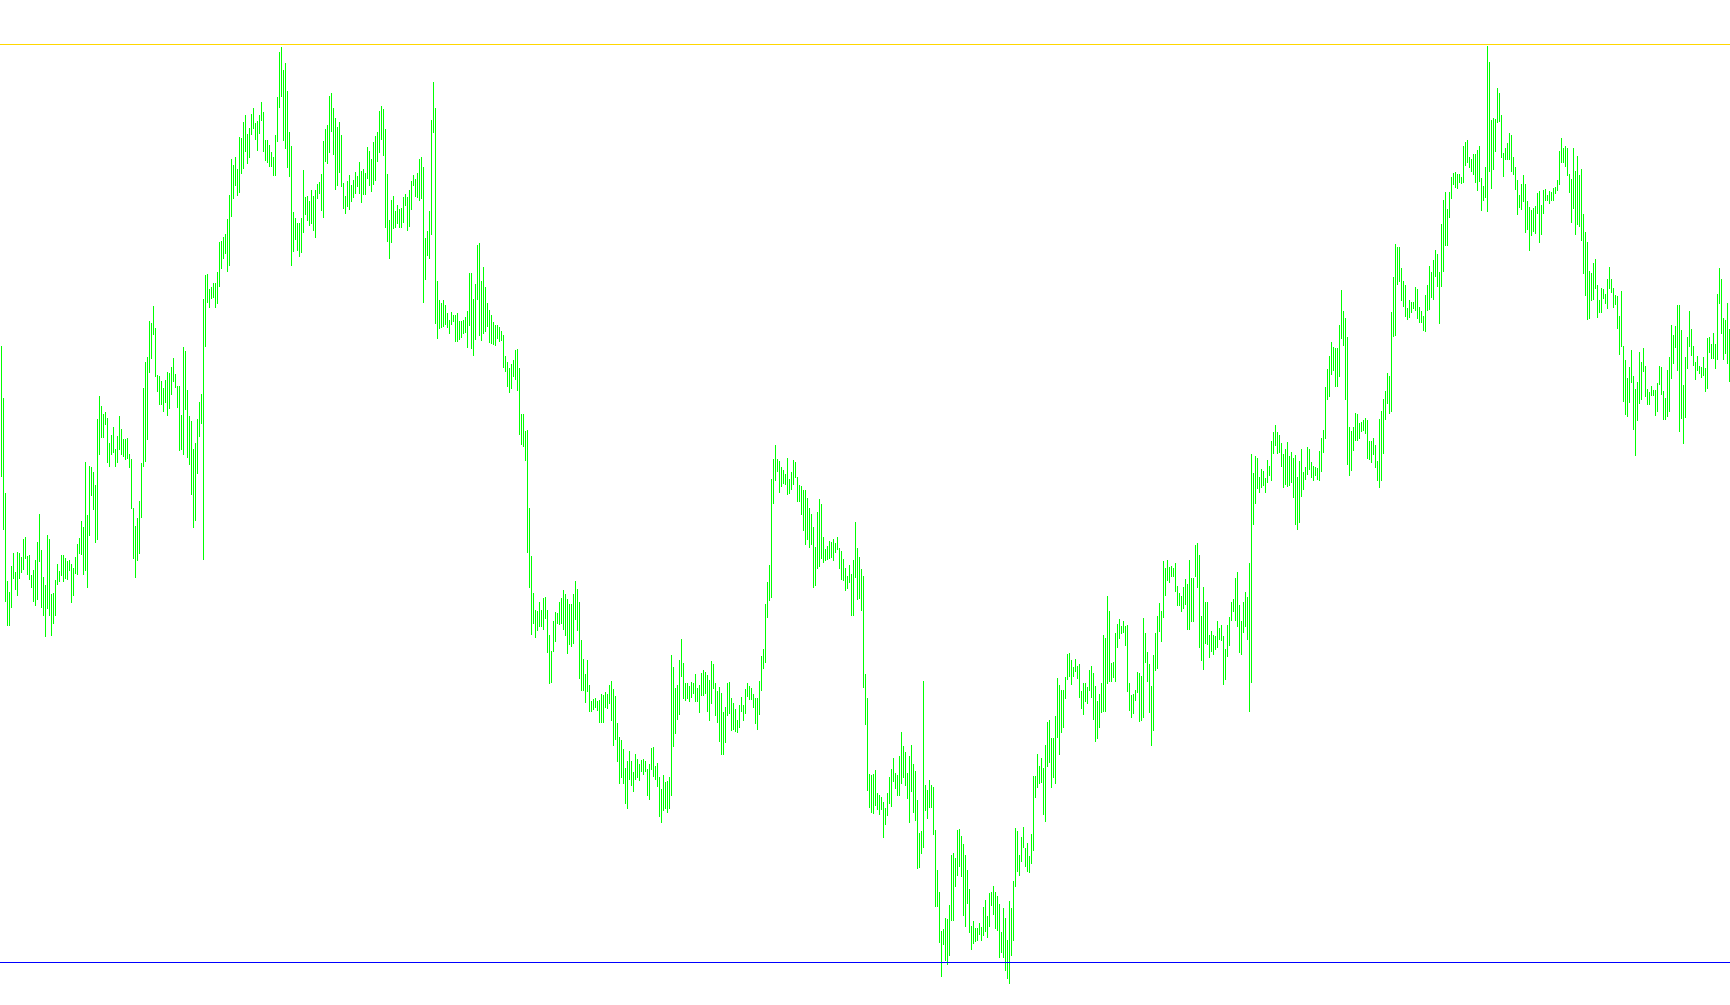
This indicator utilizes a recursive cycle decomposition and digital signal processing to extract underlying periodicities from price action, identifying momentum phases and dynamic support-resistance pivots.

Sinewave3
Indicator

Sinewave3

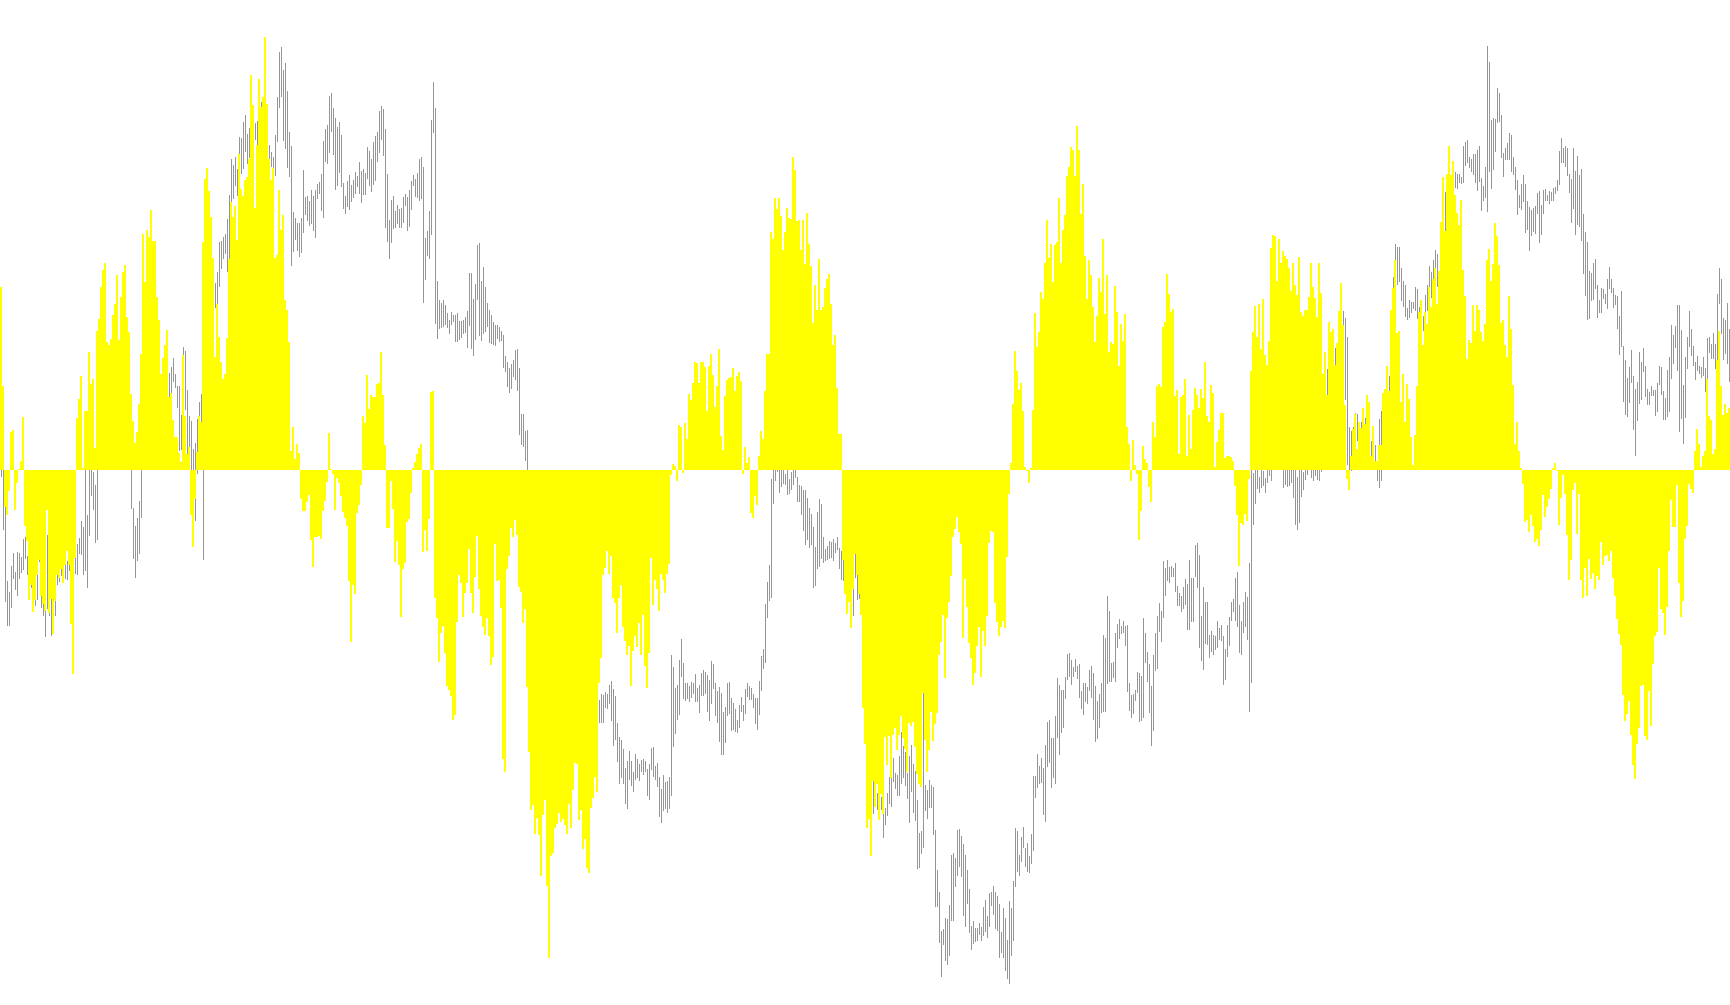
This indicator extracts cyclical components from price data using a smoothed sine wave transformation to identify phase shifts and automated support/resistance levels.

SineWaveIndv0.1
Indicator

SineWaveIndv0.1

This indicator utilizes Hilbert Transform components to calculate instantaneous cycles and dominant periods, deriving a smoothed sine wave trend based on the real-time detected phase.

sinTrend
Indicator

sinTrend

This indicator calculates the sine of the price differential relative to a dynamically adjusted timeframe period to visualize cyclical momentum shifts.

Indicator

sinTrendM4c_mtf

Indicator

sinTrendM4c_SigL_mtf

iMAOnArray
sinTrend[1]
Indicator

sinTrend[1]

This indicator quantifies price velocity by calculating the sine of the normalized difference between current and historical closing prices across dynamic timeframe-adjusted periods.

sinTrend_001
Indicator

sinTrend_001

This indicator calculates a sinusoidal wave based on the relative price displacement over dynamic timeframes to visualize cyclical momentum shifts.

sinTrend_v1
Indicator

sinTrend_v1

This indicator calculates a trigonometric sine function based on the price delta between current and historical closing prices across period-specific shifts.

Indicator

SixMA_allignment

iMA
Six_Consecutive_SA
Indicator

Six_Consecutive_SA

Identifies persistent directional trends by detecting six consecutive price openings moving in a single linear direction.

six_ind_v31
Indicator

six_ind_v31

This indicator identifies bullish and bearish reversals by detecting consecutive ascending or descending trends across six consecutive typical price calculation periods.

six_ind_v31_v1
Indicator

six_ind_v31_v1

This indicator identifies distinct bullish and bearish trend shifts by detecting consecutive six-period monotonic progression in the typical price calculation.

Skewness_v1
Indicator

Skewness_v1

This indicator calculates the statistical skewness of price action by measuring the deviation between Volume Weighted Average Price (VWAP) and Point of Control (PVP) normalized by standard deviation.

Skyscraper
Indicator

Skyscraper

This indicator identifies directional momentum by constructing a quantized price ceiling and floor based on ATR-derived volatility steps.

Skyscraper_v1
Indicator

Skyscraper_v1

This indicator identifies trend momentum by constructing a quantized, step-like trajectory based on ATR-derived price fluctuations and historical range extremes.

SLAndLots
Indicator

SLAndLots

This indicator calculates real-time trading volume by evaluating the price distance between entry and stop-loss levels against a fixed percentage of available account margin.

Slope Direction Line Alert
Indicator

Slope Direction Line Alert

iMAiMAOnArray

This indicator calculates a Hull Moving Average derivative to identify momentum shifts and visualizes trend direction through slope-based polarity changes.

Slope Direction Line Alert_001
Indicator

Slope Direction Line Alert_001

iMAiMAOnArray

This indicator identifies directional shifts by calculating the derivative of a Hull Moving Average to detect structural trend transitions and provide real-time price alerts.

Slope Direction Line Alert_002
Indicator

Slope Direction Line Alert_002

iMAiMAOnArray

This indicator calculates the directional velocity of a Hull Moving Average by processing a smoothed vector of weighted price differences to identify trend reversals.

Slope Direction Line
Indicator

Slope Direction Line

iMAiMAOnArray

This indicator identifies trend reversals by calculating the derivative of a dual-weighted moving average to map directional momentum changes.

Slope Direction Line_001
Indicator

Slope Direction Line_001

iMAiMAOnArray

This indicator calculates a smoothed trend momentum by applying an iterative moving average to the difference between dual Hull Moving Average components.

Slope Direction Line_002
Indicator

Slope Direction Line_002

iMAiMAOnArray

This indicator calculates the momentum of price movement by determining the direction of the Hull Moving Average slope to identify distinct trend shifts.

Slope Direction Line_004
Indicator

Slope Direction Line_004

iMAiMAOnArray

This indicator identifies market trajectory by calculating the differential between two moving averages and applying a secondary smoothing pass to isolate directional trend shifts.

Slope Direction Line_005
Indicator

Slope Direction Line_005

iMAiMAOnArray

This indicator calculates a Hull Moving Average derivative to isolate directional momentum and visually bifurcate bullish and bearish trend trajectories.

Slope Direction Line_v2
Indicator

Slope Direction Line_v2

iMAiMAOnArray

This indicator calculates a weighted moving average to determine price velocity and filters directional shifts into distinct bullish and bearish trend components.

SlopeDirectionLine
Indicator

SlopeDirectionLine

iMAiMAOnArray

This indicator identifies directional bias by calculating the derivative of a Hull Moving Average to isolate underlying momentum shifts.

SlopeDirection_MTF
Indicator

SlopeDirection_MTF

This indicator visualizes price momentum by mapping smoothed moving average trajectories from higher temporalities onto the current chart to identify structural bias.

SlopeDirection_MTF_
Indicator

SlopeDirection_MTF_

This indicator projects trend polarity by synchronizing higher timeframe moving average slopes onto the current chart via dynamic bar shifting.

SlopeDirection_MTF_v1
Indicator

SlopeDirection_MTF_v1

This indicator synchronizes and plots directional momentum from higher temporal frames onto the current chart to visualize long-term price trajectory.

Slope_Direction_Line
Indicator

Slope_Direction_Line

iMAiMAOnArray

This indicator calculates a smoothed trend trajectory by applying a moving average to the weighted difference between dual-period WMA calculations to identify directional momentum shifts.

Slope_Line
Indicator

Slope_Line

iMAiMAOnArray

This indicator utilizes a double-smoothed moving average calculation to filter market noise and identify the underlying directional momentum of price action.

slow-stoch
Indicator

slow-stoch

iStochastic

This indicator calculates a smoothed momentum trajectory by averaging the main and signal lines of the Stochastic oscillator over three consecutive bars to filter out high-frequency noise.

slow-stoch_v1
Indicator

slow-stoch_v1

iStochastic

This indicator calculates a three-period moving average of both the main and signal lines of a standard stochastic oscillator to filter out market noise.

SlowKD
Indicator

SlowKD

iMAOnArray

This indicator calculates a smoothed stochastic percentage based on relative price range boundaries to identify overextended trends and potential reversal zones.

SMA C
Indicator

SMA C

iMAiMAOnArray

The algorithm calculates a smoothed directional trajectory by applying a weighted moving average to the differential velocity between two nested moving averages.

SMA Cross Over Arrow
Indicator

SMA Cross Over Arrow

iMA

This indicator identifies and plots discrete geometric markers at the exact coordinates where a fast Simple Moving Average pierces through a slow SMA to highlight trend shifts.

SMA Cross Over ArrowAlert
Indicator

SMA Cross Over ArrowAlert

iMA

This indicator detects precise momentum shifts by identifying the instantaneous crossover points between a fast and slow simple moving average, visually marking trends and triggering real-time notifications.

SMA-Crossover_Signal
Indicator

SMA-Crossover_Signal

iMA

This indicator identifies specific price action pivot points by detecting momentum shifts where a fast simple moving average pierces a slower timeframe baseline.

SMA-Crossover_Signal_v1
Indicator

SMA-Crossover_Signal_v1

iMA

This indicator identifies precise bullish and bearish momentum shifts by detecting the exact intersection points of two distinct simple moving average periods.

sMACD
Indicator

sMACD

iMAiMAOnArray

This indicator identifies trend reversals by detecting precise crossover points between an exponential moving average difference histogram and its simple moving average signal line.

SmADX
Indicator

SmADX

iADX

This indicator applies a complex multi-stage weighted smoothing algorithm to the ADX, +DI, and -DI components to filter out market noise and identify latent directional trends.

SmADXbars
Indicator

SmADXbars

iADXiMAOnArray

This indicator dynamically maps price extremes based on the dominance of directional indices and applies a moving average to these shifted values to identify trend-biased price levels.

SmallHelp@Close
Indicator

SmallHelp@Close

Automatically terminates all open long and short positions immediately upon reaching a predefined minimum profit margin.

SmallHelp@CloseAll
Indicator

SmallHelp@CloseAll

This script performs an exhaustive, recursive scan of all open positions to force-terminate every active buy and sell order immediately upon execution.

SmATR
Indicator

SmATR

iATR

This indicator applies a triple-smoothed moving average filter to the Average True Range to isolate underlying market volatility trends.

SMA_ CROSSOVER SIGNAL
Indicator

SMA_ CROSSOVER SIGNAL

iMA

Identifies and visualizes exact crossover points between two simple moving averages using dynamic price range offsets for enhanced visibility.

SMA_ CROSSOVER SIGNAL_v1
Indicator

SMA_ CROSSOVER SIGNAL_v1

iMA

This indicator identifies and visualizes precise crossover points between two customizable moving averages while providing real-time alerts for momentum shifts.