sinTrend
Download script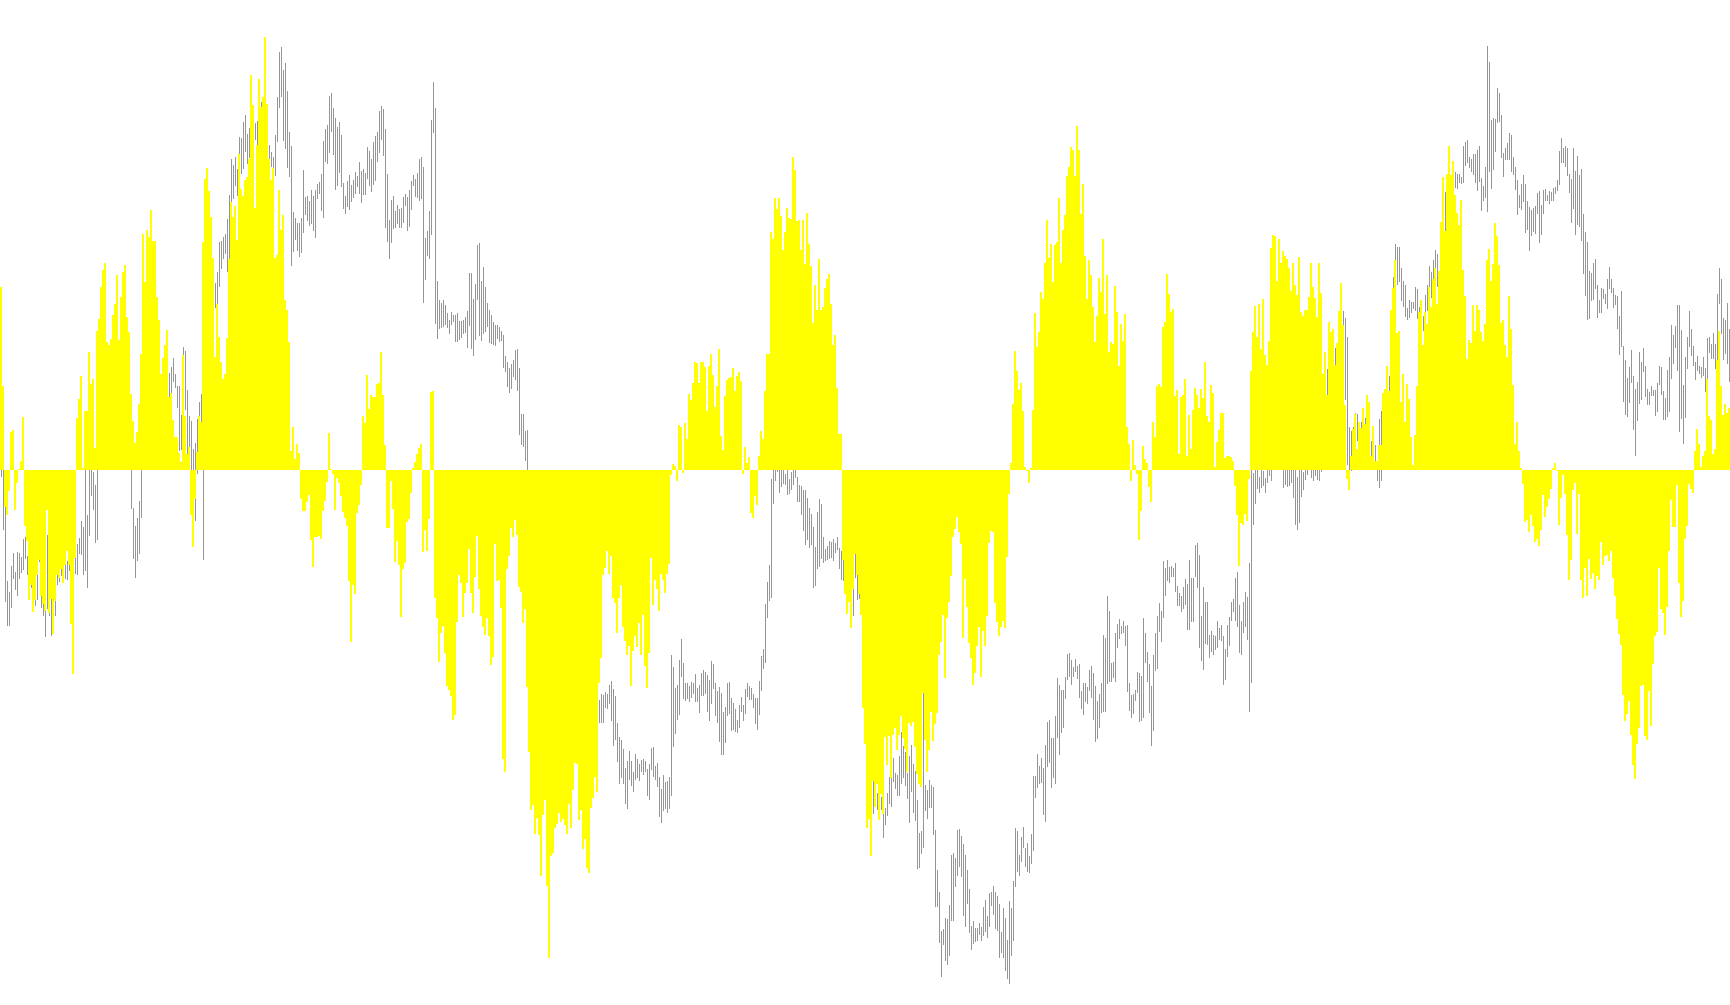
The TrendOSC is a specialized visual analysis tool designed to help traders identify underlying trends and cycles within financial markets. Unlike standard indicators that might focus solely on immediate price movements, this script applies a mathematical approach to smooth out "market noise" and highlight the broader direction of the price action.
How the Logic Works
The core functionality of this indicator can be broken down into three main components:
1. Dynamic Timeframe Adaptation One of the most sophisticated features of this tool is its ability to automatically detect which timeframe you are currently viewing (e.g., 1-minute, 1-hour, daily, or monthly charts). Instead of requiring the user to manually change settings every time they switch perspectives, the script internally calculates a specific "Lookback Period."
For example:
- On a high-frequency chart (like 1 minute), it looks at a wider window of data to capture the trend.
- On a long-term chart (like Monthly), it narrows its focus to provide more precise, immediate feedback. This ensures that the indicator remains relevant and accurate regardless of whether you are day trading or swing trading.
2. The Mathematical Calculation (Sine Wave Logic) The script determines its visual output by measuring the difference between the current closing price and the closing price from a specific point in the past (determined by the adaptive periods mentioned above). It then processes this difference using a Sine function.
By converting price changes into a trigonometric wave, the indicator:
- Filters out erratic, minor price fluctuations.
- Highlights the "rhythm" of the trend.
- Visualizes whether the current price movement is accelerating, decelerating, or staying within a stable cycle.
3. Visual Representation The result of these calculations is plotted as a yellow histogram in a separate window below your main price chart. This separation allows you to monitor the "momentum" or "oscillation" of the trend independently from the actual price bars.
Summary for the User
In simple terms, this tool acts like a "trend filter." It automatically adjusts its sensitivity based on your chosen timeframe and uses a mathematical wave formula to show you the smoothed-out direction of the market. It helps you see whether the current move is part of a larger, sustained trend or just a minor fluctuation in the price cycle.
//+------------------------------------------------------------------+
//|                                                     TrendOSC.mq4 |
//|                      Copyright © 2005, MetaQuotes Software Corp. |
//|                                        http://www.metaquotes.net |
//+------------------------------------------------------------------+
#property copyright "Copyright © 2005, DVYU."
#property link      "http://www.DVYU.ox"
#property indicator_buffers 1
#property indicator_color1 Yellow
#property indicator_separate_window
//#property indicator_minimum -1
//#property indicator_maximum 1
//ïàðàìåòðû
int g_period;
//.extern int dBar=3;
//Îáúÿâëåíèå ãëîáàëüíûõ ïåðåìåííûõ
double z_buffer[];
//double SpeedTrend1;
double dBar;
int x;
//+------------------------------------------------------------------+
//| Custom indicator initialization function                         |
//+------------------------------------------------------------------+
int init()
  {

  SetIndexStyle(0, DRAW_HISTOGRAM, EMPTY, 2, Yellow);
  SetIndexBuffer(0,z_buffer);
  IndicatorDigits(4);

  int x=Period();
  //string P;
  //Äëÿ ïîäáîðà ñìåùåíèÿ (shift) èíäèêàòîðà èçìåíèòå çíà÷åíèå g_period äëÿ íóæíîãî ïåðèîäà ãðàôèêà
  switch (x)
  {
  case 1:g_period=110;
  Comment("Ìèíóòíûé ãðàôèê","   ","Ñìåùåíèå",g_period);
  break;
  case 5:g_period=90;
  Comment("Ïÿòèìèíóòíûé ãðàôèê","   ","Ñìåùåíèå",g_period);
   break;
  case 15:g_period=60;
  Comment("Ïÿòíàäöàòèìèíóòíûé ãðàôèê","   ","Ñìåùåíèå",g_period);
   break;
  case 30:g_period=42;
  Comment("Ïîëó÷àñîâîé ãðàôèê","   ","Ñìåùåíèå",g_period);
   break;
  case 60:g_period=36;
  Comment("×àñîâîé ãðàôèê","   ","Ñìåùåíèå",g_period);
   break;
  case 240:g_period=24;
  Comment("×åòûðåõ÷àñîâîé ãðàôèê","   ","Ñìåùåíèå",g_period);
   break;
  case 1440:g_period=18;
  Comment("Äíåâíîé ãðàôèê","   ","Ñìåùåíèå",g_period);
   break;
  case 10080:g_period=12;
  Comment("Íåäåëüíûé  ãðàôèê","   ","Ñìåùåíèå",g_period);
   break;
  case 43200:g_period=3;
  Comment("Ìåñÿ÷íûé ãðàôèê","   ","Ñìåùåíèå",g_period);
   break;
  }
   return(0);
  }
//+------------------------------------------------------------------+
//| Custor indicator deinitialization function                       |
//+------------------------------------------------------------------+
int deinit()
  {
//----

//----
  return(0);
  }
//+------------------------------------------------------------------+
//| Custom indicator iteration function                              |
//+------------------------------------------------------------------+
int start()
  {
  int limit = 0;
  int z;
int counted_bars=IndicatorCounted();
      if(counted_bars<0) return(-1);
          if(counted_bars>0) counted_bars--;
              limit=Bars-counted_bars;

   for  (int i=0; i<limit; i++)
{

 z_buffer[i]=MathSin((Close[i]-Close[i+g_period])/g_period);


 }


//----

//----
   return(0);
  }
//+------------------------------------------------------------------+
Comments