six_ind_v31
Download script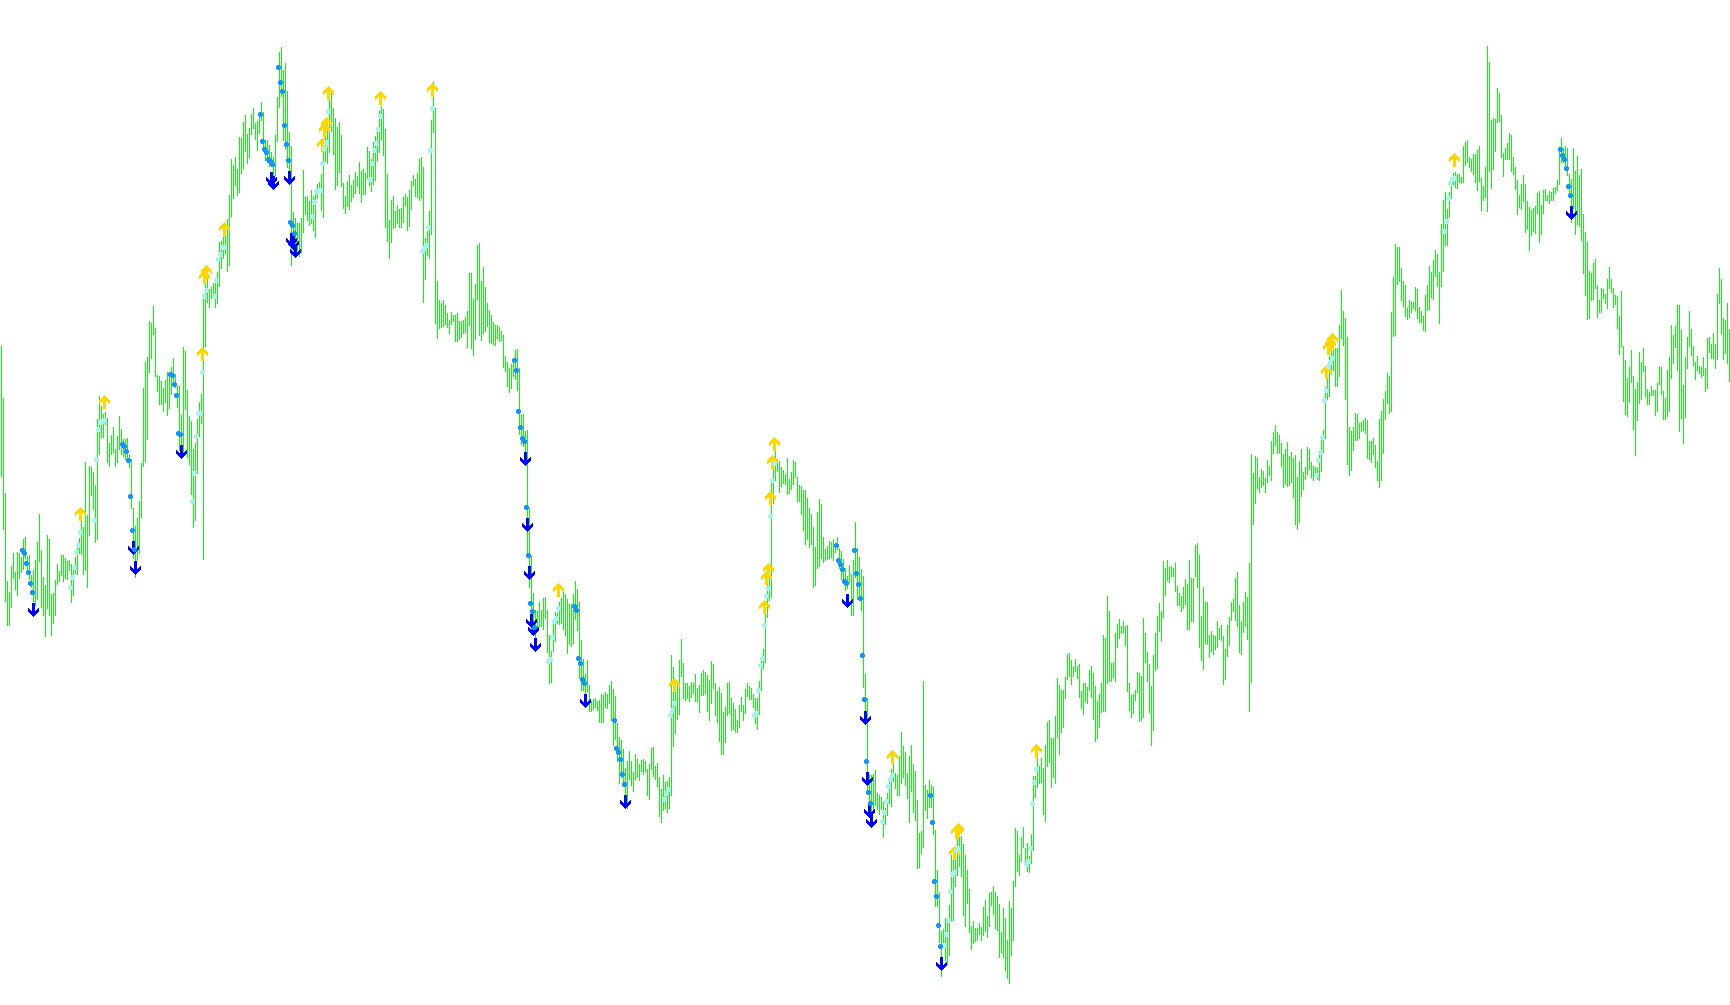
This script is designed as a visual trading indicator for the MetaTrader platform. Its primary purpose is to identify specific directional trends in price action by analyzing a sequence of recent price movements.
Core Logic Overview
The tool functions by calculating a "Typical Price" for every candle on your chart. This value is determined by averaging the high, low, and closing prices of a specific period. Instead of looking at just one price point, the script monitors a continuous string of six consecutive candles to determine the overall momentum of the market.
How it Identifies Trends
The script looks for two specific types of "perfect" sequences:
- Downward Momentum: The logic checks if the typical price has been consistently decreasing over six consecutive bars. If each new candle's typical price is lower than the one before it (moving in a steady step-down fashion), the script flags this as a bearish trend.
- Upward Momentum: Conversely, the logic checks if the typical price has been consistently increasing over six consecutive bars. If each new candle's typical price is higher than the previous one (moving in a steady step-up fashion), the script flags this as a bullish trend.
Visual Representation
When these specific conditions are met, the script provides visual cues directly on your chart:
- Trend Alerts: The indicator places specific arrow markers to notify you when a sequence has completed. These arrows serve as visual signals that a consistent movement pattern has been established over those six periods.
- Pattern Mapping: In addition to the alerts, the script "maps" the typical prices of the six candles involved in the trend. This allows you to see the exact path the price took to create the signal, helping to visualize the consistency of the move from the start of the sequence to its conclusion.
Summary for the User
Essentially, this tool filters out minor market noise to highlight sustained, sequential movements. Rather than reacting to a single spike or drop, it waits until the market demonstrates a consistent six-step progression in one direction before marking the chart with visual indicators.
//+------------------------------------------------------------------+
//| test.mq4                                                         |
//+------------------------------------------------------------------+
#property copyright "Ron T"
#property link      "http://www.lightpatch.com"

#property indicator_chart_window
#property indicator_buffers 4
#property indicator_color1 White
#property indicator_color2 Red
#property indicator_color3 White
#property indicator_color4 Red

//---- buffers
double ExtMapBuffer1[];
double ExtMapBuffer2[];
double ExtMapBuffer3[];
double ExtMapBuffer4[];


// User Input


//+------------------------------------------------------------------+
//| Custom indicator initialization function                         |
//|------------------------------------------------------------------|

int init()
  {

   SetIndexStyle(0,DRAW_ARROW);
   SetIndexBuffer(0, ExtMapBuffer1);
   SetIndexArrow(0,233); //up red

   SetIndexStyle(1,DRAW_ARROW);
   SetIndexBuffer(1, ExtMapBuffer2);
   SetIndexArrow(1,234); //down white

   SetIndexStyle(2,DRAW_ARROW);
   SetIndexBuffer(2, ExtMapBuffer3);
   SetIndexArrow(2,159); //white open square

   SetIndexStyle(3,DRAW_ARROW);
   SetIndexBuffer(3, ExtMapBuffer4);
   SetIndexArrow(3,159); //white open square

   return(0);
  }


//+------------------------------------------------------------------+
//| Custor indicator deinitialization function                       |
//+------------------------------------------------------------------+
int deinit()
  {
   int i;

   for( i=0; i<Bars; i++ ) ExtMapBuffer1[i]=0;
   for( i=0; i<Bars; i++ ) ExtMapBuffer2[i]=0;
   for( i=0; i<Bars; i++ ) ExtMapBuffer3[i]=0;
   for( i=0; i<Bars; i++ ) ExtMapBuffer4[i]=0;

   return(0);
  }


//+------------------------------------------------------------------+
//| Custom indicator iteration function                              |
//+------------------------------------------------------------------+
int start()
  {
   double oTYP0=0, oTYP1=0, oTYP2=0, oTYP3=0, oTYP4=0, oTYP5=0;

   int pos=Bars;

   while(pos>=0)
     {
      // six-period typical
      oTYP0=(High[pos+0]+Low[pos+0]+Close[pos+0]+Close[pos+0])/4;
      oTYP1=(High[pos+1]+Low[pos+1]+Close[pos+1]+Close[pos+1])/4;
      oTYP2=(High[pos+2]+Low[pos+2]+Close[pos+2]+Close[pos+2])/4;
      oTYP3=(High[pos+3]+Low[pos+3]+Close[pos+3]+Close[pos+3])/4;
      oTYP4=(High[pos+4]+Low[pos+4]+Close[pos+4]+Close[pos+4])/4;
      oTYP5=(High[pos+5]+Low[pos+5]+Close[pos+5]+Close[pos+5])/4;

      // six-period down
      if(oTYP5>oTYP4 && oTYP4>oTYP3 && oTYP3>oTYP2 && oTYP2>oTYP1 && oTYP1>oTYP0)
        {
         ExtMapBuffer1[pos]=0;
         ExtMapBuffer2[pos]=oTYP0-0.0005;  //down red

         ExtMapBuffer4[pos+0]=oTYP0;
         ExtMapBuffer4[pos+1]=oTYP1;
         ExtMapBuffer4[pos+2]=oTYP2;
         ExtMapBuffer4[pos+3]=oTYP3;
         ExtMapBuffer4[pos+4]=oTYP4;
         ExtMapBuffer4[pos+5]=oTYP5;
        }


      if(oTYP5<oTYP4 && oTYP4<oTYP3 && oTYP3<oTYP2 && oTYP2<oTYP1 && oTYP1<oTYP0)
        {
         // six-period up
         ExtMapBuffer1[pos]=oTYP0+0.0005;  //up white
         ExtMapBuffer2[pos]=0;

         ExtMapBuffer3[pos+0]=oTYP0;
         ExtMapBuffer3[pos+1]=oTYP1;
         ExtMapBuffer3[pos+2]=oTYP2;
         ExtMapBuffer3[pos+3]=oTYP3;
         ExtMapBuffer3[pos+4]=oTYP4;
         ExtMapBuffer3[pos+5]=oTYP5;
        }
 	   pos--;
     }

   return(0);
  }
//+------------------------------------------------------------------+
Comments