Solar Winds_v1
Indicator

Solar Winds_v1

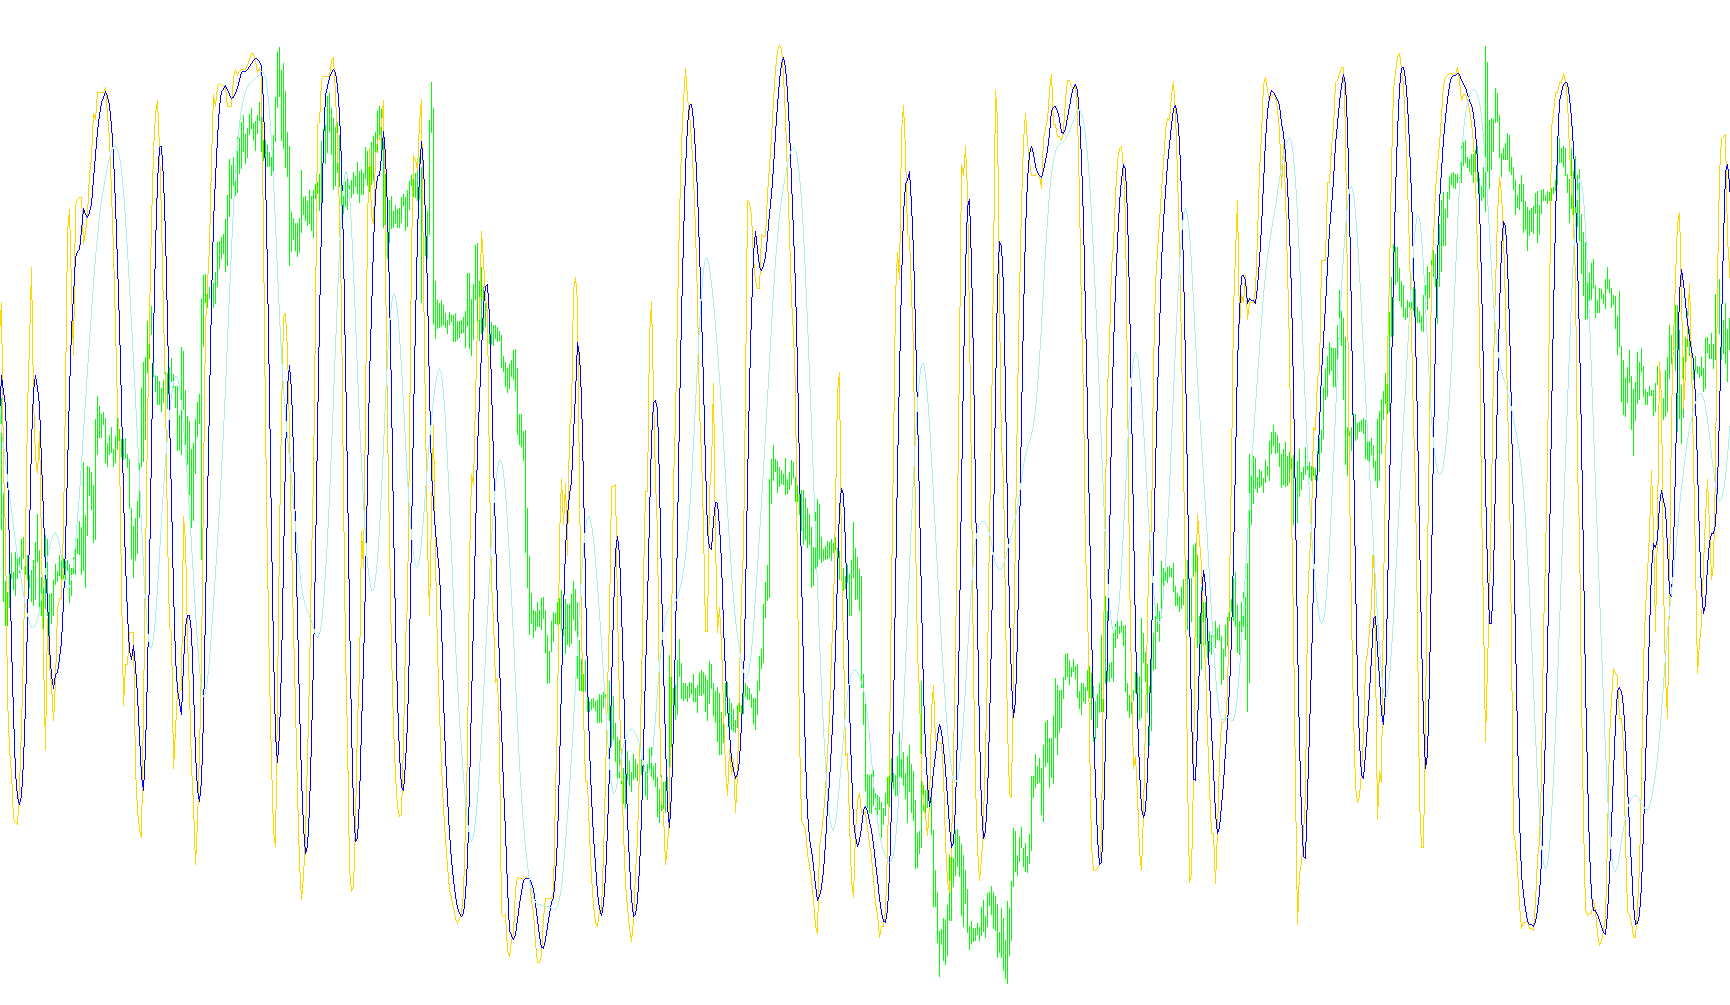
This indicator calculates a smoothed price position relative to the local high-low range using a recursive smoothing algorithm and logarithmic transformation to identify trend reversals.

Solar Winds_v2
Indicator

Solar Winds_v2

The indicator utilizes a smoothed high-low range normalization combined with logarithmic transformation to visualize price velocity and directional shifts.

Solar Wind_v1
Indicator

Solar Wind_v1

This indicator calculates a normalized price action velocity by mapping the midpoint relative to its high-low range into a logarithmic momentum curve to identify directional shifts.

solarwindfastalert
Indicator

solarwindfastalert

The algorithm identifies specific momentum shifts by detecting zero-crossings in positive and negative directional components from a secondary solar wind oscillator.

SolarWind_2
Indicator

SolarWind_2

This indicator utilizes a logarithmic transformation of normalized price action relative to its high-low range to visualize momentum shifts and trend exhaustion.

solarwind_2_590
Indicator

solarwind_2_590

This indicator transforms price range positioning into a logarithmic scale to identify overextended momentum shifts and directional reversals.

Solar_Wind
Indicator

Solar_Wind

The algorithm utilizes a normalized price range calculation combined with a logarithmic smoothing function to detect directional shifts in market momentum.

Solar_Wind1
Indicator

Solar_Wind1

This indicator calculates a normalized price position relative to the high-low range over a set period, applying a weighted moving average and logarithmic transformation to visualize trend velocity.

Indicator

Solar_Wind_clean_mtf

Solar_Wind_clean_X
Indicator

Solar_Wind_clean_X

iMAOnArray

This indicator normalizes price range volatility into a bounded distribution using the Fisher Transform and applies an exponential moving average to smooth out momentum fluctuations.

Solar_Wind_clean_Xalert
Indicator

Solar_Wind_clean_Xalert

iMAOnArray

This indicator applies a non-linear Fisher Transformation to price action normalized within a high-low range, followed by an exponential moving average to identify momentum shifts and zero-line crossovers.

Solar_Wind_clean_Xalert_001
Indicator

Solar_Wind_clean_Xalert_001

iMAOnArray

This indicator normalizes price action into a bounded range before applying a logarithmic Fisher Transformation and an Exponential Moving Average to identify zero-line momentum crossovers.

Indicator

Solar_Wind_clean_XSm_mtf

iMAOnArray
Indicator

Solar_Wind_clean_X_mtf

iMAOnArray
Solar_Wind_clean_X_v2
Indicator

Solar_Wind_clean_X_v2

iMAOnArray

This indicator applies a Fisher Transformation to price range dynamics, followed by an exponential moving average to smooth out directional volatility into a binary histogram.

Sonic_Ind_v1.0
Indicator

Sonic_Ind_v1.0

iACiAOiMAiStochastic

This indicator identifies market momentum by correlating Accelerator Oscillator and Stochastic crossovers with Laguerre-ACS1 thresholds, refined through optional SMA and RSI trend filters.

Sonic_StoIK
Indicator

Sonic_StoIK

iDeMarkeriForceiRSIiStochastic
sOptimisationDates
Indicator

sOptimisationDates

This script identifies and exports specific historical date ranges that satisfy minimum bar-count requirements for sequential optimization.

SoSo_Time
Indicator

SoSo_Time

Visualizes concurrent active trading windows for major world financial hubs to identify liquidity overlaps and high-volatility periods.

SoundAtOpenNewBar
Indicator

SoundAtOpenNewBar

Executes an automated acoustic notification precisely at the inception of every new candle to facilitate real-time price action awareness.

sParabolic_Sub
Indicator

sParabolic_Sub

This indicator calculates a dynamic parabolic stop value that accelerates based on trend momentum and triggers alerts upon price crossovers to identify potential trend exhaustion and reversals.

SpearmanRankCorr
Indicator

SpearmanRankCorr

This indicator quantifies the monotonic relationship between sequential price data points by calculating the Pearson correlation coefficient of their relative ranks over a sliding window.

SpearmanRankCorrS
Indicator

SpearmanRankCorrS

iMAOnArray

This indicator quantifies the monotonic relationship between price movements by calculating the Spearman rank correlation coefficient across a rolling window to identify trend strength independent of volatility.

SpearmenRankCorrelation_NTF_variant3colors
Indicator

SpearmenRankCorrelation_NTF_variant3colors

This indicator identifies non-linear trend synchronization by comparing the Spearman Rank Correlation coefficient across multiple timeframes to detect significant momentum shifts.

Special RSI ARROW
Indicator

Special RSI ARROW

iATRiMAOnArrayiRSI

This indicator identifies trend reversals by calculating the exponential moving average of the delta between two distinct RSI periods to detect significant momentum shifts.

Special RSI ARROW_001
Indicator

Special RSI ARROW_001

iMAOnArrayiRSI

This indicator identifies trend reversals by calculating a smoothed moving average of the delta between two different RSI periods and generating directional signals based on significant threshold breaches.

Indicator

Specification

Spectr
Indicator

Spectr

iMA

This indicator decomposes price action using linear regression and Fourier analysis to project multiple harmonic frequency waves over a moving average base.

Spectrometr_Separate
Indicator

Spectrometr_Separate

iMA

This indicator decomposes price action into fundamental cycles by applying a Fast Fourier Transform (FFT) to linear regression residuals to isolate dominant harmonic frequencies.

Speed
Indicator

Speed

This indicator quantifies price velocity by normalizing the rate of change in pips relative to volume fluctuations across multiple adjustable threshold filters.

Speed2
Indicator

Speed2

This indicator quantifies price velocity by calculating the normalized rate of change between consecutive bars against a moving average of pip movements, filtered by specific volatility thresholds.

Speed2_001
Indicator

Speed2_001

This indicator calculates the normalized rate of price movement relative to a rolling six-period average to identify high-momentum shifts.

Speed2_pips
Indicator

Speed2_pips

This indicator filters price fluctuations based on a specific pip range to calculate the cumulative net velocity of price movement relative to previous candles.

Speed2_pips_001
Indicator

Speed2_pips_001

This indicator isolates and accumulates net price fluctuations that fall within a specific pip range to identify sustained momentum shifts.

Speed3
Indicator

Speed3

This indicator calculates the instantaneous rate of change in trading volume relative to a six-period moving average to identify momentum shifts.

Speed3_001
Indicator

Speed3_001

This indicator calculates the normalized rate of change in trading volume relative to a six-period moving average to identify instantaneous pressure shifts.

Speed4
Indicator

Speed4

This indicator calculates the rate of price change relative to volume fluctuations across consecutive bars to determine momentum velocity.

Speed4_001
Indicator

Speed4_001

This indicator calculates the rate of price change relative to volume fluctuations over a specific historical window to identify momentum intensity.

Speed5
Indicator

Speed5

The algorithm calculates a recursive trigonometric decay mapped against price point normalization to visualize cyclical momentum shifts.

Speed5_001
Indicator

Speed5_001

This indicator calculates periodic price fluctuations by applying a cosine-based trigonometric transformation to the historical data index to reveal underlying cyclical momentum.

Speedometer_v1
Indicator

Speedometer_v1

This indicator quantifies price rate of change by calculating the instantaneous speed of price movement relative to time elapsed during each candle.

Speedometer_v1_mod_v01
Indicator

Speedometer_v1_mod_v01

Calculates the rate of price change relative to elapsed time and differentiates it to highlight acceleration in bullish and bearish movements.

SpeedTick
Indicator

SpeedTick

This indicator quantifies the cumulative frequency of price movements by incrementing counters based on successive tick directionality within each individual bar.

Speed_001
Indicator

Speed_001

This indicator calculates the ratio between price movement intensity and volume flux over a multi-bar period to identify momentum anomalies.

speed_ind
Indicator

speed_ind

Identifies directional shifts by calculating price displacement velocity relative to preceding bars and filtering for specific momentum thresholds.

Speed_Kharko
Indicator

Speed_Kharko

This indicator calculates and visualizes price momentum by comparing current velocity metrics against historical data points to identify acceleration trends.

Speed_WABSV
Indicator

Speed_WABSV

This indicator quantifies directional pressure by aggregating tick volume based on price movement polarity across multi-timeframe M1 data points.

Speed_WABSV2
Indicator

Speed_WABSV2

This indicator quantifies market participation by aggregating tick volume into directional cumulative streams based on price movement delta.

Spread Alert
Indicator

Spread Alert

This script monitors real-time fluctuations in point differentials and minimum trade distance thresholds to notify the user of sudden liquidity shifts.

Spread Alert_v1
Indicator

Spread Alert_v1

This indicator provides real-time alerts by detecting fluctuations in the instantaneous price gap and minimum order distance relative to baseline market conditions.